2154
Diaphragm displacement during ABC controlled breath holding: is there an optimal inspiratory threshold?1University Hospitals of Leicester NHS Trust, Leicester, United Kingdom, 2CRUK Cancer Imaging Centre, Institute of Cancer Research and Royal Marsden Hospital, London, United Kingdom
Synopsis
Diaphragm motion range during controlled breath-holding at three different inspiratory levels was assessed during dynamic MRI employing an Active Breathing Coordinator (ABC). Colour intensity projections displayed diaphragm position with time. Diaphragm displacements were calculated from difference images between the end and beginning of breath-holds. Overall, diaphragm volume displacements were smaller for the 75% deep inhalational volume (DIV) threshold typically applied in lung and breast radiotherapy, than for the shallower inspiratory levels of 50% and 25% DIV. The clinical standard 75% DIV threshold not only expands the lungs more but also decreases diaphragm motion range.
Purpose
Lung and breast radiotherapy often employ an Active Breathing Coordinator (ABC, Elekta Oncology Systems, Crawley, UK) to induce reproducible breath-holds at a specified respiratory level for a predefined duration. An inspiratory threshold of 75% deep inhalational volume (DIV) is typically applied1 to expand the lungs, spare healthy tissue and reduce treatment margins. Nevertheless, diaphragm motion has been observed during breath-holding2, implying neighbouring tumour motion. A high motion range might counterbalance the lung expansion advantages. We investigated if different inspiratory thresholds affect diaphragm displacements during dynamic volunteer MRI utilising an MR-compatible ABC3.Methods
Five healthy volunteers (two females, three males, age range 25-58 yrs), were trained for ABC use and their individual DIV was assessed. They were positioned on a radiotherapy treatment positioning board (Oncology Systems Limited, Shropshire, UK) supporting their arms and the ABC, on the couch of a 1.5T Siemens Aera. Four sagittal TrueFISP slices including the diaphragm (10mm thickness; 1mm gap; TR/TE 2.16/1.08ms; pixel size 2.8mm*2.8mm) were acquired with a temporal resolution of 0.58s during ABC-controlled breath-holding for 24.5s at 75%, 50% or 25% DIV. Three measurements were performed for each inspiratory level per volunteer.
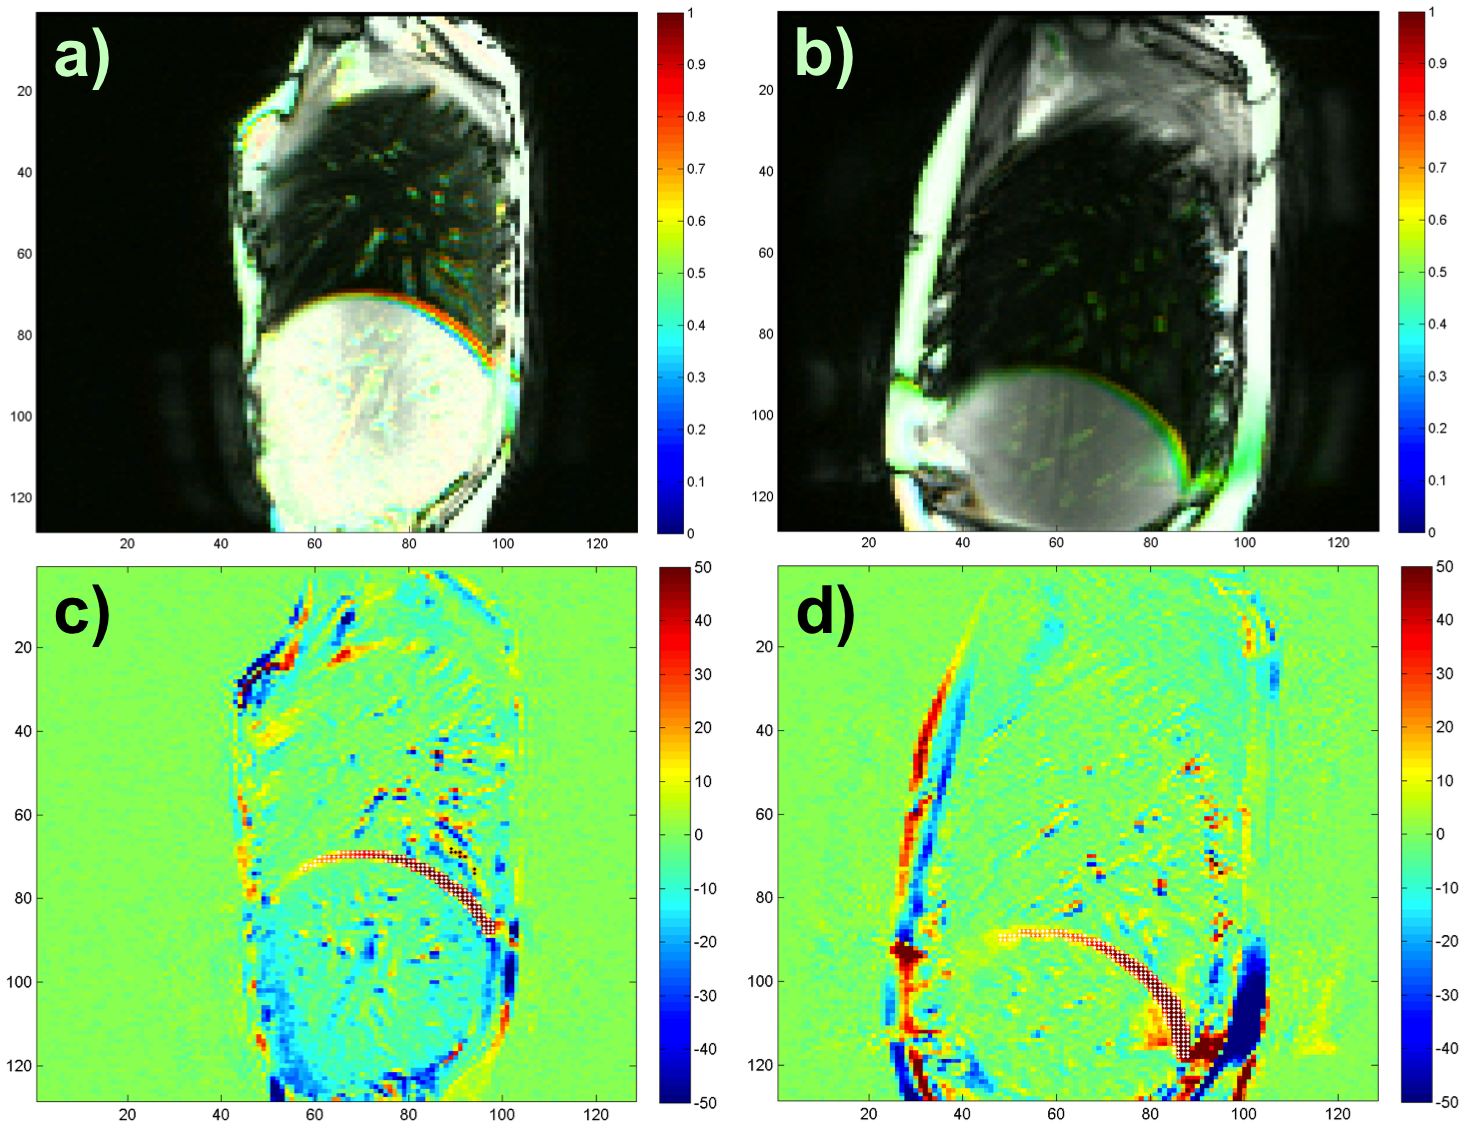
In order to visualise diaphragm position with time, a colour intensity projection (CIP) image was calculated by MATLAB adaptation of the algorithm described by Cover et al4 for each breath-hold measurement and slice. Moreover, diaphragm displacements between the last and the third image of each acquired slice (the two first images were discarded as magnetisation had not reached steady state) were detected by intensity thresholding on their difference image using custom MATLAB software. The detection algorithm defined a box containing the diaphragm and considered adjacent pixels with difference > 12 as displaced. Results were visually examined, and if necessary artefacts (ex. due to vessels) were manually removed. The total diaphragm displacement volume was obtained from the sum of accepted difference pixels over all slices for each measurement. To account for inter-subject size variations, the displacement volumes of each volunteer were normalised to the maximum volume measured for that particular subject. An ANOVA on the normalised diaphragm displacements compared the three inspiratory levels over all subjects.
Results
Example CIP and difference images with detected diaphragm displacements are displayed on figure 1. Blue, green or orange bands on CIP images indicate positions occupied by the diaphragm for about 90%, 50% or 10% of the acquisition time, respectively. Blue or red areas on difference images suggest initial or final tissue position, respectively. In general, the total size of diaphragm motion bands on CIP images agreed with the detected displacement area on difference images. Motion was observed during the last breath-holding seconds and was greater at posterior diaphragmatic areas.
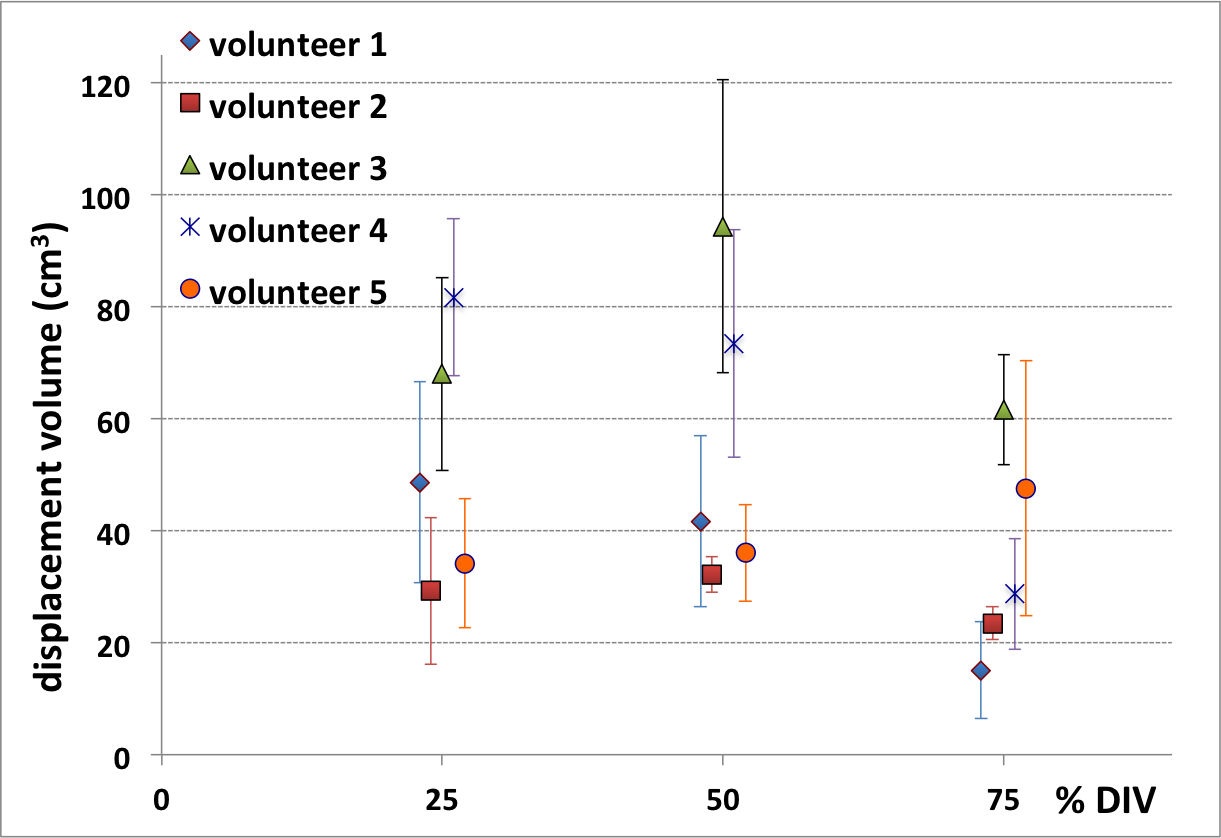
The average measured diaphragm volume displacements and their standard deviation over the three repeated measurements for each volunteer and inspiratory level are shown on Figure 2. Volunteers 1 and 4 exhibited smaller diaphragm displacements for an inhalational threshold of 75% DIV. The remaining subjects did not demonstrate a clear displacement distinction between breath-holding levels.
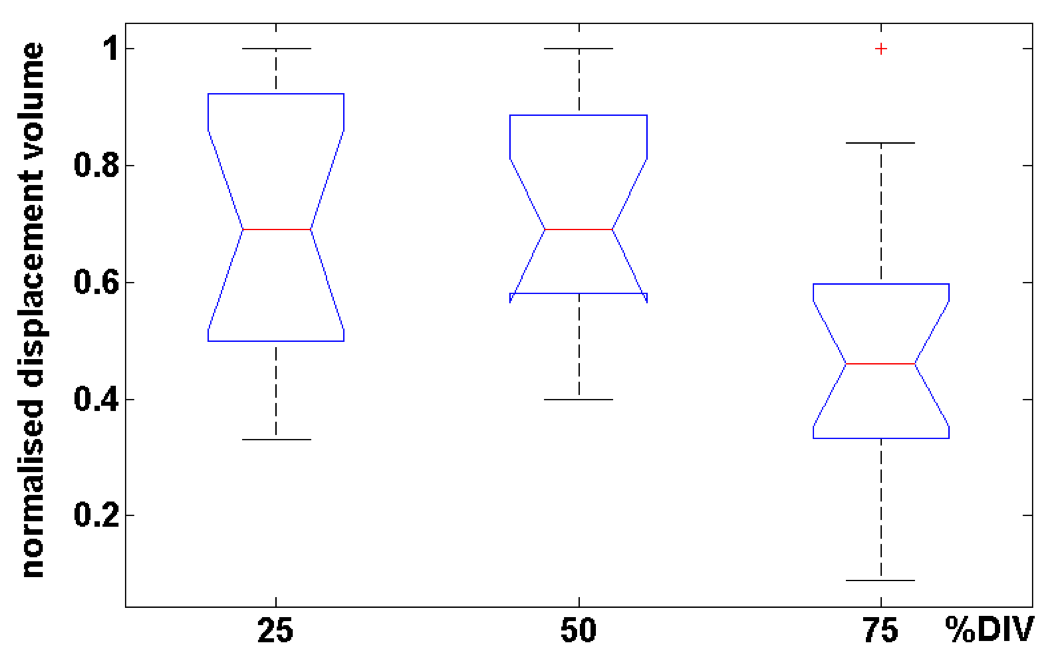
Figure 3 displays the normalised diaphragm displacement volumes for each inspiratory level over all volunteers by means of notch and whisker plots. A 1-way ANOVA at a significance level of 0.05 on the normalised displacement volumes found that the mean values of 75% DIV inhalational threshold were significantly lower (p=0.0069) than the means of the other two groups (50% and 25% DIV).
Discussion
The subjects demonstrated considerable diaphragm displacements during ABC-controlled breath-holding. Overall, their diaphragm moved upwards, especially towards the end of a breath-hold, presumably in an exhalation effort due to fatigue. The diaphragm motion range may have been exaggerated by the long breath-holds applied in this study. Statistical comparison of normalised diaphragm displacement volumes using 1-way ANOVA suggested that an inhalational threshold of 75% DIV yielded smaller diaphragm displacements than 50% or 25% DIV. This observation is reassuring for lung and breast radiotherapy applications typically employing ABC control at 75% DIV. During radiotherapy healthy tissue is spared by expanding the lungs and subsequently increasing the distance between organs at 75% DIV. Additionally, less diaphragm and subsequently adjacent tissue displacements appear during a breath-hold at this clinical standard than at lower inspiratory levels.Conclusion
Healthy volunteers displayed considerable diaphragm motion during ABC-controlled breath-holding. Motion was greater posteriorly, and at the end of breath-holds. The inhalational threshold of 75% individual DIV applied during radiotherapy yielded smaller diaphragm displacements than shallower inspiratory levels of 50% and 25% DIV.Acknowledgements
EPSRC grant EP/H046410/1;
CRUK and EPSRC support to the Cancer Imaging Centre at ICR and RMH in association with MRC and Department of Health C1060/A10334, C1060/A16464;
CRUK grant C46/A3970 to the ICR Section of Radiotherapy;
NHS funding to the NIHR Biomedical Research Centre and the Clinical Research Facility in Imaging. MOL is an NIHR Senior Investigator.
References
1. Brock J. et al. The use of the Active Breathing Coordinator throughout radical non-small-cell lung cancer (NSCLC) radiotherapy. Int. J. Radiation Oncology Biol. Phys. 2011; 81(2):369-75.
2. Holland AE et al. Diaphragmatic and cardiac motion during suspended breathing: preliminary experience and implications for breath-hold MR imaging. Radiology 1998; 209(2):483-9.
3. Kaza E. et al. First application of an Active Breathing Coordinator. Phys Med Biol. 2015; 60(4):1681-96.
4. Cover KS et al. Color intensity projections: a rapid approach for evaluating four-dimensional CT scans in treatment planning. Int J Radiat Oncol Biol Phys. 2006; 64(3):954-61.
Figures