2151
Density-adapted UTE for SF6 visualisation in small animal lung imaging1Core Facility Small Animal MRI, Ulm University, Ulm, Germany, 2Department of Diagnostic and Interventional Radiology, University Medical Center Ulm, Ulm, Germany, 3Institute of Radiology, University Hospital Erlangen, Erlangen, Germany, 4Internal Medicine II, University Hospital of Ulm, Ulm, Germany
Synopsis
Fluorinated gases as hexafluorane (SF6) may be used to visualize ventilations in lungs clinical and preclinical acquisitions. SF6 is characterized by T1 ~ T2* ~ 1 ms, therefore is best visualized with sequences allowing for short TR and TE, such as 3D UTE. SNR is generally limited by low spin density and low thermal polarization. In this work, we applied a density-adapted sampling scheme, previously developed for 23Na imaging, to the visualization of SF6 in phantom and in-vivo lung mice acquisitions. We verified that it increases image SNR and sharpness with respect to regular sampling without significant drawbacks.
Purpose
Fluorinated gases are emerging in the latest years as a possible alternative to hyperpolarised gases (HP) for ventilation imaging in clinical and preclinical application 1. One of the most investigated gases is hexaflourane (SF6). SF6 is characterized by T1 ~ T2* ~1 ms, therefore sequences as 3D Ultra Short Echo Time (UTE), allowing for short TE and TR, are ideal. SNR is limited, due to low spin density paired with the low thermal polarization, compared with HP gases. In this work, we applied the density-adapted (DA) sampling presented by Nagel et al² for SNR improvement in 23Na MRI, to 3D UTE imaging of SF6 at 11.7 T in phantom experiments and in in-vivo acquisition in free breathing-mice.Methods
All acquisitions were performed with an 11.7 T small animal system (BioSpec 117/16, Bruker, Ettlingen, Germany) using a 1H/19F Tx/Rx volume coil from the same vendor. A DA sampling was implemented for a 3D UTE sequence. The gradient shape was defined as :
$$ Grad{\tiny DA}(t) =\begin{cases} \frac{G\tiny DA}{t\tiny ramp}t & 0<t\leq t\tiny ramp \\G\tiny DA & {t\tiny{ramp}} <t \leq t\tiny lin \\k{\tiny DA}^{2}G{\tiny DA}(3\gamma k{\tiny DA}^{2}G{\tiny DA}(t- {t\tiny lin})+k{\tiny DA}^{3} )^{-\frac{2}{3}} & {t\tiny lin} < t\leq t \tiny acq \end{cases} $$
where GDA is the maximum gradient strength in DA UTE, tramp is the ramp time of the gradient , tlin defines the end of the constant part of the gradient, tacq is the acquisition length for a single spoke, $$$γ$$$ the gyromagnetic ratio divided by 2π, and k is the k-space radius, with kDA= k(tlin).
The gradients of the conventional UTE acquisition were trapezoidal with maximum gradient Gute defined as:
$$Grad{\tiny UTE} (t) =\begin{cases} \frac{G\tiny UTE}{t\tiny ramp}t & 0<t\leq t\tiny ramp \\G\tiny UTE & {t\tiny{ramp}} <t \leq t\tiny acq \\ \end{cases} $$
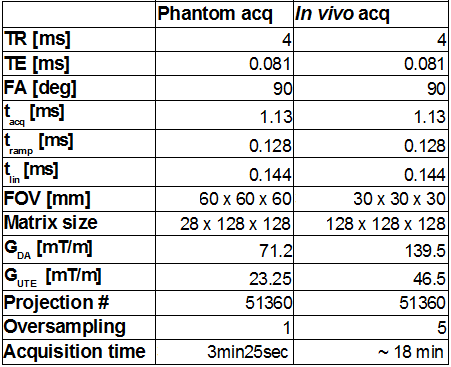
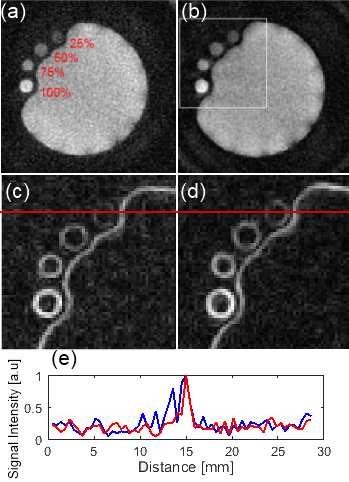
Acquisitions were performed on a phantom, composed of 4 small glass vials containing 25%, 50%, 75%, and 100% SF6 at 105 Pa and a plastic balloon filled with pure SF6 at the start of the acquisition. The acquisition parameters are listed in Table 1. In-vivo acquisitions were performed on 3 BalbC mice. Animals were anesthetized with an intraperitoneal injection of ketamin (2 mg/30 g) and xylazine (0.4 mg/30 g). Gas was delivered through a mask positioned outside the coil. Under air ventilation, a 1H 3D UTE scan was acquired for lung anatomy (TR = 4 ms, TE= 0.008 ms, FA= 3°, pixels 128x128x128, FOV 40x40x40 mm, acquisition time of 3min25s). The delivered gas was switched to a mixture of 80% SF6 and 20% O2. A 19F DA 3D UTE and a 19F 3D UTE scans were acquired. The acquisition parameters are listed in Table 1. Trajectory data was acquired afterward on a 1H phantom with the software tool made available from the vendor. All images were reconstructed with in-house developed software implemented in Matlab (The MathWorks, Natick, MA-US). In-vivo images were filtered with a 3x3x3 gaussian filter (σ = 2.8). A 2D Sobel operator was applied to axial and coronal slices to emphasize edges. SNR was calculated in phantom drawing Region of Interest (ROIs) inside (signal) and outside (noise) the balloon. For the in-vivo acquisition, ROIs were drawn in 3 coronal slices corresponding to the lung region (signal) and in correspondence of the liver (noise). A Rician correction was applied.
Results
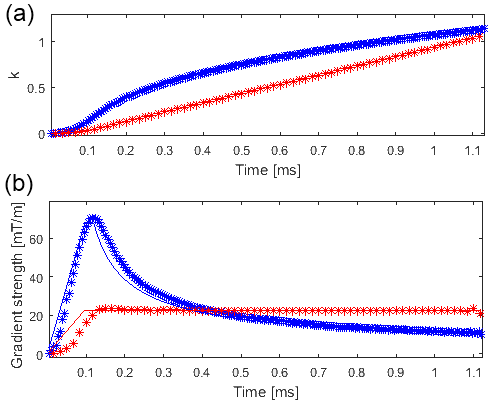
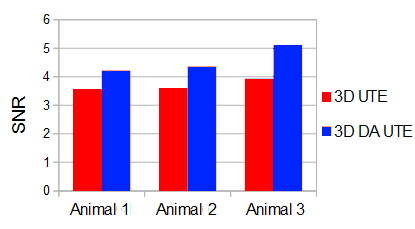
Figure 1 presents the acquired trajectories for 3D UTE and 3D DA UTE, and the comparison between the measured and theoretical gradients. Figure 2 presents the resulting image quality for the phantom acquisitions. A close-up of the edge-enhanced images and two profiles crossing the 25% SF6 vial is shown. 3D DA UTE is clearly less noisy with respect to 3D UTE and the vial containing 25% SF6 can be more clearly distinguished. The derived SNR is 30.58 for UTE and 37.21 for DA UTE, corresponding to a 21.6 % increase. Figure 3 presents the results of in-vivo acquisitions in coronal and axial slice orientation, the edge-enhanced images, and corresponding anatomical images. The lung edges are noticeable more uniform in 3D DA UTE. The resulting SNR values for all tested animals are presented in figure 4: the increase in SNR for DA UTE SNR is 18.6% for animal 1, 21.3% for animal 2, 29.9% for animal 3.Discussion
The gradients of 3D DA UTE are designed to keep the averaged sampling density in each spherical shell of k-space constant. Due to hardware restrictions, the inner sphere of k-space is sampled without density adaption. Since in 3D DA UTE the maximum gradient strength GDA is higher than the maximum gradient strength for 3D UTE Gute, the sampling density (number of acquired sample over Tacq) must be adequately increased to avoid undersampling the central part of k-space. We demonstrated a significant increase in SNR and image sharpness using DA 3D UTE for SF6 images at 11.7 T, both in phantom and in vivo applications, in line with expectations².Acknowledgements
No acknowledgement found.References
1 . Couch MJ, Ball IK, Li T, et al. Inert fluorinated gas MRI: a new pulmonary imaging modality. NMR in Biomed. 2014; 27(12): 1525–1534.
2. Nagel AM, Laun FB, Weber M, et al. Sodium MRI Using a Density-Adapted 3D Radial Acquisition Technique. Magnetic Resonance in Medicine. 2009;62:1565–1573
Figures