2150
Comparison of quantitative algorithms for calculating VDP from hyperpolarized 129Xe MRI – testing reproducibility of a biomarker of airway obstruction1Department of Medical Physics, University of Wisconsin-Madison, Madison, WI, United States, 2Department of Electrical and Computer Engineering, Duke University, NC, United States, 3Department of Biomedical Engineering, Duke University, NC, United States, 4Department of Medical Physics, Duke University, NC, United States, 5Department of Radiology, Duke University, NC, United States, 6Center for In Vivo Microscopy, Duke University, NC, United States, 7Department of Biomedical Engineering, University of Wisconsin-Madison, Madison, WI, United States, 8Department of Radiology, University of Wisconsin-Madison, Madison, WI, United States
Synopsis
There is a need to establish robust quantification pipelines to analyze 129Xe ventilation MRI for multi-center studies. Moreover, there is increasing interest in quantifying not only ventilation defect percent, but also regions of low and high ventilation. To this end, we sought to determine inter-method agreement between two different semi-automated quantitative mapping approaches — linear binning and adaptive K-means. The results suggest that once bias field corrections are applied consistently, both ventilation analysis methods agree well when classifying ventilation into 4 bins. Thus, with key steps outlined here, either method can be readily deployed in multi-center studies.
Purpose
There is a need to establish robust pipelines to quantify hyperpolarized (HP) 129Xe MRI for multi-center studies. Moreover, there is increasing interest in quantifying not only ventilation defect percent (VDP), but also regions of low and high ventilation. The aims of this study were to 1) compare linear binning1 and adaptive K-means2 for semi-automated calculation of VDP and other metrics measured from 129Xe MRI, and 2) establish a robust pipeline as a reference standard for future multi-center studies.Methods
Ten controls (25.7±3.4 years) and 19 asthma subjects (45.1±20.4 years) were enrolled in HIPAA-compliant studies with IRB approval. Imaging was performed on a 1.5T EXCITE 15M4 MR system (GE Healthcare) using HP 129Xe with a 2D multislice GRE sequence: 40cm FOV, 12.5mm slice, matrix=128x128, 7-10° flip, TR/TE=8.1/1.9ms.
Components of the quantification pipeline shared between both algorithms are summarized as follows: (1) registration of the proton to the 129Xe image, (2) joint segmentation of the proton and 129Xe images to obtain a binary mask that included both the thoracic cavity and trachea, (3) sorting of the 129Xe images by acquisition order as well as intensity correction using N4BiasCorrection3 using the binary mask, and (4) segmentation of the pulmonary vasculature using a vesselness filter4.
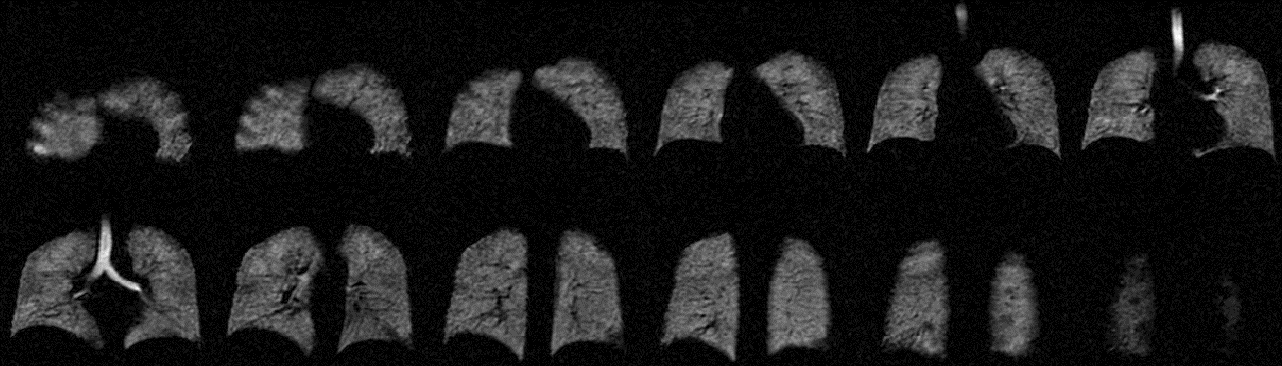
Although both pipelines used the same intensity corrected 129Xe and the same lung mask with vasculature removed, the gas image was either classified by linear binning1 or adaptive K-means2. Each independently determined VDP as well as 3 signal intensity levels above VDP defined to reflect internally referenced ventilation levels: low-, medium-, and high- ventilation percent (LVP, MVP and HVP) respectively. These additional 3 classes are being explored for their possible utility in further enhancing the clinical interpretation of 129Xe MRI. The signals from trachea were specifically retained and used for histogram scaling in linear binning, whereas they were excluded in adaptive K-means due to the possibility of extreme intensities influencing cluster assignment (Fig.1).
Bland-Altman plots were used to compare whole lung (global) agreement of the metrics, while Dice coefficients were used to measure their spatial agreement. The Wilcoxon rank-sum test was used to compare between control and asthma for global measures from each method independently.Results
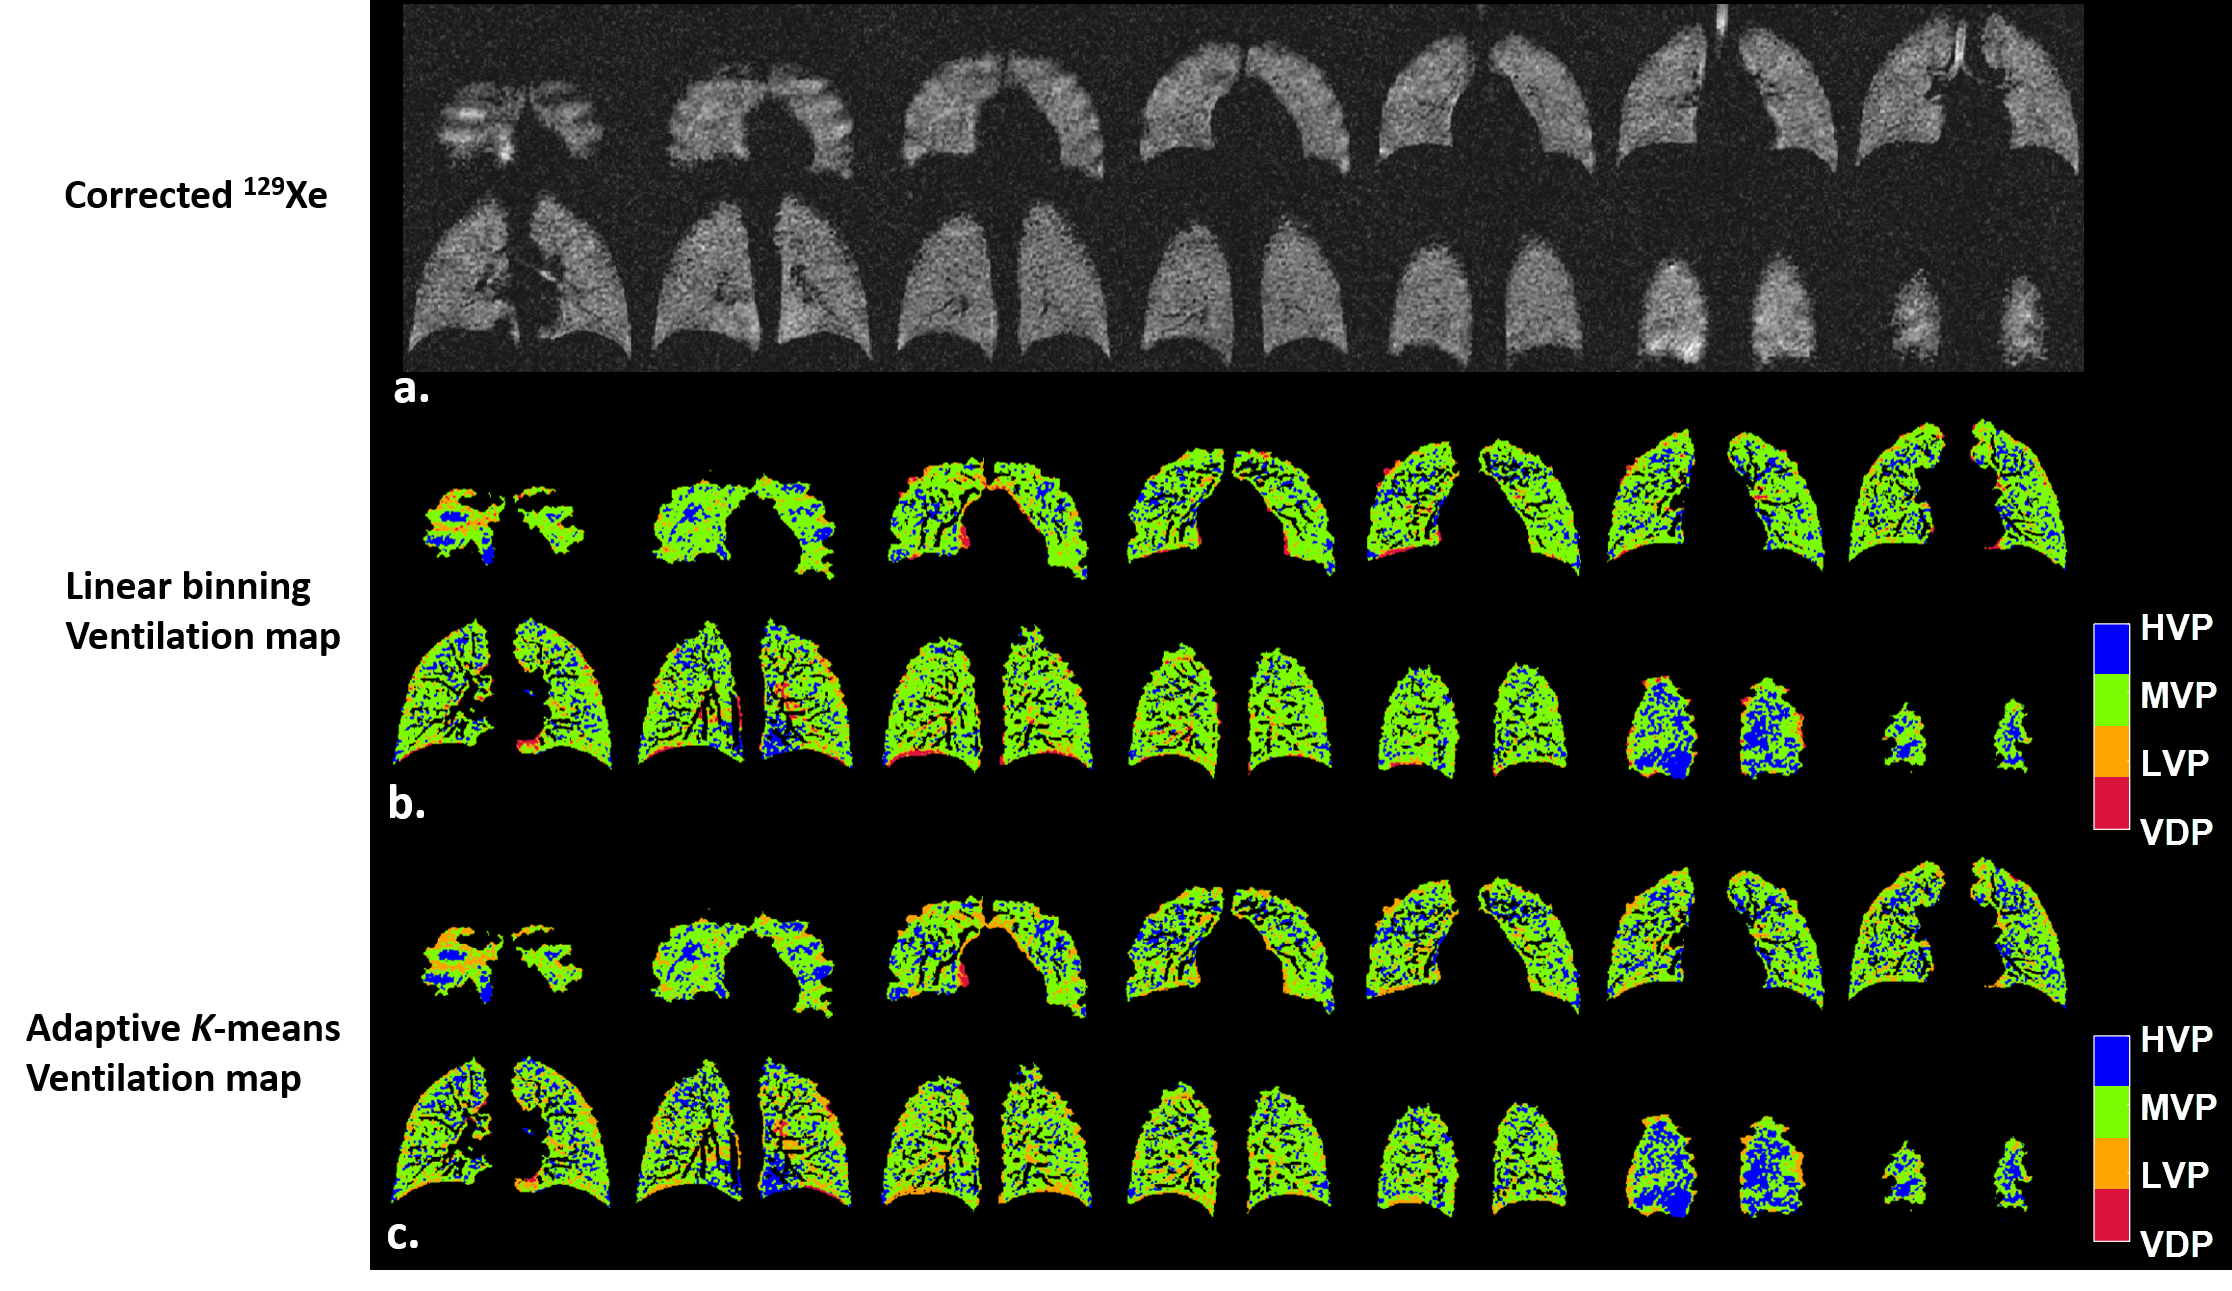
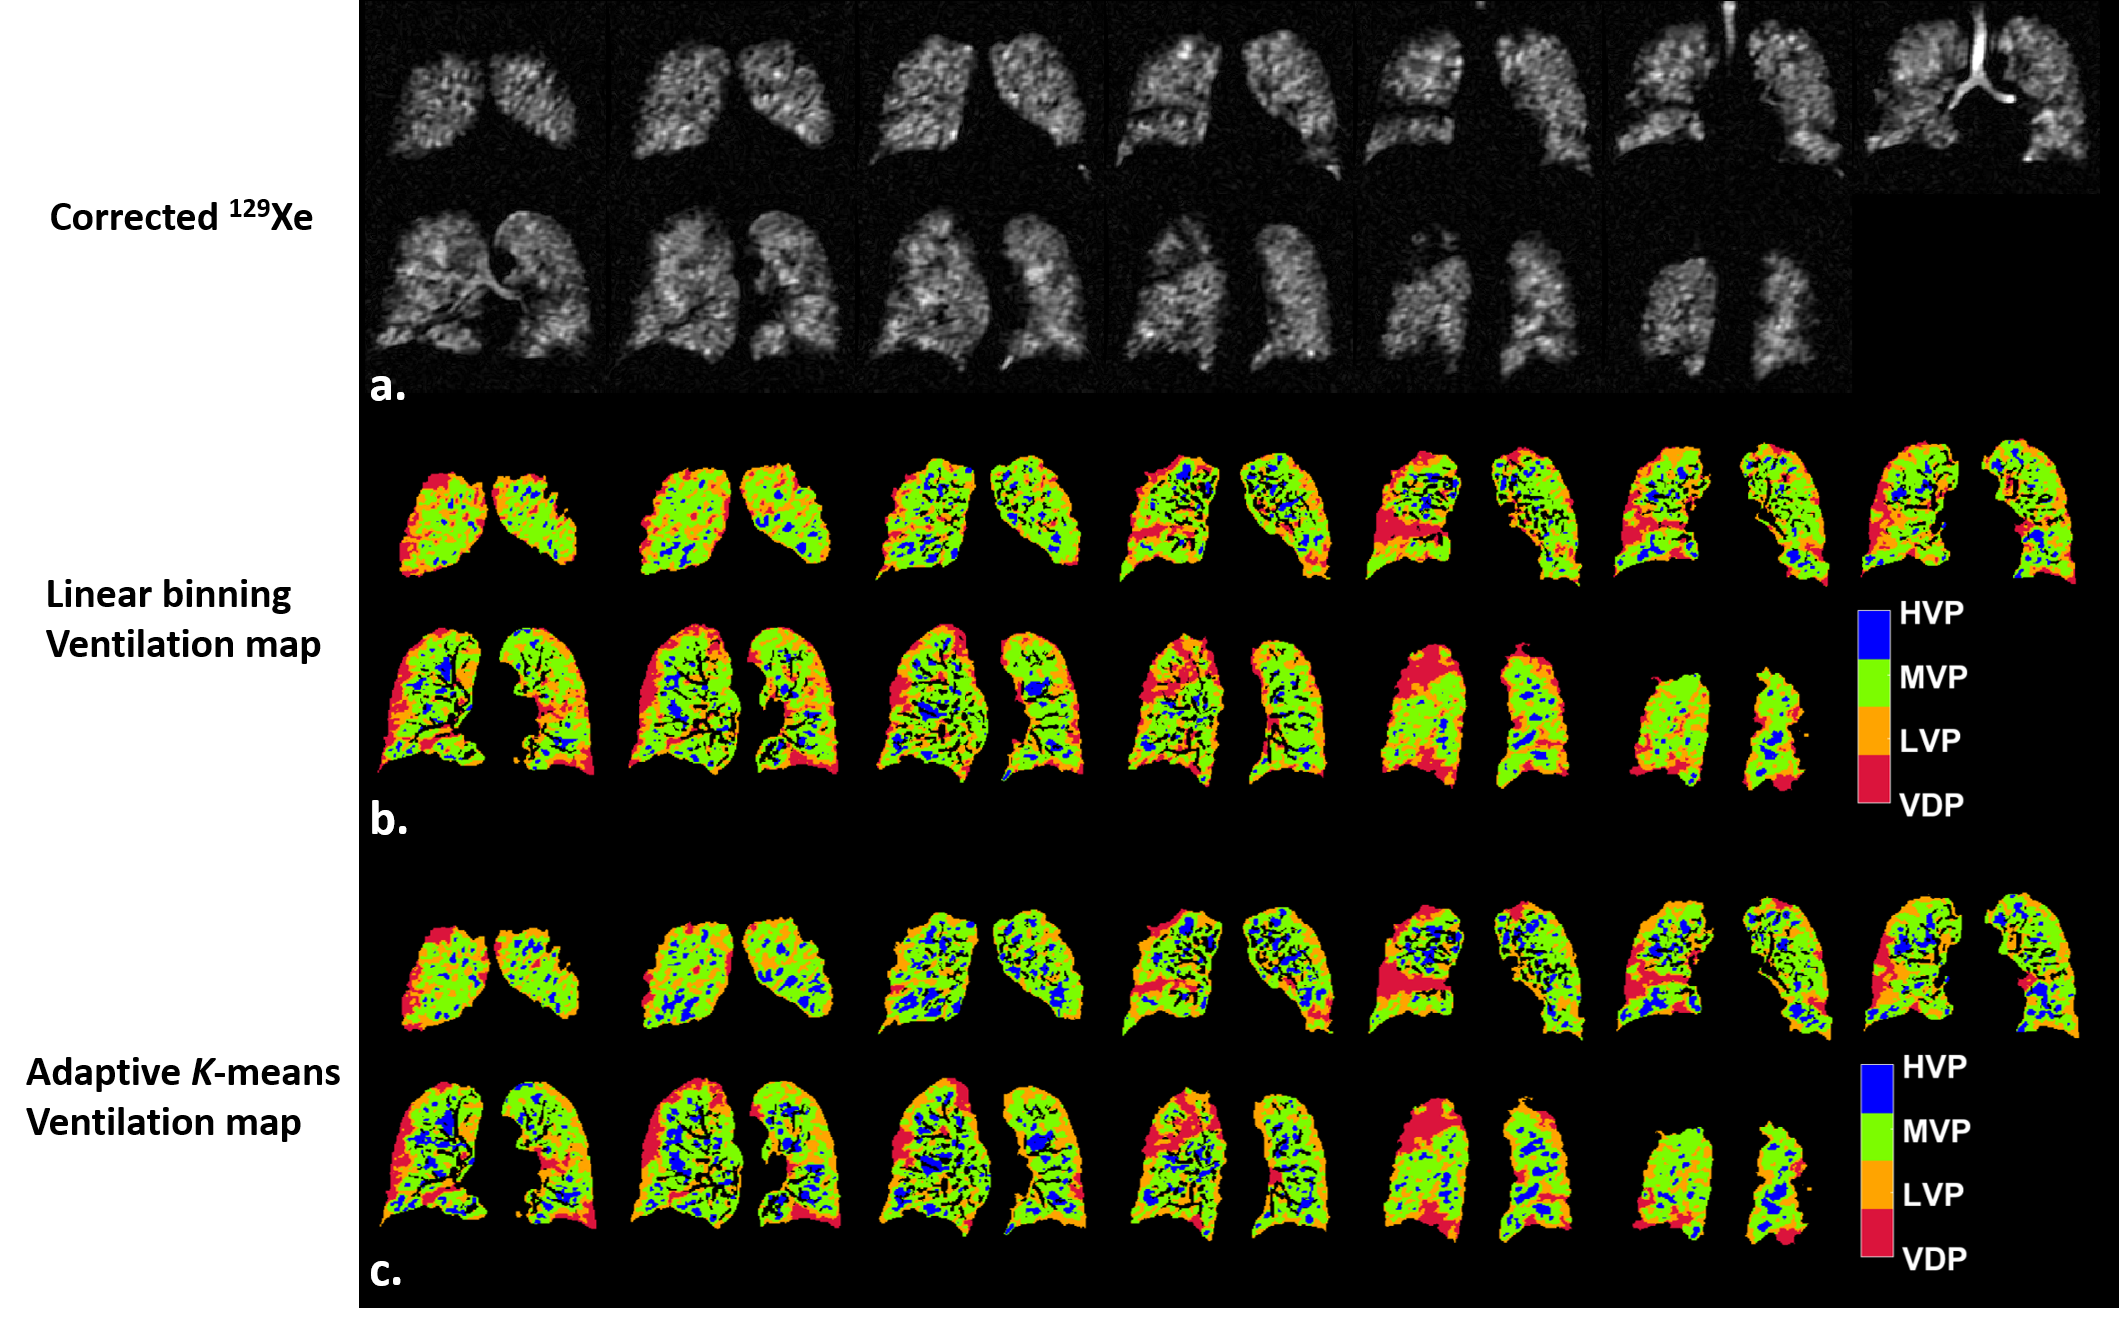
Typical examples of ventilation maps for linear binning and adaptive K-means are shown for a control subject with low SNR (Fig.2) and an asthmatic subject with high SNR (Fig.3). In both cases spatial agreement for each cluster was excellent. The primary difference was slightly expanded LVP and HVP derived from adaptive K-means vs. linear binning.
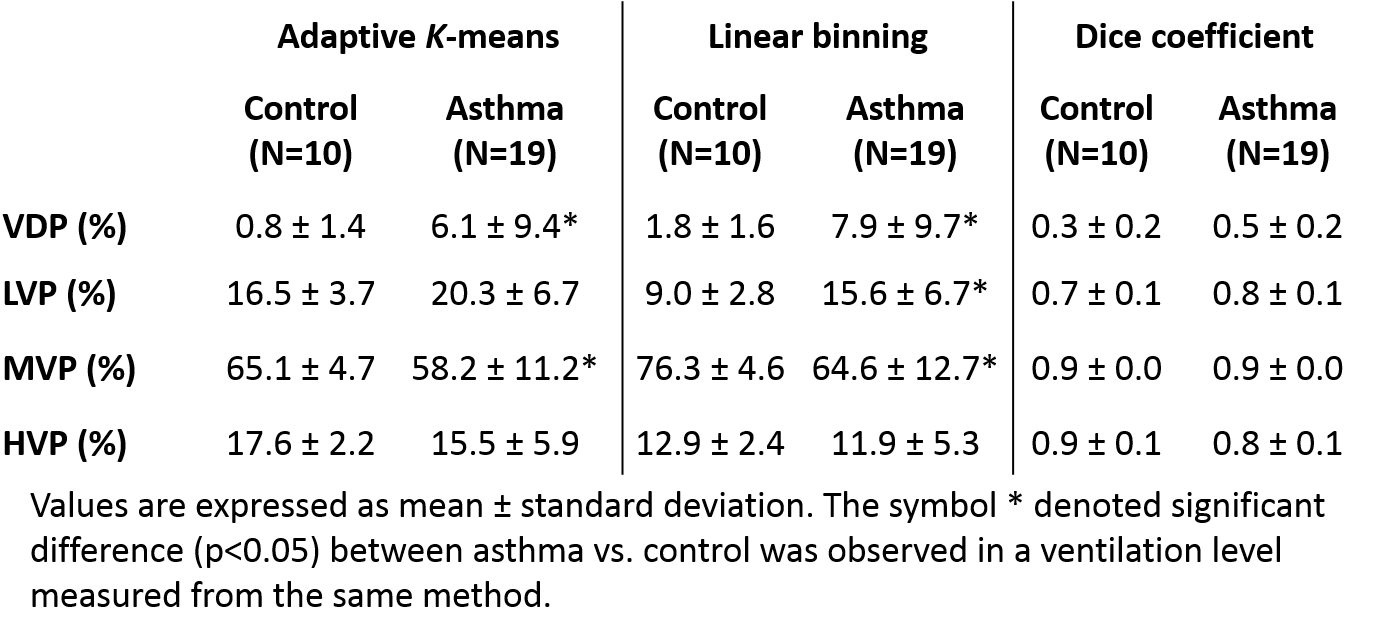
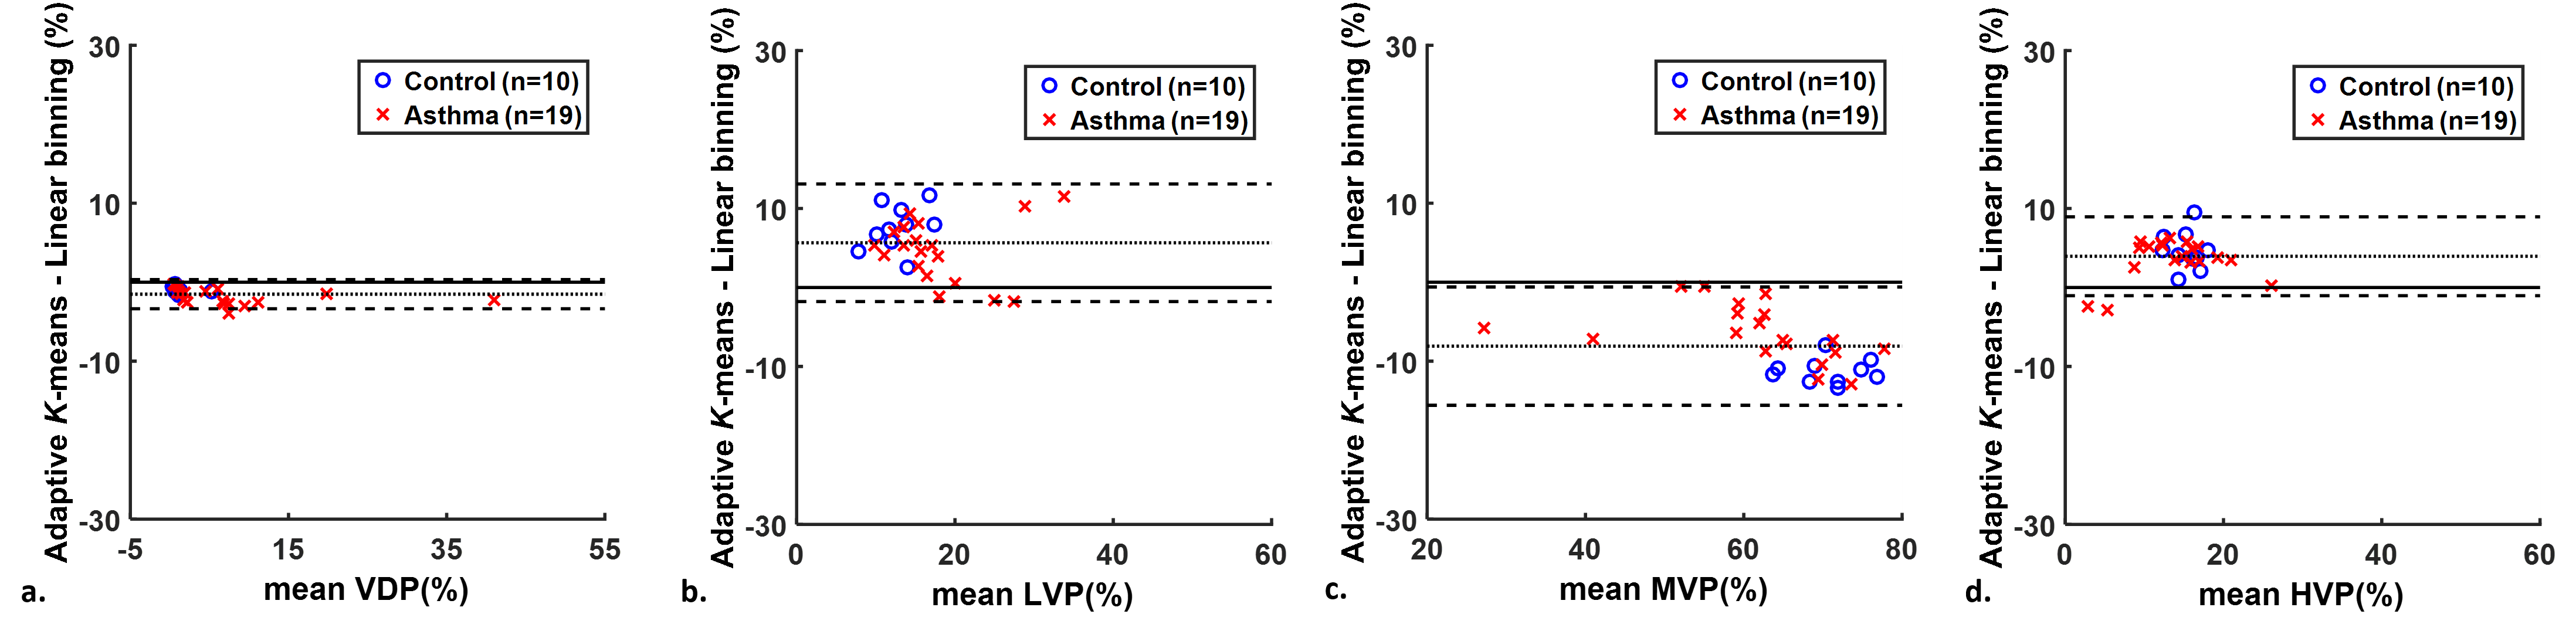
Quantitative comparison of asthma vs. control subjects was similar in both methods (Table 1). Both showed significantly greater VDP and lower MVP in asthma (p<0.04). However, linear binning found a significantly higher LVP (the ventilated cluster immediately above VDP) in asthma compared to an insignificant increase by adaptive K-means (Table 1). The overall Dice coefficients were 0.4, 0.7, 0.9 and 0.8 for VDP, LVP, MVP, and HVP respectively. Bland-Altman analysis found negligible bias between the linear binning vs. adaptive K-means for VDP (-1.5%), but moderate bias for LVP (5.7%), MVP (-8.1%), and HVP (4.0%) (Fig.4).
Discussion
While intensity correction is commonly used in the HP gas MRI community2,5,6, we found it was crucial to use the same parameter settings to achieve reliable inter-method agreement. Some methodological differences may explain the biases observed. The adaptive K-means employed a morphometric correction designed to remove signal noise and spurious classifications in the lung periphery due to partial volume effects. This led to a negligibly lower VDP but likely contributed to the relatively modest Dice coefficient, of 0.4. The inclusion or removal of tracheal signals between the two methods may also contribute to the differences noted in HVP and other ventilated clusters. For example, many isolated voxels contribute to the HVP in the control with poor SNR (Fig.2) mimicking the patchy regional ventilation heterogeneity for HVP that might be expected for an asthmatic with adequate SNR (Fig.3). Future work will further test the degree to which these two methods are robust to SNR variations with the goal of harmonizing the best features of each into a single algorithm. Such an algorithm can be validated using a digital phantom.Conclusion
Both linear binning and adaptive K-means differentiated asthma from the control group with respect to VDP and produced comparable distributions using 3 additional classes of relative ventilation with good global and spatial agreement from scans with varying SNR. By ensuring that intensity correction is harmonized, HP gas MRI and ventilation analysis performed at individual sites may be combined to establish disease-dependent findings in larger multi-center studies.Acknowledgements
A grant from GE Healthcare; R01 HL126771; R01HL105643; U01 HL109168.References
1. He M, Driehuys B, Que L, et al. Using Hyperpolarized 129Xe MRI to Quantify the Pulmonary Ventilation Distribution. Acad Radiol. 2016;S1076-6332(16):30181-30187.
2. Zha W, Niles DJ, Kruger SJ, et al. Semiautomated ventilation defect quantification in exercise-induced bronchoconstriction using hyperpolarized helium-3 magnetic resonance imaging: a repeatability study. Acad Radiol. 2016; 23(9):1104-14.
3. Tustison NJ, Avants BB, Cook PA, et al. N4ITK: Improved N3 bias correction. IEEE Trans Med Imaging. 2010;29(6):1310-1320.
4. Frangi AF, Member S, Niessen WJ, et al. Model-Based Quantitation of 3-D Magnetic Resonance Angiographic Images. IEEE Trans Med Imaging. 1999;18(10):946-956.
5. He M, Kaushik SS, Robertson SH, et al. Extending Semiautomatic Ventilation Defect Analysis for Hyperpolarized 129Xe Ventilation MRI. Acad Radiol. 2014;21(12):1530-1541.
6. Tustison NJ, Avants BB, Flors L, et al. Ventilation-based segmentation of the lungs using hyperpolarized (3)He MRI. J Magn Reson Imaging. 2011;34(4):831-841.
Figures