2147
3D UTE Cones for high resolution MR lung imaging and lung density visualisation1Nuclear Medicine, University Hospital Zurich, Zurich, Switzerland, 2Information Technology and Electrical Engineering, ETH, Zürich, Switzerland, 3GE Global Research, Munich, Germany, 4GE Healthcare, Waukesha, WI, United States
Synopsis
The primary objective of this study is to test 3D UTE Cones clinically for MR lung imaging. The purpose of the investigation is twofold. Primary goal is to test whether or not Cones can be used for high resolution lung anatomical imaging that might be useful for imaging vessels or pulmonary nodules. We test also the possibility for detecting and visualising the lung density that can also be used for imaging parenchyma diseases and more importantly can lead to more accurate extraction of lung attenuation maps for PET/MR attenuation correction.
PURPOSE
MR lung imaging is still challenging due to lung inherent low proton density, very short T2*, large susceptibility effects and respiratory motion that can introduce artefacts and degrade image quality. It has been shown that Ultra-short Echo Time (UTE) sequences can be used in order to capture lung density signal [1]. In contrast to CT, MRI uses no ionizing radiation and may be superior for certain clinical indications due to its higher contrast. The 3D UTE Cones [2] uses a non-cartesian trajectory which is a generalisation of the 3DPR trajectory in which the spokes twist around one of the axes, resulting in shorter required scan times and increased signal-to-noise ratio (SNR) efficiency. In this study, we investigate the potential use of 3D UTE Cones (Cones) for lung anatomical imaging as well as visualisation of lung parenchyma that could also be used for more accurate attenuation correction (AC) of the lung in hybrid PET/MR imaging compared to the methods currently implemented in commercial systems.
METHODS
The study was conducted on a GE Discovery MR750w 3T scanner (GE Healthcare, Waukesha, WI). The 3D Cones sequence was compared relative to 3D dual-echo GRE sequence (LAVA-Flex) currently used for lung PET/MR AC and 2D T2 weighted FSE fat-suppressed PROPELLER. Two healthy volunteers are scanned with Cones and one patient is scanned with all three sequences. In order to correct for the motion of the lung, the subjects wear a respiration belt near the diaphragm. For LAVA-Flex the parameters are: 15 sec breathhold acquisition, TR/TE/FA 4.4ms/2.6ms/12o, FOV 30*30*30 cm3, res/slice 2mm/4mm. For the PROPELLER the parameters are: 6 min prospectively gated acquisition, TR/TE 7058ms/120 ms, FOV 40x40x30cm3, res/slice 1.4 mm/4.5 mm. For Cones the protocol is: 3 min prospectively gated acquisition, TR/TE/FA 4.4ms/0.028ms/7o, FOV 30*30*24cm3, res/slice 1.4mm/4mm. A scan with isotropic 1.4 mm resolution is performed as well with a duration of 6 min and 30 secs.
RESULTS
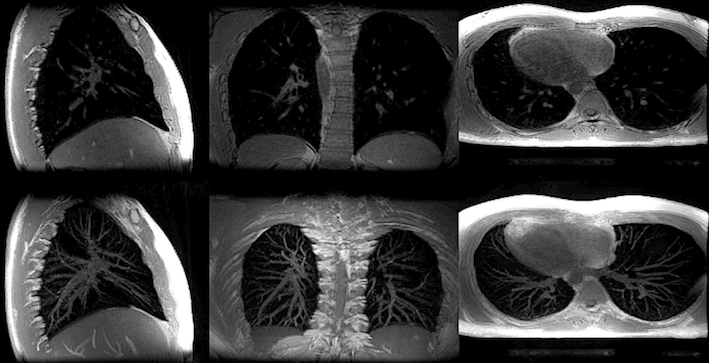
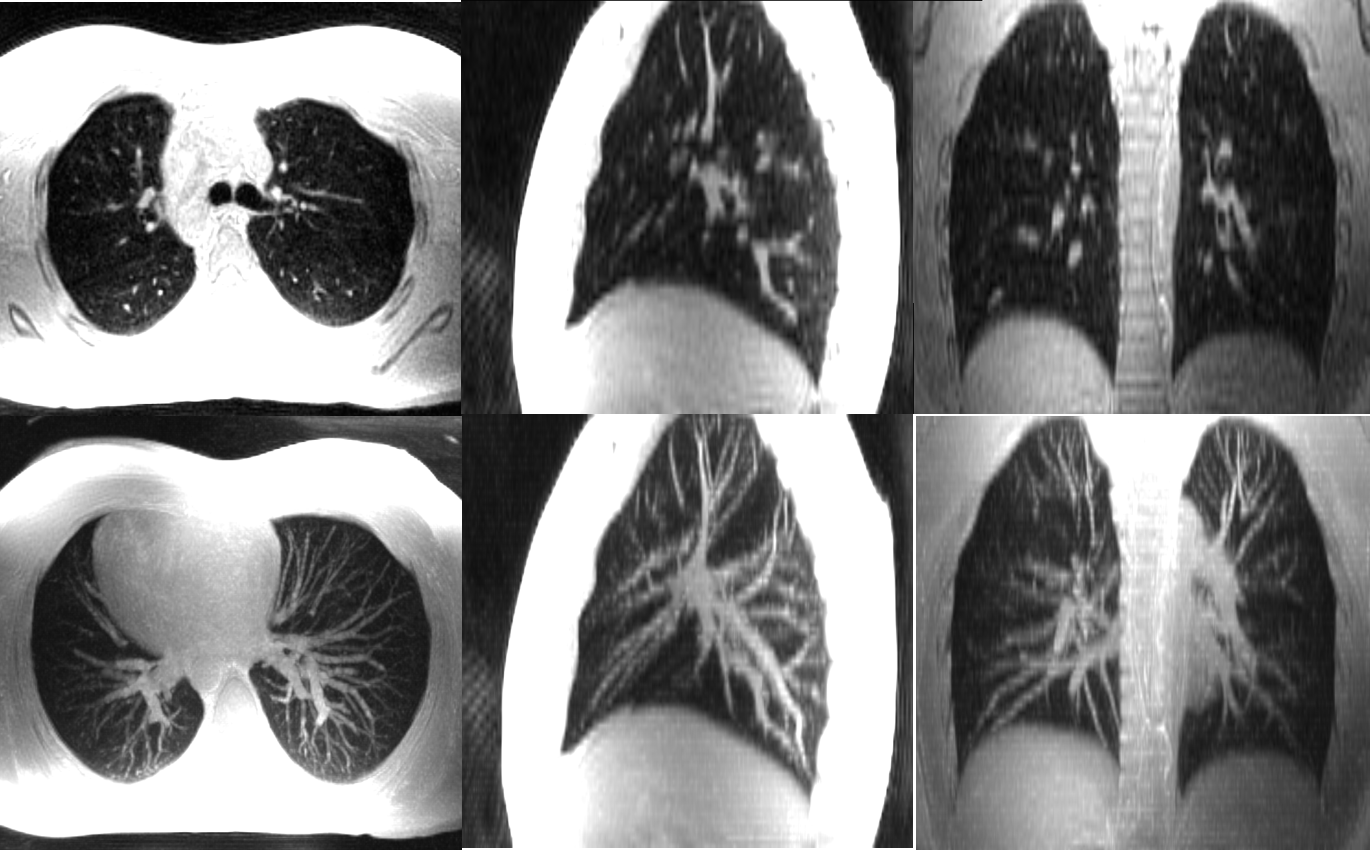
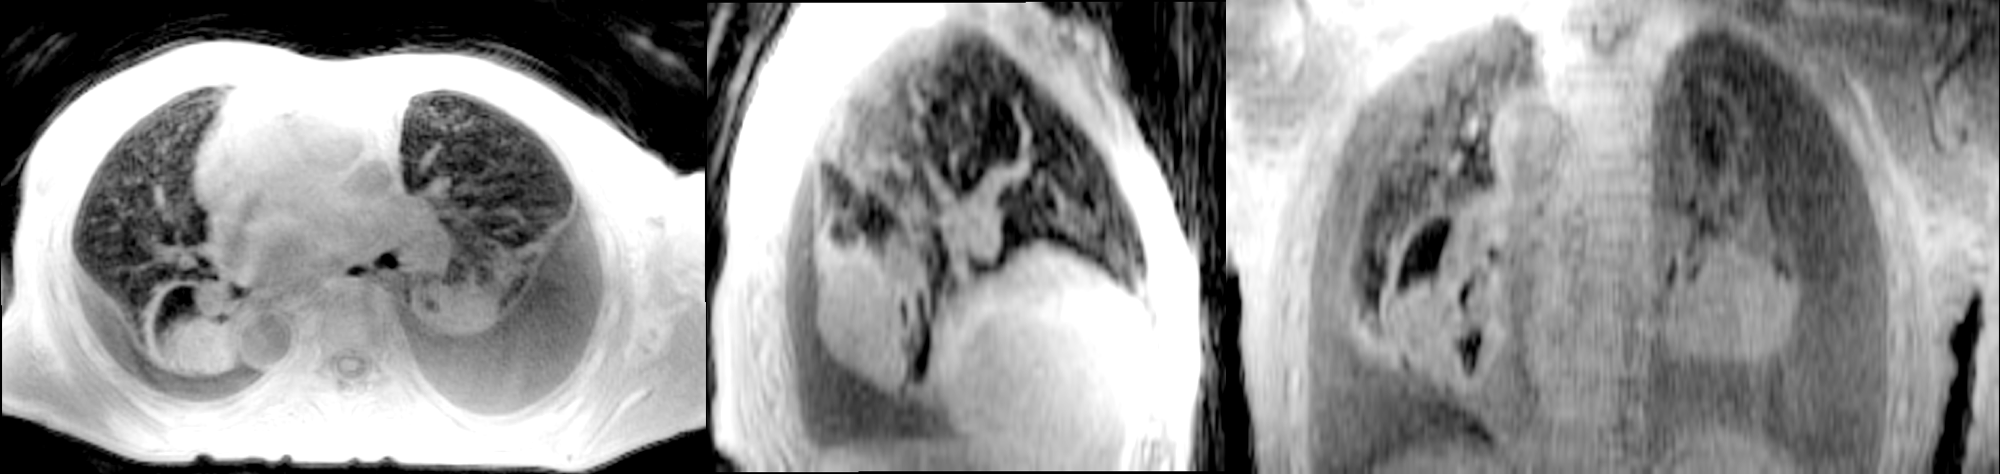
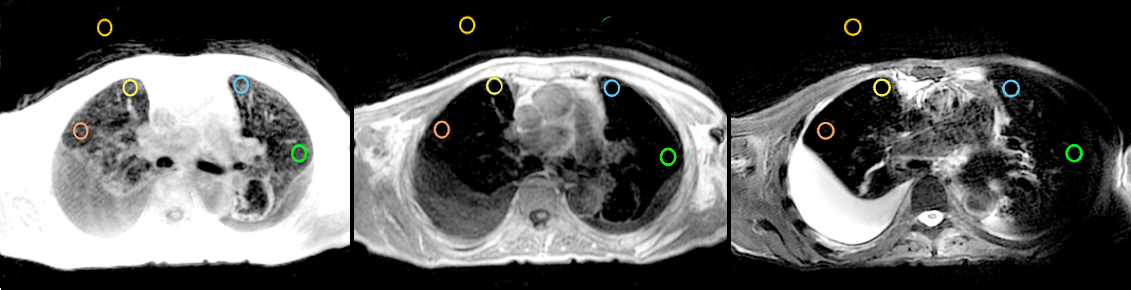
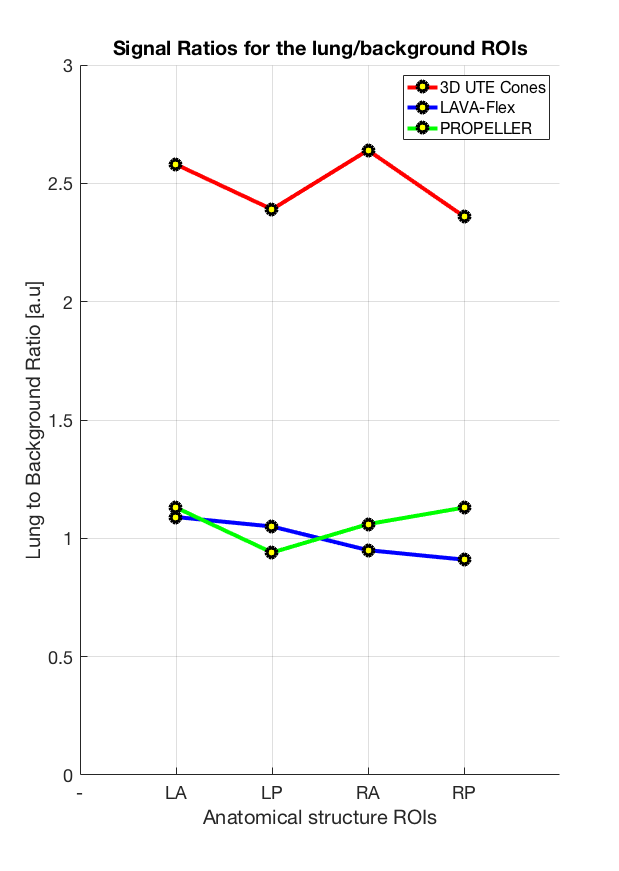
Fig. 1 depicts a montage of slices (upper images) and Maximum Intensity Projections (MIPs - lower images) of the isotropic resolution Cones scan of 1.4 mm, in all three tomographic planes (sagittal-coronal and axial). Fig. 2 shows another montage of the second Cones protocol with in plane resolution of 1.4 mm and 4 mm slice thickness (upper images) and MIPs (lower images). Fig. 3 shows a montage of slices in all three planes of a patient (with pleural effusion on both lungs) scanned with the second Cones protocol. Fig. 4 depicts a comparison of one axial slice of the patient scanned with Cones (left), LAVA-Flex (middle) and PROPELLER (right). As it is shown in Fig. 4, 2D ROIs (background-gold, left anterior (LA)-yellow, left posterior (LP)-orange, right anterior (RA)-blue and right posterior (RP)-green) were drawn towards the anterior and posterior healthy parts of both lungs and mean signals are measured. Then we calculate the lung to background signal ratio for all ROIs for all three scans. For the LA ROI, there is a 136% and 128% increased signal in the Cones compared to LAVA-Flex and PROPELLER respectively (127%/154%, 177%/149% and 159%/110% respectively for the LP, RA and RP ROIs). These results are summed up and depicted in Fig. 5.
DISCUSSION
What we can see in Fig. 1 is the air pathways of the bronchi in both lungs, especially on the coronal slice, while very good detailed vessel anatomy is depicted in the MIP images. The resolution is conserved even towards the boundaries of the lungs where the vessels become smaller and smaller. The lung motion is well compensated for, from the prospective triggering as the sharp diaphragm-lung boundary shows. Since the protocol uses an isotropic resolution, high structure definition is depicted along the sagittal and coronal planes as well. In Fig. 2 there is a very good anatomical detail on the axial MIP while in sagittal and coronal planes the resolution compared to Fig. 1 is decreased due to the thicker slice of 4mm. What is interesting, if we focus in the axial slice, is that there is apparently a differentiation between the signal coming from the primary bronchi (depicted as black) and the lung parenchyma which is slightly more bright especially towards the posterior part - which is expected because of the subject's supine position that presses the lung towards the bed, increasing the lung density. This scan took approximately half-time to be acquired compared to the scan depicted in Fig 1. This answers to our second question as to whether or not Cones is more sensitive in detecting lung density than LAVA-Flex (and PROPELLER). In Fig. 3, which is a patient scan, Cones seems to capture parenchyma signal which is significantly higher than the background signal in all three planes. In this case the healthy part of the lung is compressed towards the anterior part, so lung density is regionally increased. The Cones scan appears sharper than LAVA-Flex and PROPELLER while the compressed lung is better seen in Cones. Furthermore, the bronchi/walls of the airways are better depicted and lung parenchyma infiltration – even subtle one – is better in Cones as well (Fig 4). In order to compare the efficiency of detecting lung density, a basic quantitation from calculating the lung to background signal ratio for all ROIs is evaluated and the results are illustrated in the Fig.5. These quantified results suggest that the higher signal in Cones is due to lung density detection and could be used for more accurate AC of the lung for PET/MR in comparison to current protocols that use tissue segmentation and assign a homogeneous attenuation coefficient value for the whole lung.
CONCLUSION
In this study we wanted to test clinically the feasibility of Cones for high resolution lung anatomical imaging and for lung parenchyma visualisation as well. Preliminary results show that Cones captures more lung signal than LAVA-Flex (and PROPELLER) and could be used for lung parenchyma density visualisation. Further clinical studies are needed with more patients to reach a statistical significance to confirm that Cones could outperform LAVA-Flex for PET AC. High resolution Cones could be the MRI tool that can be used in the clinical environment to characterise solitary pulmonary nodules, differentiate lung cancer from secondary changes, estimate mediastinal invasion, detect chest wall invasion, assess mediastinal lymph nodes and diagnose distant metastasis [3].
Acknowledgements
No acknowledgement found.References
[1] Togao O, Tsuji R, Ohno Y, et. al. Ultrashort echo time (UTE) MRI of the lung: assessment of tissue density in the lung parenchyma. Magn Reson Med. 2010 Nov; 64(5):1491-8
[2] Gurney P, Hargreaves B, Nishimura D, Design and analysis of a practical 3D Cones trajectory, Magn Reson Med. 2006; 55:575–582
[3] Hochhegger B, Marchiori E, Sedlaczek O, et. al. MRI in lung cancer: a pictorial essay. Br J Radiol. 2011 Jul; 84(1003): 661–668
Figures