2145
Assessment of lung inflation state on the repeatability of hyperpolarized gas ventilation MRIPaul John Clifford Hughes1, Laurie Smith1,2, Felix C. Horn1, Alberto Biancardi1, Neil J. Stewart1, Graham Norquay1, Guilhem J. Collier1, and Jim Wild1,3
1POLARIS, Academic Unit of Radiology, University of Sheffield, Sheffield, United Kingdom, 2Sheffield Childrens Hospital, Sheffield, United Kingdom, 3Insigneo Institute for in silico Medicine, Sheffield, United Kingdom
Synopsis
Repeatability of inflation levels, and the imaging metrics derived from them, is important in hyperpolarized gas MRI, particularly when attempting to measure a response from interventions. This work presents same-session repeatability of 5 different inflation levels and their accuracy in comparison to plethysmography measures. Further the effect of inflation level on percent ventilated lung volume and coefficient of variation was investigated. The most repeatable lung volumes were total lung capacity, functional residual capacity plus 1 liter and residual volume. Percent ventilated lung volume was repeatable to within a maximum of 2% error.
Background
The reproducibility of lung inflation level is an important factor when comparing ventilation imaging data acquired on multiple occasions or assessing the response to an intervention. Quantitative metrics of lung ventilation can be computed from same breath hyperpolarized (HP) gas and 1H lung MRI, such as the percentage ventilated volume (%VV), defined as the ratio of ventilated volume to total lung volume1 multiplied by 100. Indices of ventilation heterogeneity may also be calculated from ventilation images e.g. local coefficient of variation of signal intensity (defined as the standard deviation divided by the mean) (CV)2.Purpose
The aims of this study were: (i) to test same session repeatability of different lung inflation levels and how they affect quantitative measurements of lung ventilation imaging and (ii) assess which inflation level best matches body plethysmography in terms of repeatability.Methods
3 healthy volunteers (each volunteer scanned twice) were assessed using same-breath hyperpolarized 3He MRI and 1H MRI at 1.5T3 (GE HDx, Milwaukee, WI). 3He ventilation images were acquired using a 3D balanced steady state free precession sequence with a reconstructed voxel size 1.8x1.8x5mm. 1H images were acquired using the system body coil and a 3D spoiled gradient echo sequence with the same resolution. HP 3He dose ranged from 150-200ml depending on the inflation level and was topped up to 1 liter with nitrogen. Images were acquired at five lung volumes: functional residual capacity (FRC), FRC plus 1L (FRC+1), total lung capacity (TLC), residual volume (RV) and RV plus 1L (RV+1). All breathing maneuvers started with the inhalation of the 1L bag from FRC except for the RV+1 image where the inhalation started after first exhaling to RV. A qualified respiratory physiologist gave breathing instructions. Images were acquired in the order presented in Table 1 with ten minutes rest between acquisitions. Body plethysmography was performed to international standards4 following all MR acquisitions. Images were segmented as previously described5. Differences in total lung volume (TLV) between scan sessions (assessed from segmentation of the lung cavity from 1H MRI images), and between scan sessions and plethysmography measurements were calculated along with the difference in %VV, ventilated volume (VV) and median CV% (median of the CV map multiplied by 100) between sessions.Results and Discussion
Table 1 shows the results of imaging metrics (TLV, VV, %VV and CV%) and their same-session repeatability. Considering all 3 volunteers, the most repeatable inflation levels appear to be FRC+1, RV and TLC. However HV2 and HV3 have less than 10% variability between scans indicating high repeatability in all inflation levels for these participants. Additionally, ventilation images were found to be more heterogeneous at RV+1 than for the other inflation states with the appearance of ventilation defects in the dependent part of the lung (Figure 1). This may be the result of airway closure that occurs at very low lung volumes6. The increased heterogeneity was observed only at RV+1 but not at RV since the inhalation was performed originally from FRC in the latter case giving the gas some time to redistribute with exhalation. %VV was highly reproducible at all inflation levels with less than 1% error in most cases. Comparing the imaging lung volumes to those from body plethysmography showed that TLC (<10% ∆ for all participants) was the most consistent between the 2 different modalities. However it should be noted that the volume derived from imaging includes partial volume of lung parenchyma and small pulmonary blood vessels whereas plethysmography is a direct measurement of the gas volume in the airspaces only, therefore some discrepancy is expected.Conclusions
This study in healthy volunteers has shown that the most repeatable volumes for lung ventilation imaging are FRC+1, TLC or RV. The protocol for the RV inflation level is considered too difficult to implement in clinical settings, as the 15-second breath-hold can be physically challenging. By acquiring images at different inflation levels it may be possible to better describe physiology and pulmonary function using HP gas MRI. Furthermore despite differences in imaging volumes between sessions the measurement of the ratio %VV is extremely reproducible. Finally it was shown that the volumes obtained from MRI measurements at TLC and FRC+1 are the most similar to the values obtained from plethysmography.Acknowledgements
NIHR, MRC and GlaxoSmithKline for fundingReferences
[1] Woodhouse et al. J MAGN RESON IMAGING, 2005, 21(4), 365-369; [2] Smith et al. ERS congress 2016, London [abstract]; [3] Horn et al NMR BIOMED, DOI:10.1002/nbm.3187; [4] Wanger et al EUR RESPIR J 2005, 26, 511–522; [5] Hughes et al PROC INTL SOC MAG RESON MED 24(2016), 1622; [6] West, Respiratory physiology the essentials 8th edition, 2012Figures
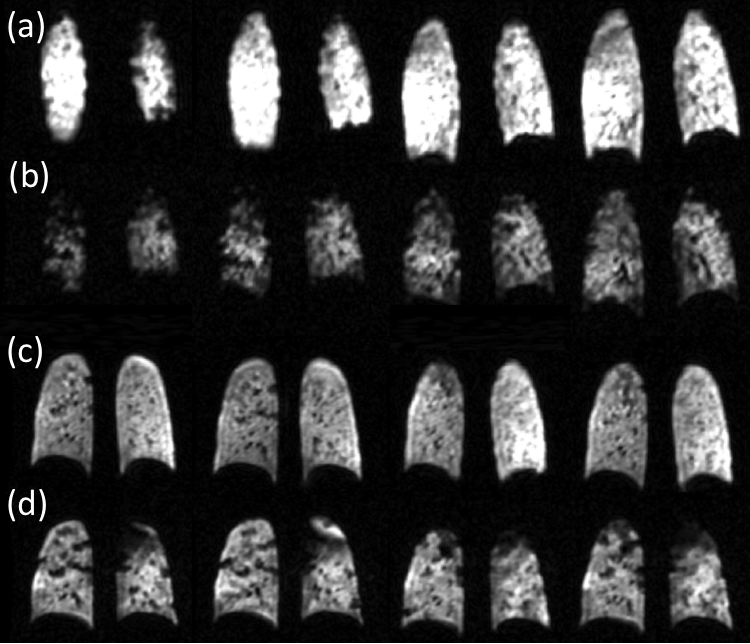
Figure 1. Difference between FRC+1
and RV+1 on posterior slices. (a) HV1 HP 3He image acquired at FRC+1,
(b) HV1 HP 3He image acquired at RV+1, (c) HV2 HP 3He
image acquired at FRC+1 and (d) HV2 HP 3He image acquired at RV+1.
Note the increased heterogeneity and in HV2 the large difference in left upper
lobe ventilation.
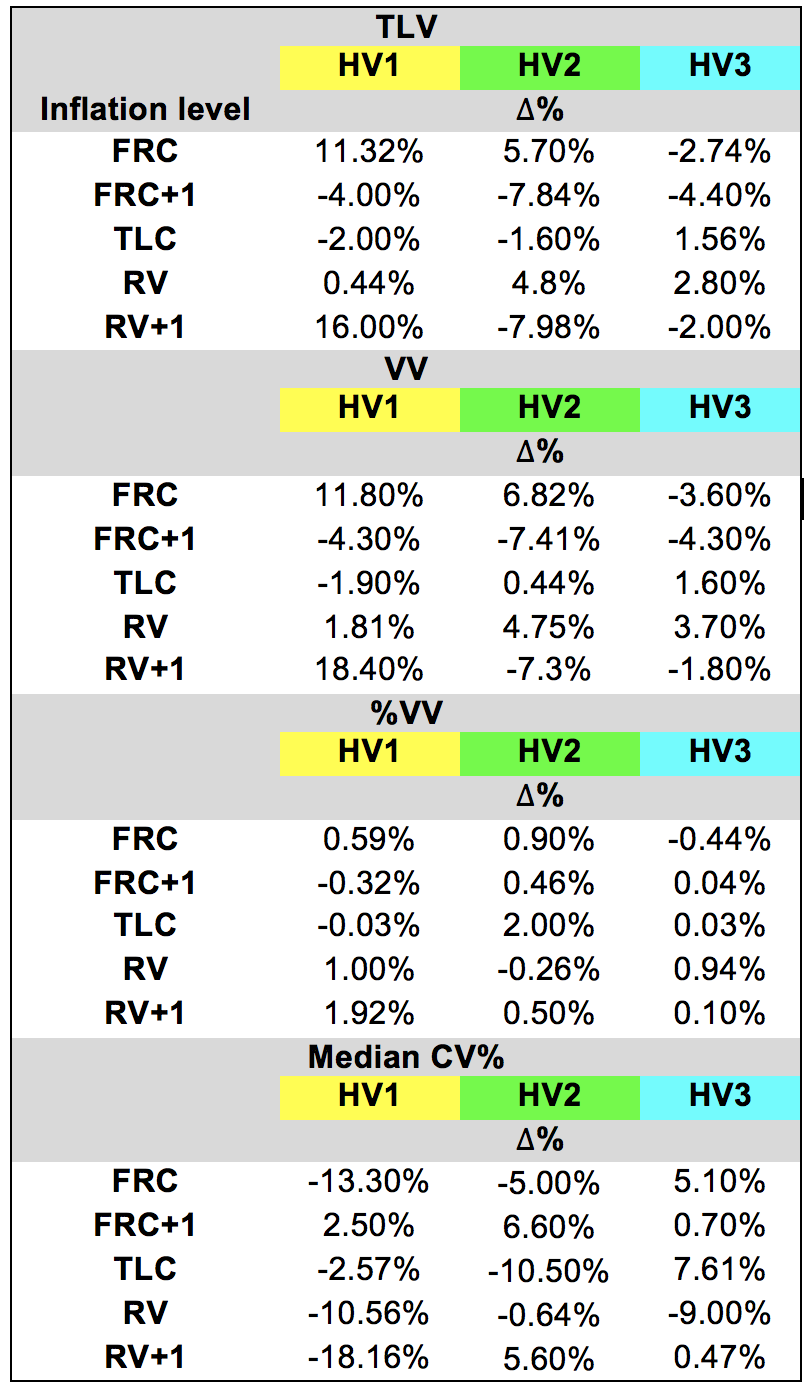
Table 1.
Comparison of the repeatability of TLV, VV, %VV and CV% from three healthy
volunteers