2141
Double tracer gas single breath washout (SBW) lung imaging with hyperpolarized Xe-129 and He-31Academic Radiology, University of Sheffield, Sheffield, United Kingdom, 2Insigneo Institute, University of Sheffield, Sheffield, United Kingdom
Synopsis
Single breath washout (SBW) is an emerging pulmonary function test due to its relative simplicity and speed. Most significant outcome parameter, phase III ‘alveolar’ slope (tracer gas decay during mid-exhalation) is sensitive to ventilation heterogeneity. In this work, a method is presented for SBW-imaging with two tracer gases with inherently different physical properties: hyperpolarized 129Xe and 3He. Findings in our study are in agreement with trends seen in SBW from pulmonary function lab: the heavier, less diffusive gas (129Xe) has a steeper phase III slope. This indicates increased regional ventilation heterogeneity due to a lesser degree of diffusional mixing.
Purpose
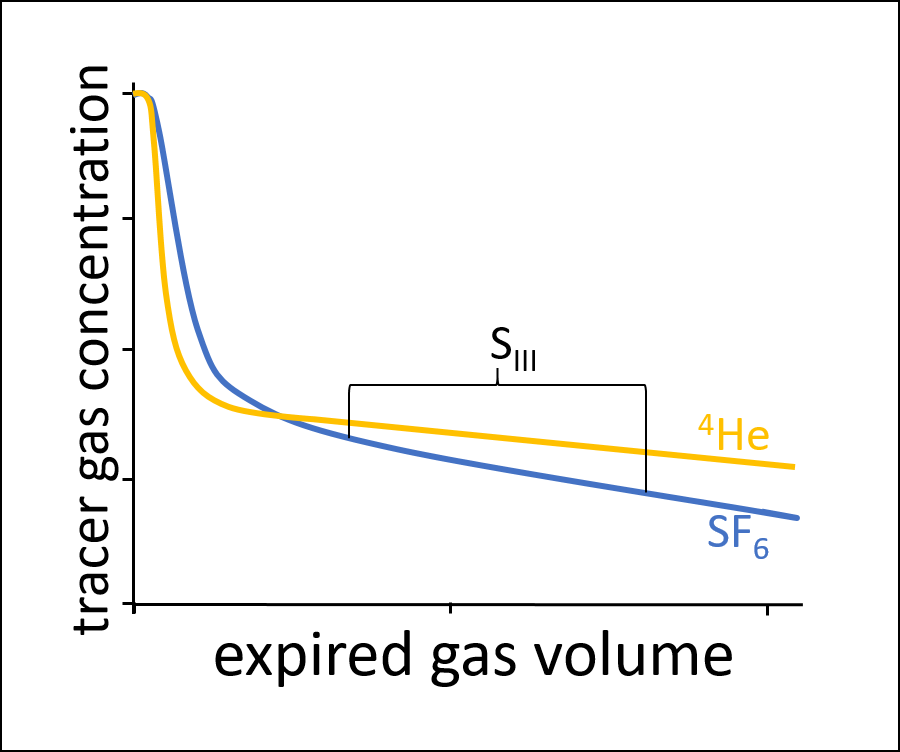
Single and multiple breath washout (SBW and MBW) are pulmonary function tests sensitive to ventilation heterogeneity1. MBW-imaging has been demonstrated for regional assessment of ventilation heterogeneity using hyperpolarized gas MRI2, however SBW has great potential due to its relative simplicity and speed. Furthermore, devices capable of double tracer gas SBW are now commercially available3, and this technique is emerging as a sensitive tool to probe peripheral gas mixing efficiency (see Figure 1). In this work, a method is presented for SBW-imaging with two tracer gases: hyperpolarized 129Xe and 3He MRI. This provides a regional insight into the expiratory washout mechanisms of two tracer gases with inherently different physical properties.Methods
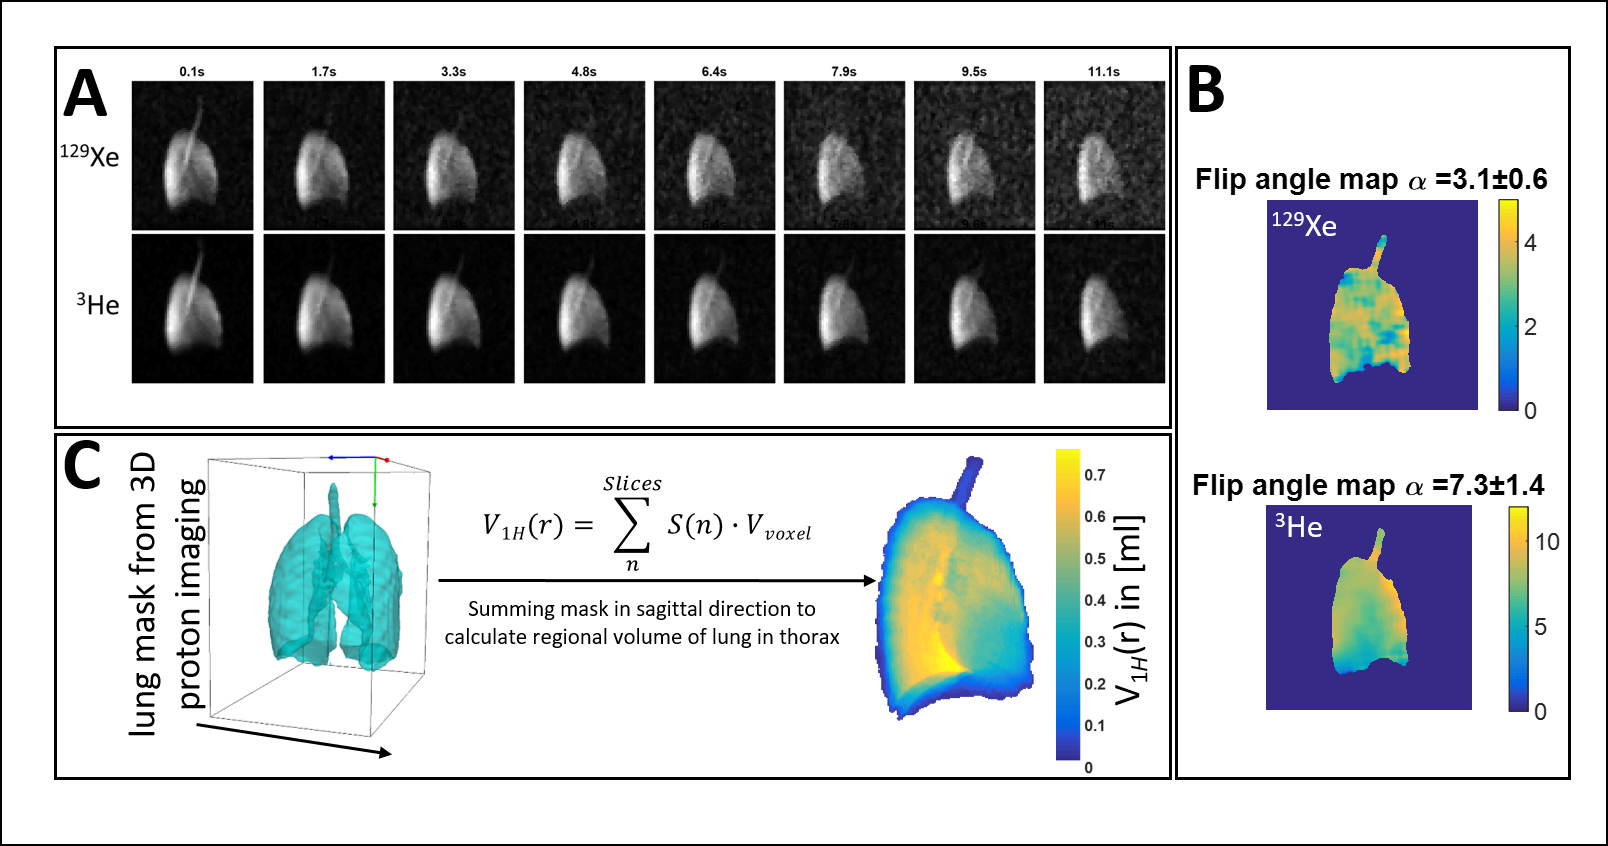
4 healthy volunteers (26-35 years, FEV1 z-score>-1.63) underwent SBW-imaging using time-resolved spoiled gradient echo (SPGR) sequences on a 1.5T scanner. Flexible transmit-receive quadrature RF coils tuned to the respective frequencies (48.62MHz for 3He and 17.65MHz for 129Xe) were used in experiments. Sequence parameters for 2D time-resolved SPGR sequences were: 64x64 matrix; single slice with thickness = 300mm; FOV= 45cm; phase FOV = 0.81. A total of 60 images were acquired with no delay between acquisitions. For 3He, the following parameters were used: TR/TE = 2.7/0.8ms, receiver bandwidth=62.5kHz, flip angle = 1°, resulting in a temporal resolution of 0.14s. For 129Xe, parameters were as follows: TR/TE = 5/1.3ms, receiver bandwidth=32kHz and a flip angle = 1°, resulting in a temporal resolution of 0.26s. A gas mixture containing 150ml 3He (~25% polarization, DHe-air~0.88cm2/s) or 500-700ml enriched-129Xe (~25% polarization,DXe-air~0.11cm2/s), each topped up to 1l with N2, was used. Subjects were instructed to exhale to functional residual capacity before inhaling the gas mixture, as per the conventional SBW lung function test. The gas mixture in the lungs was then exhaled after image acquisition was initiated. Subjects aimed to achieve a constant flow of 400ml/s, whilst breathing through a restricted flow meter (RS 100 Pneumotachograph, Hans Rudolph, Shawnee, KS, USA). Figure 2A shows typical results from SBW-imaging acquisitions. Flow recordings were aligned with MR images using the MR signal from a ROI placed in the trachea. Regional signal decay was corrected for RF depolarization using flip angle maps(Figure 2B). 3D proton MRI was performed and segmented to calculate the regional lung volume ($$$V_{^{1}H}(r)$$$). MR images were registered and normalized for signal intensity using a method similar to Tzeng4:
$$S_{n}(r,t) = \frac{S(r,t)\cdot\frac{V_{tracer}}{\sum_r S(r,1)}}{V_{^{1}H}(r)}$$
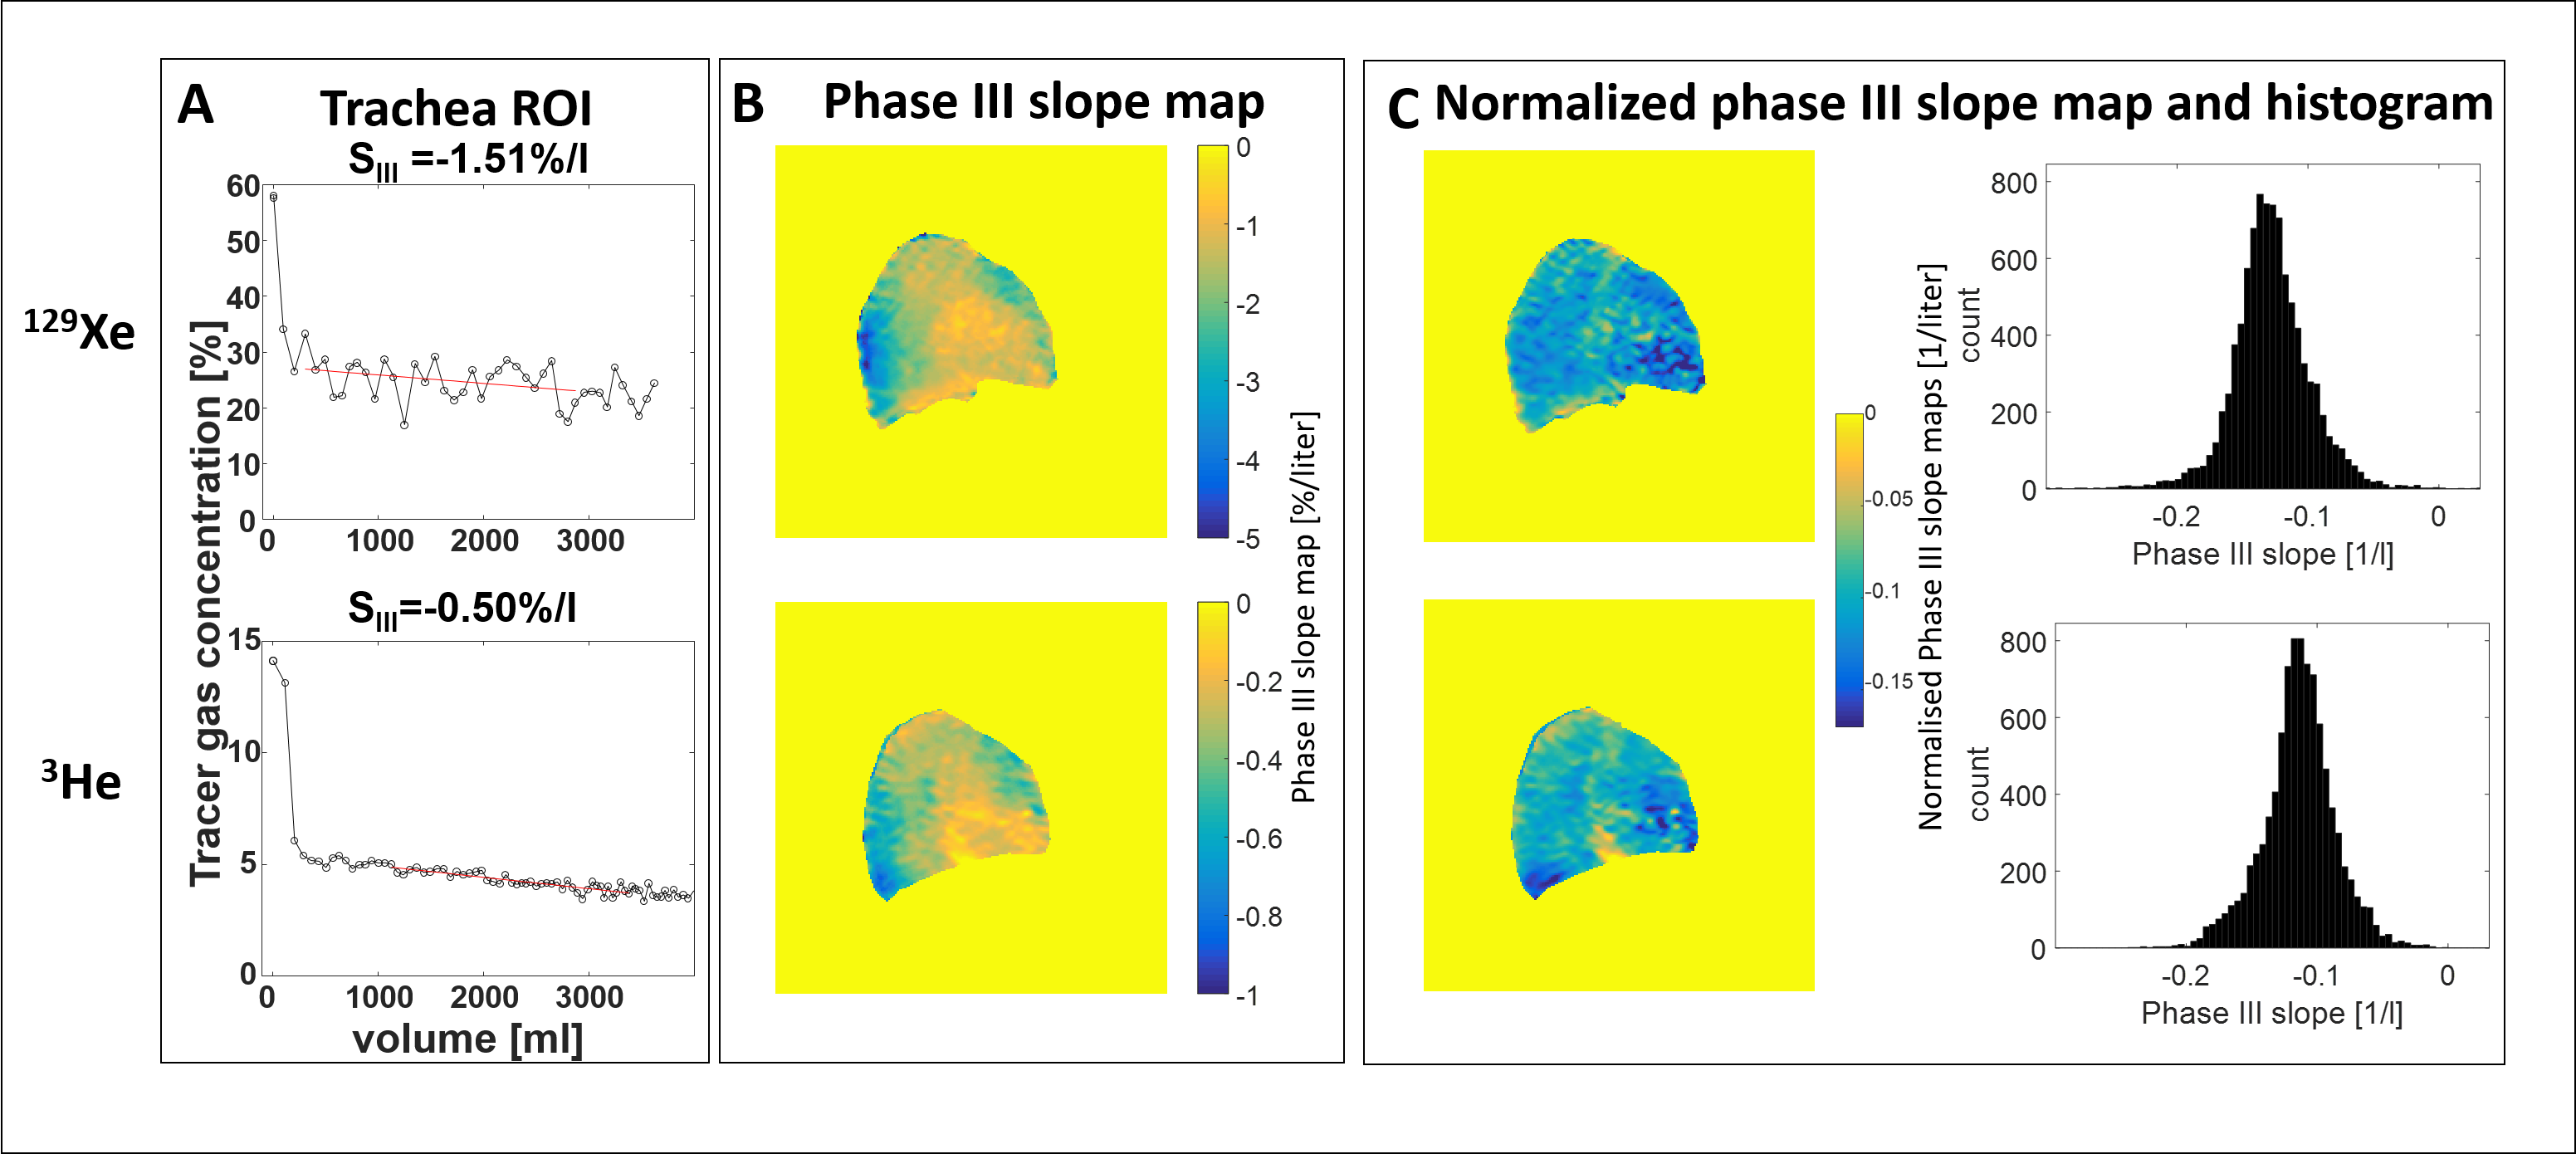
Where $$$S(r,t)$$$ is the measured image intensity at position $$$r(x,y)$$$ and t is the time at the discrete points of measurement. $$$V_{tracer}$$$ is the total inhaled volume of 3He or 129Xe gas. The ratio of $$$V_{tracer}/\sum_r S(r,1)$$$ is calculated from the first image (as gas in lungs=the amount inhaled). $$$V_{^{1}H}(r)$$$ is the regional lung volume derived from the segmented 3D 1H-MR images (Figure 2C). Regional maps of SBW slope (corresponding to the phase III ‘alveolar’ slope measured in SBW at the mouth) were calculated pixel-by-pixel as the normalized signal decay ($$$S_{n}(r,t)$$$ per unit exhaled gas volume [%/liter], following the convention of the SBW test. Finally, to enable comparison of SBW slope maps, values were normalized by the regional initial signal.
Results
Example data of the Phase III slope calculated from SBW-imaging in a ROI in the trachea are shown in Figure 3A. The (normalised) phase III slope maps of the lung (with corresponding histograms) from one volunteer are shown in Figure 3B/C. Inter-subject normalized phase III slopes were: mean(standard deviation)=-0.17(0.05) and -0.14(0.03) for 129Xe and 3He SBW-imaging,the difference was not yet significant. However, highly significant (P<0.0001) correlations on a pixel-wise basis between the 3He and 129Xe phase III slope maps were found in all subjects.Discussion
SBW-imaging highlights regional differences in the exhalation of tracer gases with different diffusion coefficients. The findings in our study are in agreement with trends seen in SBW data from the pulmonary function lab (see Figure 1), in that the heavier, less diffusive gas (in this case 129Xe) has a steeper phase III slope than the lighter gas, indicating increased regional ventilation heterogeneity due to a lesser degree of diffusional mixing in the airspaces.Conclusion
This work presents a method to quantify regional phase III (alveolar) slopes from hyperpolarized 129Xe and 3He MR acquisitions. In future work, this method could be utilized to investigate changes in the regional distribution of phase III slope in lung disease and how this relates to conventional ventilation-weighted imaging.Acknowledgements
No acknowledgement found.References
1. Robinson PD, Latzin P, Verbanck S, et al. Consensus statement for inert gas washout measurement using multiple- and single- breath tests. Eur Respir J. 2013;41(3):507-522.
2. Horn F, Rao M, Stewart NJ, Wild JM. Multiple breath washout of hyperpolarized 129Xe and 3He in human lungs with three dimensional balanced steady-state free-precession imaging. MRM. 2016; DOI.: 10.1002/mrm.26319.
3. Singer F, Stern G, Thamrin C, Fuchs O et al. Tidal volume single breath washout of two tracer gases- a practical and promising lung function test. PLoS One. 2011;6(3):e17588.
4. Tzeng YS, Lutchen K, Albert M. The difference in ventilation heterogeneity between asthmatic and healthy subjects quantified using hyperpolarized 3He MRI. J Appl Physiol. 2009;106(3):813-822.
Figures