2138
3D Mapping of Whole Lung Morphometry with 129Xe Diffusion-Weighted MRI and Compressed Sensing: Comparison with 3He1Academic Unit of Radiology, University of Sheffield, Sheffield, United Kingdom, 2Department of Bioengeering, Universidad Carlos III de Madrid, Madrid, Spain
Synopsis
3D whole lung morphometry maps were acquired with 129Xe DW-MRI and compressed sensing. Prospective three-fold undersampled 3D 129Xe lung morphometry (LmD) maps were derived using the stretched exponential model (SEM) and compared with equivalent 3He datasets. Five healthy volunteers were imaged using a range of 129Xe diffusion times and the most agreeable 129Xe and 3He LmD results were obtained with a 129Xe diffusion time of 8.5 ms. These results indicate that the LmD values derived from the SEM are dependent on diffusion time and that 129Xe could present a clinically-viable alternative to 3He for whole lung morphometry mapping.
Purpose
Whole lung morphometry mapping for quantitative regional assessment of lung microstructure has been demonstrated with 3D multiple b-value 3He DW-MRI and compressed sensing (CS). 1 With the limited supply and rising cost of 3He gas, 129Xe has been explored as a cost-effective alternative for pulmonary MRI, and recent studies have shown that comparable ventilation and microstructural information can be obtained with both nuclei. 2 However, DW-MRI with 129Xe is inherently more challenging due to its lower diffusivity and gyromagnetic ratio resulting in a longer diffusion gradient time and lower image SNR. In this work, CS was implemented for the acquisition of 3D 129Xe morphometric maps of mean diffusion length scale (LmD) in a single breath-hold and results were compared against equivalent 3He data.Methods
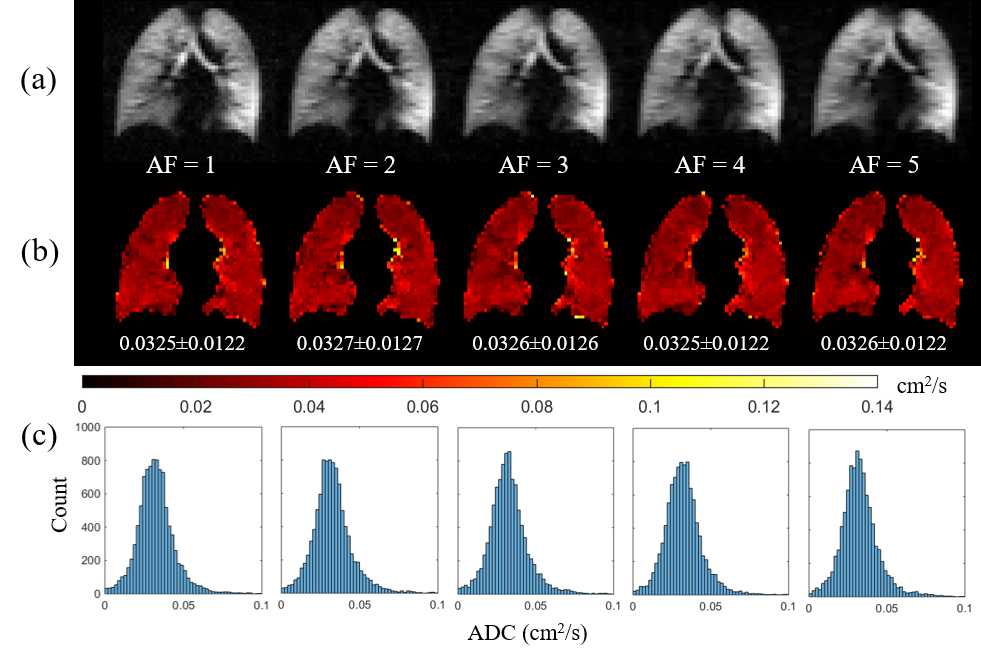
Firstly, retrospective CS simulations were performed using methodology described previously 1 with acceleration factors of 1-5 to investigate the feasibility of CS for 3D 129Xe multiple b-value DW-MRI. A good preservation of image details and quantitative lung microstructural information (apparent diffusion coefficient) was observed with increased undersampling (Figure 1). An optimum sampling pattern for 3-fold undersampling was used for prospective acquisitions, wherein 129Xe multiple b-value DW-MRI data was acquired at two different diffusion times (Δ=5 and 10 ms) in three healthy volunteers. Δ=5 ms corresponds to the standard diffusion time for 129Xe lung morphometry 3-5 that was optimised such that in-vivo values of geometrical parameters from a lung morphometry model are the same with both 129Xe and 3He. 3 Δ=10 ms in contrast, corresponds to the same 1D diffusion length (√2D0Δ) probed by 3He in previous experiments 1 (assuming D0Xe-air=0.14 cm2/s, D0He-air=0.88 cm2/s, and ΔHe=1.6 ms).
Data was acquired on a GE HDx 1.5T MR scanner with a gas mixture of 750mL enriched 129Xe and 250mL nitrogen, with imaging parameters: 3D SPGR, elliptical-centric phase encoding, b=0, 12, 20, 30 s/cm2, 64x52x18 matrix, FOV: 40x32.5x27 cm3, TE/TR: 11.7/15.0 ms for Δ=5 ms (TE/TR: 15.3/18.6 ms for Δ=10 ms), bandwidth = ±7 kHz. LmD maps were calculated using the stretched exponential model (SEM) 6 and results were compared to LmD maps acquired previously in the same volunteers using 3He.
Results and Discussion
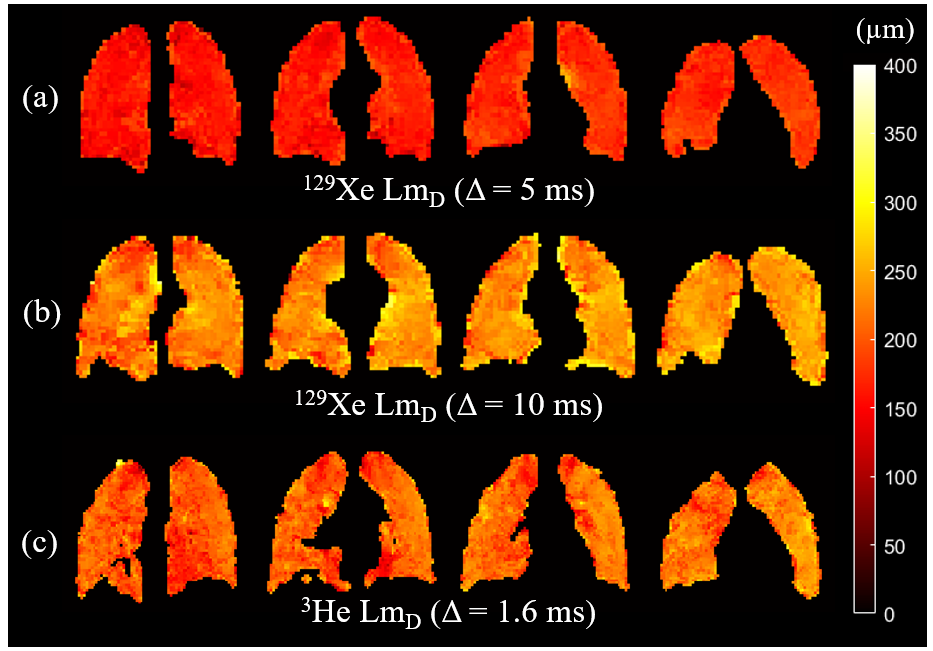
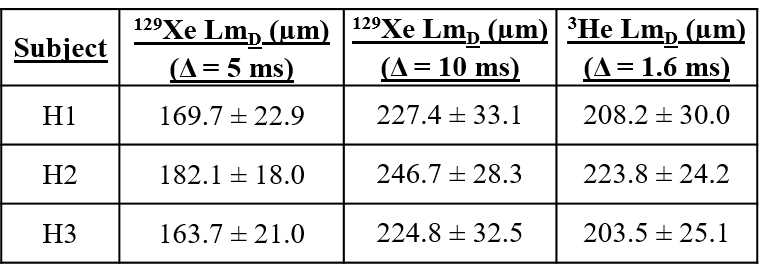
Example slices of 129Xe and 3He LmD maps for one healthy volunteer and a summary of mean LmD values for each volunteer are shown in Figure 2 and Table 1, respectively. At Δ=5 ms, mean 129Xe LmD values were about 40 µm smaller on average than mean 3He values. This LmD mismatch reflects the difference in scan parameters and diffusivities resulting in different 1D diffusion lengths. At Δ=10 ms, the mean 129Xe LmD values were closer to the 3He values, with a mean difference of ~20 µm. These results show that the LmD values derived from the SEM are dependent upon the diffusion time used for the experiments, and that even with the same characteristic diffusion length with both nuclei, the LmD values are not in agreement.
With the aim of obtaining comparable 129Xe and 3He lung morphometry results, an optimal 129Xe diffusion time was chosen empirically based on results from one healthy volunteer that was imaged at two additional diffusion times (Δ=7 and 8 ms). A strong linear correlation (r=0.997, p=0.003) was found between all four 129Xe diffusion times and the corresponding 129Xe LmD values. At a 129Xe diffusion time of 8.5 ms, the 129Xe LmD value was observed to match the volunteer’s 3He LmD value. A similar trend was observed in the other two healthy volunteers using data at Δ=5 and 10 ms.
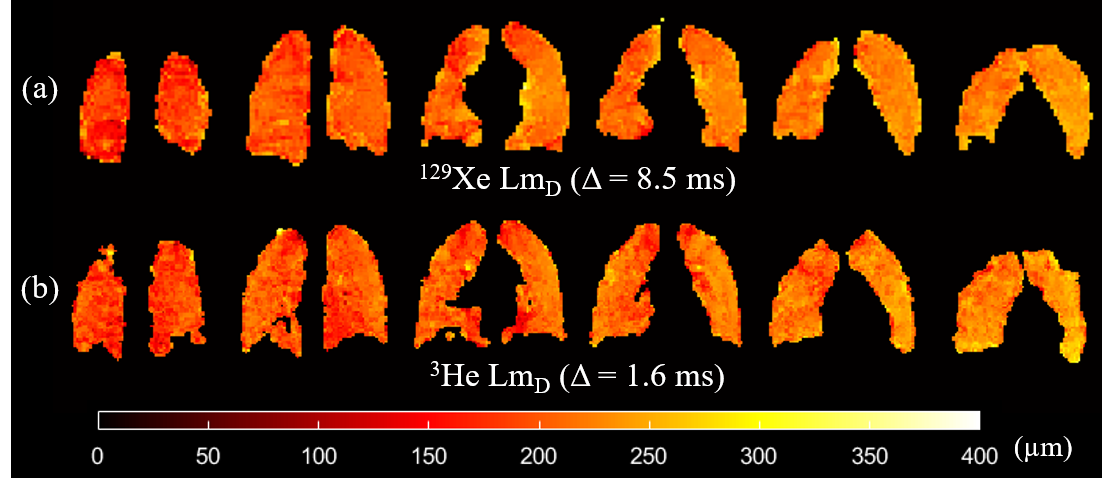
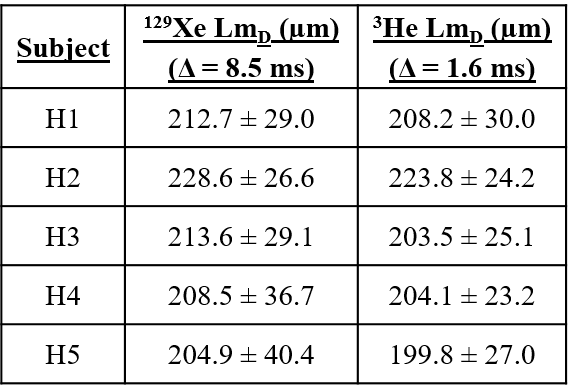
To validate this empirically-optimised 129Xe diffusion time, five healthy volunteers were scanned with Δ=8.5 ms, and improved matching of 129Xe and 3He LmD results was obtained (Figure 3). A difference of ≤5 µm was observed in four of the five healthy volunteers (Table 2). This difference (≤5%) is well within typical LmD standard deviation ranges indicating good agreement and demonstrates that comparable lung morphometry maps can be obtained with 129Xe.
Conclusion
We have demonstrated the feasibility of acquiring 3D whole lung morphometry maps with multiple b-value 129Xe DW-MRI. The most agreeable 129Xe and 3He LmD results were obtained with an empirically-optimised 129Xe diffusion time of 8.5 ms, indicating that 129Xe could present a cost-effective clinically-viable alternative to 3He for whole lung morphometry assessment.Acknowledgements
No acknowledgement found.References
1. Chan, H-F. et al. (2016). Magn Reson Med. doi: 10.1002/mrm.26279.
2. Kirby, M. et al. (2012). Radiology, 265(2): 600-610.
3. Sukstanskii, A. et al (2012). Magn Reson Med. 67(3): 856-866.
4. Ouriadov, A., et al. (2015). Magn Reson Med. 74(6): 1726-1732.
5. Ouriadov, A., et al. (2013). Magn Reson Med. 70(6): 1699-1706.
6. Parra-Robles, J. et al. (2014). Proc ISMRM:3529.
Figures