2134
Quantitative assessement of MRI Background Parenchymal Enhancement in comparison with qualitative assessment – Can it predict breast cancer?1Department of Biomedical Imaging and Image-guided Therapy, Medical University of Vienna, Vienna, Austria
Synopsis
While breast density is a recognized risk factor for breast cancer, the role of background parenchymal enhancement (BPE) is still controversially discussed. Since BPE reflects hormonally active breast tissue, it may serve as a biomarker for malignancy. Current assessment of BPE, however, is hampered by the subjective nature of its assessment. We therefore tested an automated approach that quantified the percentage of enhancing breast tissue of the entire contralateral breast. This pilot study finds the amount of quantitatively assessed enhanced breast parenchyma as a percentage of the entire breast to inversely correlate with breast cancer risk, while visually estimated BPE did not correlate with breast cancer.
INTRODUCTION:
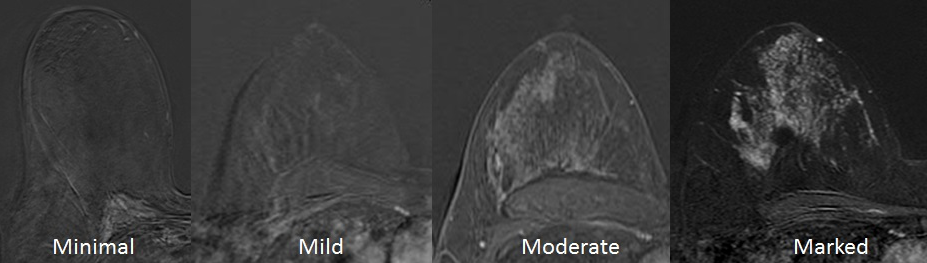
While breast density is an established risk factor for breast cancer1–5, the amount of Background Parenchymal Enhancement (BPE) at contrast enhanced breast MRI is still controversially discussed as a potential risk factor for breast cancer. Two case-control studies investigating high-risk cohorts have found a strong correlation of elevated BPE with an increased risk for breast cancer and resulting odds ratios of approximately 106,7. On the other hand recent data from a large cross-sectional non-high risk cohort found elevated levels of BPE not to indicate an increased risk for breast cancer8. A limitation of all studies published on this topic so far, however, is the fact that BPE was assessed qualitatively at the discretion of the reporting radiologist, following current BI-RADS guidelines (see figure 1). These state that “Although there may be considerable variation in visually estimating BPE, categorizing based on percentages (and specifically into quartiles) is not recommended. Quantification of BPE volume and intensity on MRI may be feasible in the future, but we await publication of robust data on that topic before endorsing percentage recommendations.”9 Given this considerable variation in visual BPE estimation and the possible implications of BPE as a risk indicator for breast cancer we sought to establish a protocol to automatically assess BPE values and correlate the automated measurement as well as conventional BPE assessment values with malignant outcome in a proof-of-principle study.METHODS:
In this retrospective IRB-approved study, consecutive patients who underwent two breast MRI examinations with different contrast agents (>24h apart; median 2+/-1.7days) between 1/2014-6/2014 for a lesion rated BI-RADS 4/5 at conventional imaging were included. All lesions had to be histopathologically verified. A view‐sharing 3D gradient echo sequence (TWIST, TR 6.23, TE 2.95, GRAPPA factor 3, spatial resolution 0.9×0.9×1.1, temporal resolution 28s, interpolated to 14s) with water excitation and fat saturation, was acquired in axial orientation on a 3T MRI scanner (TIMTrio, Siemens Healthcare) usaing a dedicated 16‐channel bilateral breast coil (Sentinelle, Invivo). A bodyweight‐adapted equimolar dosage of 0.1 mmol/kg contrast medium (0.2 ml/kg MultiHance, Bracco or 0.2 ml/kg Dotarem, Guerbet) was injected intravenously with an automated device (Spectris, Medrad) at a flow rate of 3 ml/s followed by a 15 ml saline flush after a baseline scan. Pre-contrast images at 58s, scans at 211s and 388s were imported into a dedicated computer assisted diagnosis (CAD) software (Brevis, Siemens Healthcare). A threshold (20%) for relative signal increase at the first minute was set to remove voxels considered noise. A volume of interest (VOI) was drawn manually to enclose the entire contralateral breast. CAD automatically determined total VOI and enhancing volume. Both readers, blinded to the final histological outcome, independently carried out both qualitative and quantitative measurements. For further statistical analysis percentage of enhancing volume of the contralateral breast, qualitatively assessed BPE and presence/absence of malignancy were cross-tabulated. Spearman’s rank correlation coefficient analysis and areas under the ROC curves were calculated with MedCalc 15 (MedCalc Software) software. P-values <0.05 were deemed significant.RESULTS:
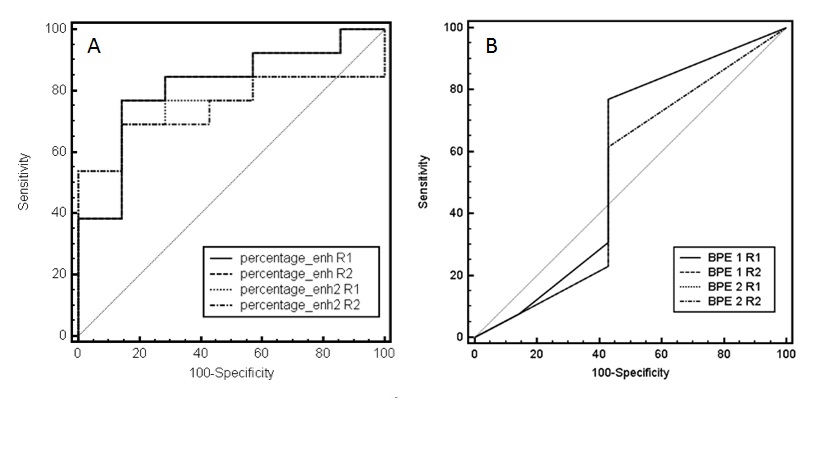
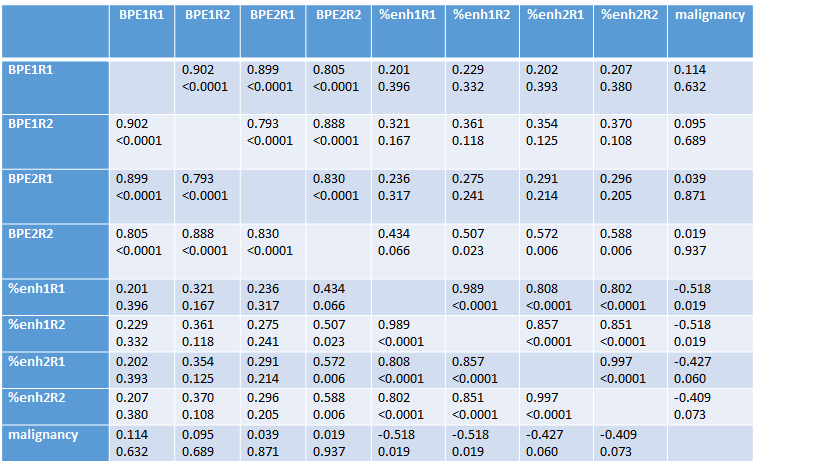
20 patients, harboring 20 lesions (13 malignant, 7 benign) were included in the assessment. Mean patient age was 62.3 years (range 42-84). Spearman’s rank correlation coefficient analysis is given in table 1. Both the quantitative and qualitative assessment method showed good interreader agreement and similar values for both Dotarem and Multihance, respectively (p<0.05). Quantitatively assessed BPE, did not correlate with visually estimated BPE, except for reader 2 in Dotarem enhanced MRIs. No statistically significant correlation was found between visually assessed BPE and malignant diagnosis (p>0.05). All quantitative assessements unveiled a negative correlation coefficient related to malignancy (Multihance p<0.05, Dotarem p<0.07). Figure 2 compares the area under the ROC curves for quantitative and qualitative assessment. andDISCUSSION:
Results from the quantitative assessment method indicate that high percentages of enhancing breast volume are associated with benignity. This finding fits the results from a previously published large cross-sectional study8. Interestingly, however, conventionally assessed BPE showed no significant correlation with malignant diagnosis, despite the inter-reader agreement being good. Based on these preliminary results, we speculate that percentage of enhancement of total breast volume rather than volume and intensity of enhancement of the fibroglandular tissue, may more accurately correlate with malignancy.CONCLUSION:
The findings from this pilot studies suggest that quantitatively assessed enhancing breast tissue as a percentage of the entire breast volume may serve as an indicator for breast cancer. Given the potential clinical implications of this finding, further studies are warranted.Acknowledgements
No acknowledgement found.References
1. Boyd NF, Byng JW, Jong RA, Fishell EK, Little LE, Miller AB, et al. Quantitative classification of mammographic densities and breast cancer risk: results from the Canadian National Breast Screening Study. J Natl Cancer Inst. 1995;87: 670–675.
2. Boyd NF, Guo H, Martin LJ, Sun L, Stone J, Fishell E, et al. Mammographic density and the risk and detection of breast cancer. N Engl J Med. 2007;356: 227–236. doi:10.1056/NEJMoa062790
3. Byrne C, Schairer C, Brinton LA, Wolfe J, Parekh N, Salane M, et al. Effects of mammographic density and benign breast disease on breast cancer risk (United States). Cancer Causes Control CCC. 2001;12: 103–110.
4. Ursin G, Ma H, Wu AH, Bernstein L, Salane M, Parisky YR, et al. Mammographic density and breast cancer in three ethnic groups. Cancer Epidemiol Biomark Prev Publ Am Assoc Cancer Res Cosponsored Am Soc Prev Oncol. 2003;12: 332–338.
5. Vachon CM, van Gils CH, Sellers TA, Ghosh K, Pruthi S, Brandt KR, et al. Mammographic density, breast cancer risk and risk prediction. Breast Cancer Res BCR. 2007;9: 217. doi:10.1186/bcr1829
6. Dontchos BN, Rahbar H, Partridge SC, Korde LA, Lam DL, Scheel JR, et al. Are Qualitative Assessments of Background Parenchymal Enhancement, Amount of Fibroglandular Tissue on MR Images, and Mammographic Density Associated with Breast Cancer Risk? Radiology. 2015;276: 371–380. doi:10.1148/radiol.2015142304
7. King V, Brooks JD, Bernstein JL, Reiner AS, Pike MC, Morris EA. Background parenchymal enhancement at breast MR imaging and breast cancer risk. Radiology. 2011;260: 50–60. doi:10.1148/radiol.11102156
8. Bennani-Baiti B, Dietzel M, Baltzer PA. MRI Background Parenchymal Enhancement Is Not Associated with Breast Cancer. PloS One. 2016;11: e0158573. doi:10.1371/journal.pone.0158573 9. Morris C, Comstock C, Lee C. ACR BI-RADS® Magnetic Resonance Imaging. ACR BI-RADS® Atlas, Breast Imaging Reporting and Data System. Reston, VA: American College of Radiology; 2013.
Figures