2130
Quantitative analysis of background parenchymal enhancement in whole breast on MRI: influence of menstrual cycle and comparison with qualitative analysis1Radiology, Ajou University Hospital, Suwon, Korea, Republic of
Synopsis
We quantitatively analyzed the background parenchymal enhancement of whole breast on MRI using in-house software with MATLAB.
The mean values of BPE were well correlated with qualitative grades of BPE.
The mean and ninety percentile values of BPE were lowest in 2nd week of menstrual cycle and highest in 4th week with statistical significance (p=0.005 for mean values and p=0.003 for nienty percentile, respectively).
Purpose
To quantitatively analyze the background parenchymal enhancement (BPE) in whole breast according to the menstrual cycle and to compare with qualitative analysis method
Materials and Methods
From January 2014 to December 2015, 311 patients were newly diagnosed as breast cancer. Of 311 patients, we excluded 38 patients who had bilateral breast cancer or didn’t know the exact last normal menstrual period. We measured the degree of BPE using the following equations: [(signal intensity at 2 min 30 second after contrast injection - baseline signal intensity) / baseline signal intensity] x 100 %. We quantitatively measured BPE using in-house software with MATLAB (MathWorks, Inc., Natick, MA, USA).
Results
On qualitative analysis, 53 patients had minimal BPE, 108 had mild, 87 had moderate and 25 had marked BPE. On quantitative analysis, mean values of BPE were 33.13 ± 11.93 in minimal BPE group, 42.12 ± 17.14 for mild group, 59.14 ± 18.57 for moderate group and 81.86 ± 18.38 for marked group. Mean values were significant different between each groups by one-way ANOVA and post-hoc analysis (p=0.009 for minimal vs mild, p<0.001 for minimal vs moderate, minimal vs marked, mild vs moderate, mild vs marked and moderate vs marked). Mean value of BPE was 48.70 ± 21.54 for patients at 1st week of menstrual cycle, 43.51 ± 15.15 for 2nd week, 49.00 ± 24.35 for 3rd week and 49.44 ± 21.94 for 4th week. The difference was significantly different between 2nd and 4th weeks (p=0.005). Ninety percentile value of BPE was 89.71 ± 34.03 for 1st week, 82.93 ± 24.96 for 2nd week, 91.92 ± 39.51 for 3rd week and 101.73 ± 36.34 for 4th week. The difference was significantly different between 2nd and 4th weeks (p=0.003). Mean and ninety percentile values were not significantly different between other groups.
Conclusion
Quantitative analysis of BPE was well correlated with qualitative BPE grade. Mean and ninety percentile values of BPE were lowest in the 2nd week and highest in the 4th week with statistical significance.
Acknowledgements
No acknowledgement found.References
No reference found.Figures
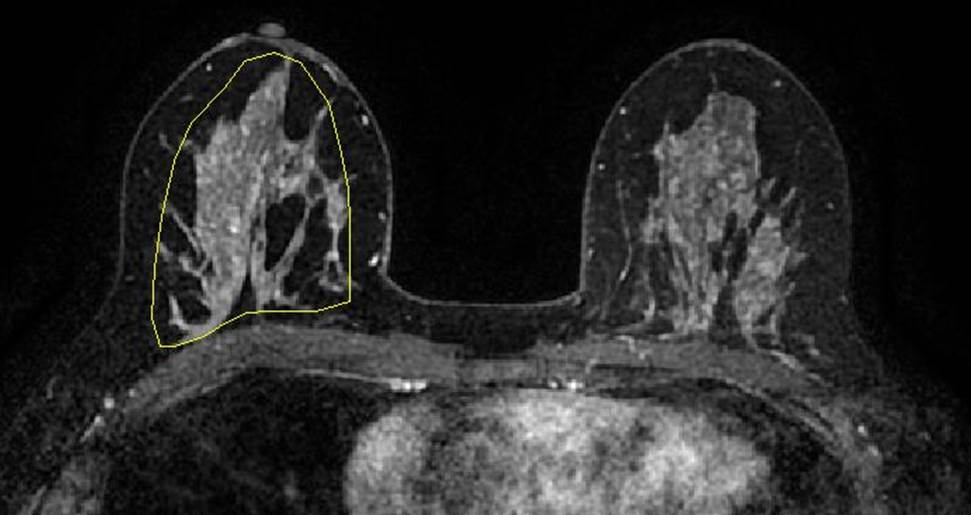

Then, the fat component is automatically excluded and the pixels of parenchymal portion are displayed with white color like figure 2.
On each pixels, we measured the degree of BPE using the following equations: [(signal intensity at 2 min 30 second after contrast injection - baseline signal intensity) / baseline signal intensity] x 100%.
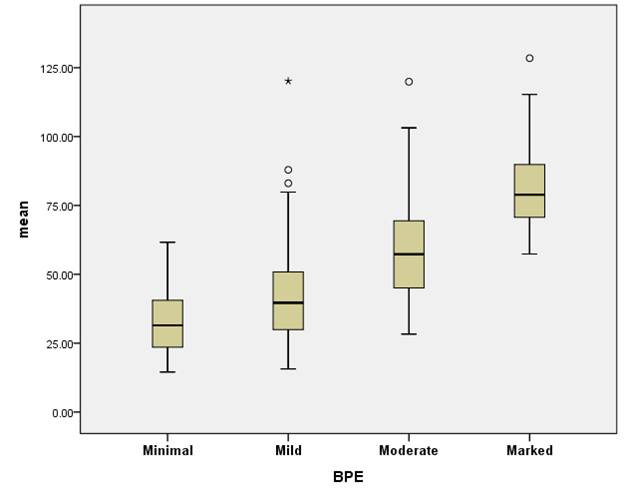
Mean values of BPE according to the qualitative BPE grade.
Mean values were significantly different between each groups (minimal vs mild, minimal vs moderate, minimal vs marked, mild vs moderate, mild vs marked and moderate vs marked)

Mean values of BPE according to the menstrual cycle.
Mean value of PBE was lowest in 2nd week and highest in 4th week with statistical significance (p=0.005).
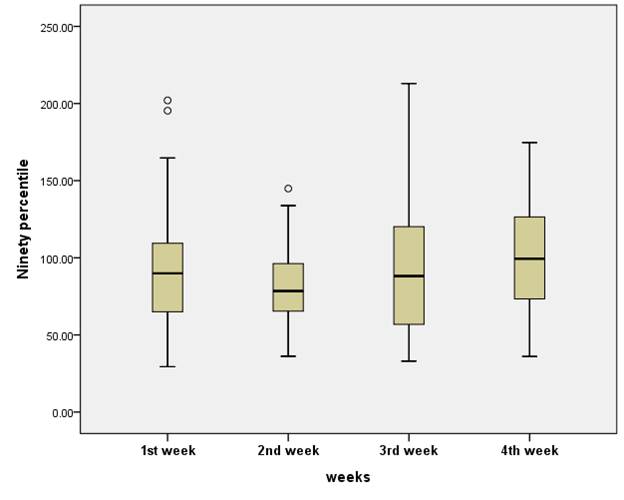
Ninety percentile values of BPE according to the menstrual cycle.
Ninety percentile value of PBE was lowest in 2nd week and highest in 4th week with statistical significance (p=0.003).