2128
Multicenter study of intravoxel incoherent motion (IVIM) metrics in breast cancer with software comparison.1Radiology, Bernard and Irene Schwartz Center for Biomedical Imaging, New York University School of Medicine, New York, NY, United States, 2Radiology, Memorial Sloan Kettering Cancer Center, New York, NY, United States, 3Radiology, Center for Advanced Imaging Innovation and Research (CAI2R), New York University Langone Medical Center, New York, NY, United States
Synopsis
This study compares data collected from different MR vendor systems using different software packages to better understand the robustness and reproducibility of IVIM metrics. Patient data from 2 sites (Site 1 & 2) from 1.5/3T systems (GE/Siemens) were analyzed with 2 software packages to derive IVIM biomarkers and their intersite/software variability. Results show that metrics of IVIM average and histogram analysis are robust quantitative imaging biomarkers for breast cancer.
Purpose
Intravoxel incoherent motion (IVIM)1 is sensitive to vascular/cellular components of cancer2-4, as shown in breast cancer studies2,5-16. There is still much to optimize about IVIM, and its intersite robustness in breast cancer populations has yet to be established. Here, we compare two software packages in evaluating IVIM data at two different sites for quantification of diffusion weighted imaging (DWI) data with the biexponential IVIM model. We compare different tools, vendors, and sites to support standardization practices for quantitative IVIM biomarkers in breast cancer evaluation.Methods
This IRB-approved, HIPAA-compliant retrospective study included 132 patients, between 2010-14, who underwent bilateral contrast-enhanced MRI with DWI in 1.5/3T MRI scanners at two cancer centers: Site 1 (GE Healthcare, Waukesha, WI) with a 16-/8-element breast coil (Sentinelle Medical, Toronto, Canada) and Site 2 (Siemens Healthcare, Erlangen, Germany) using a 7-element breast coil array (Invivo Corp, Gainesville, FL). Both sites included fat-suppressed T2-weighted imaging, DWI, and fat-suppressed T1-weighted pre-/post-contrast imaging. The DWI protocol consisted of either (Site 1) a single-shot spin echo EPI sequence (TR/TE = 4000/85.3 ms; 4 averages; FOV = 28 x 28 to 36 x 36 cm2; slice thickness: ~4 mm; acquired matrix: 128x128, interpolated to 256x256; 19-35 slices; and 10 b-values of 0 to 1000 s/mm2) or (Site 2) a twice-refocused, bipolar gradient single-shot turbo-spin echo (TSE) sequence (TR/TE = 2000/103 ms, 108 x 128 matrix, 18 axial slices, 2.7 x 2.7 x 4 mm voxel, single direction) with 10 b-values of 0 to 800 s/mm2. IVIM parameters were derived using a biexponential model1 through analyses from two image analysis packages: Software 1 - custom software using least squares fitting (Igor Pro 6, Wavemetrics, Portland, OR) or Software 2 (Firevoxel, New York University, NY) - a freeware medical image analysis software. A single operator drew regions of interest (ROIs) around the outer tumor border limiting IVIM analysis to the tumor region. Monoexponential analysis was performed to generate ADC maps of the lesion. Segmented biexponential IVIM analysis was performed to estimate Dt, fp, and Dp, from which mean, extremal, and histogram measures were derived. Clinical data were collected, including histology. A Mann-Whitney (MW) test was used to compare benign and malignant lesions in terms of each measure derived using each software package. The utility of each measure as a predictor of malignancy was characterized in terms of the area under the ROC curve (AUC) and tested for significance using binary logistic regression. Analyses were conducted with and without stratification by site/vendor. All statistical tests were conducted at the two-sided 5% significance level using SAS version 9.3 (SAS Institute, Cary, NC).Results
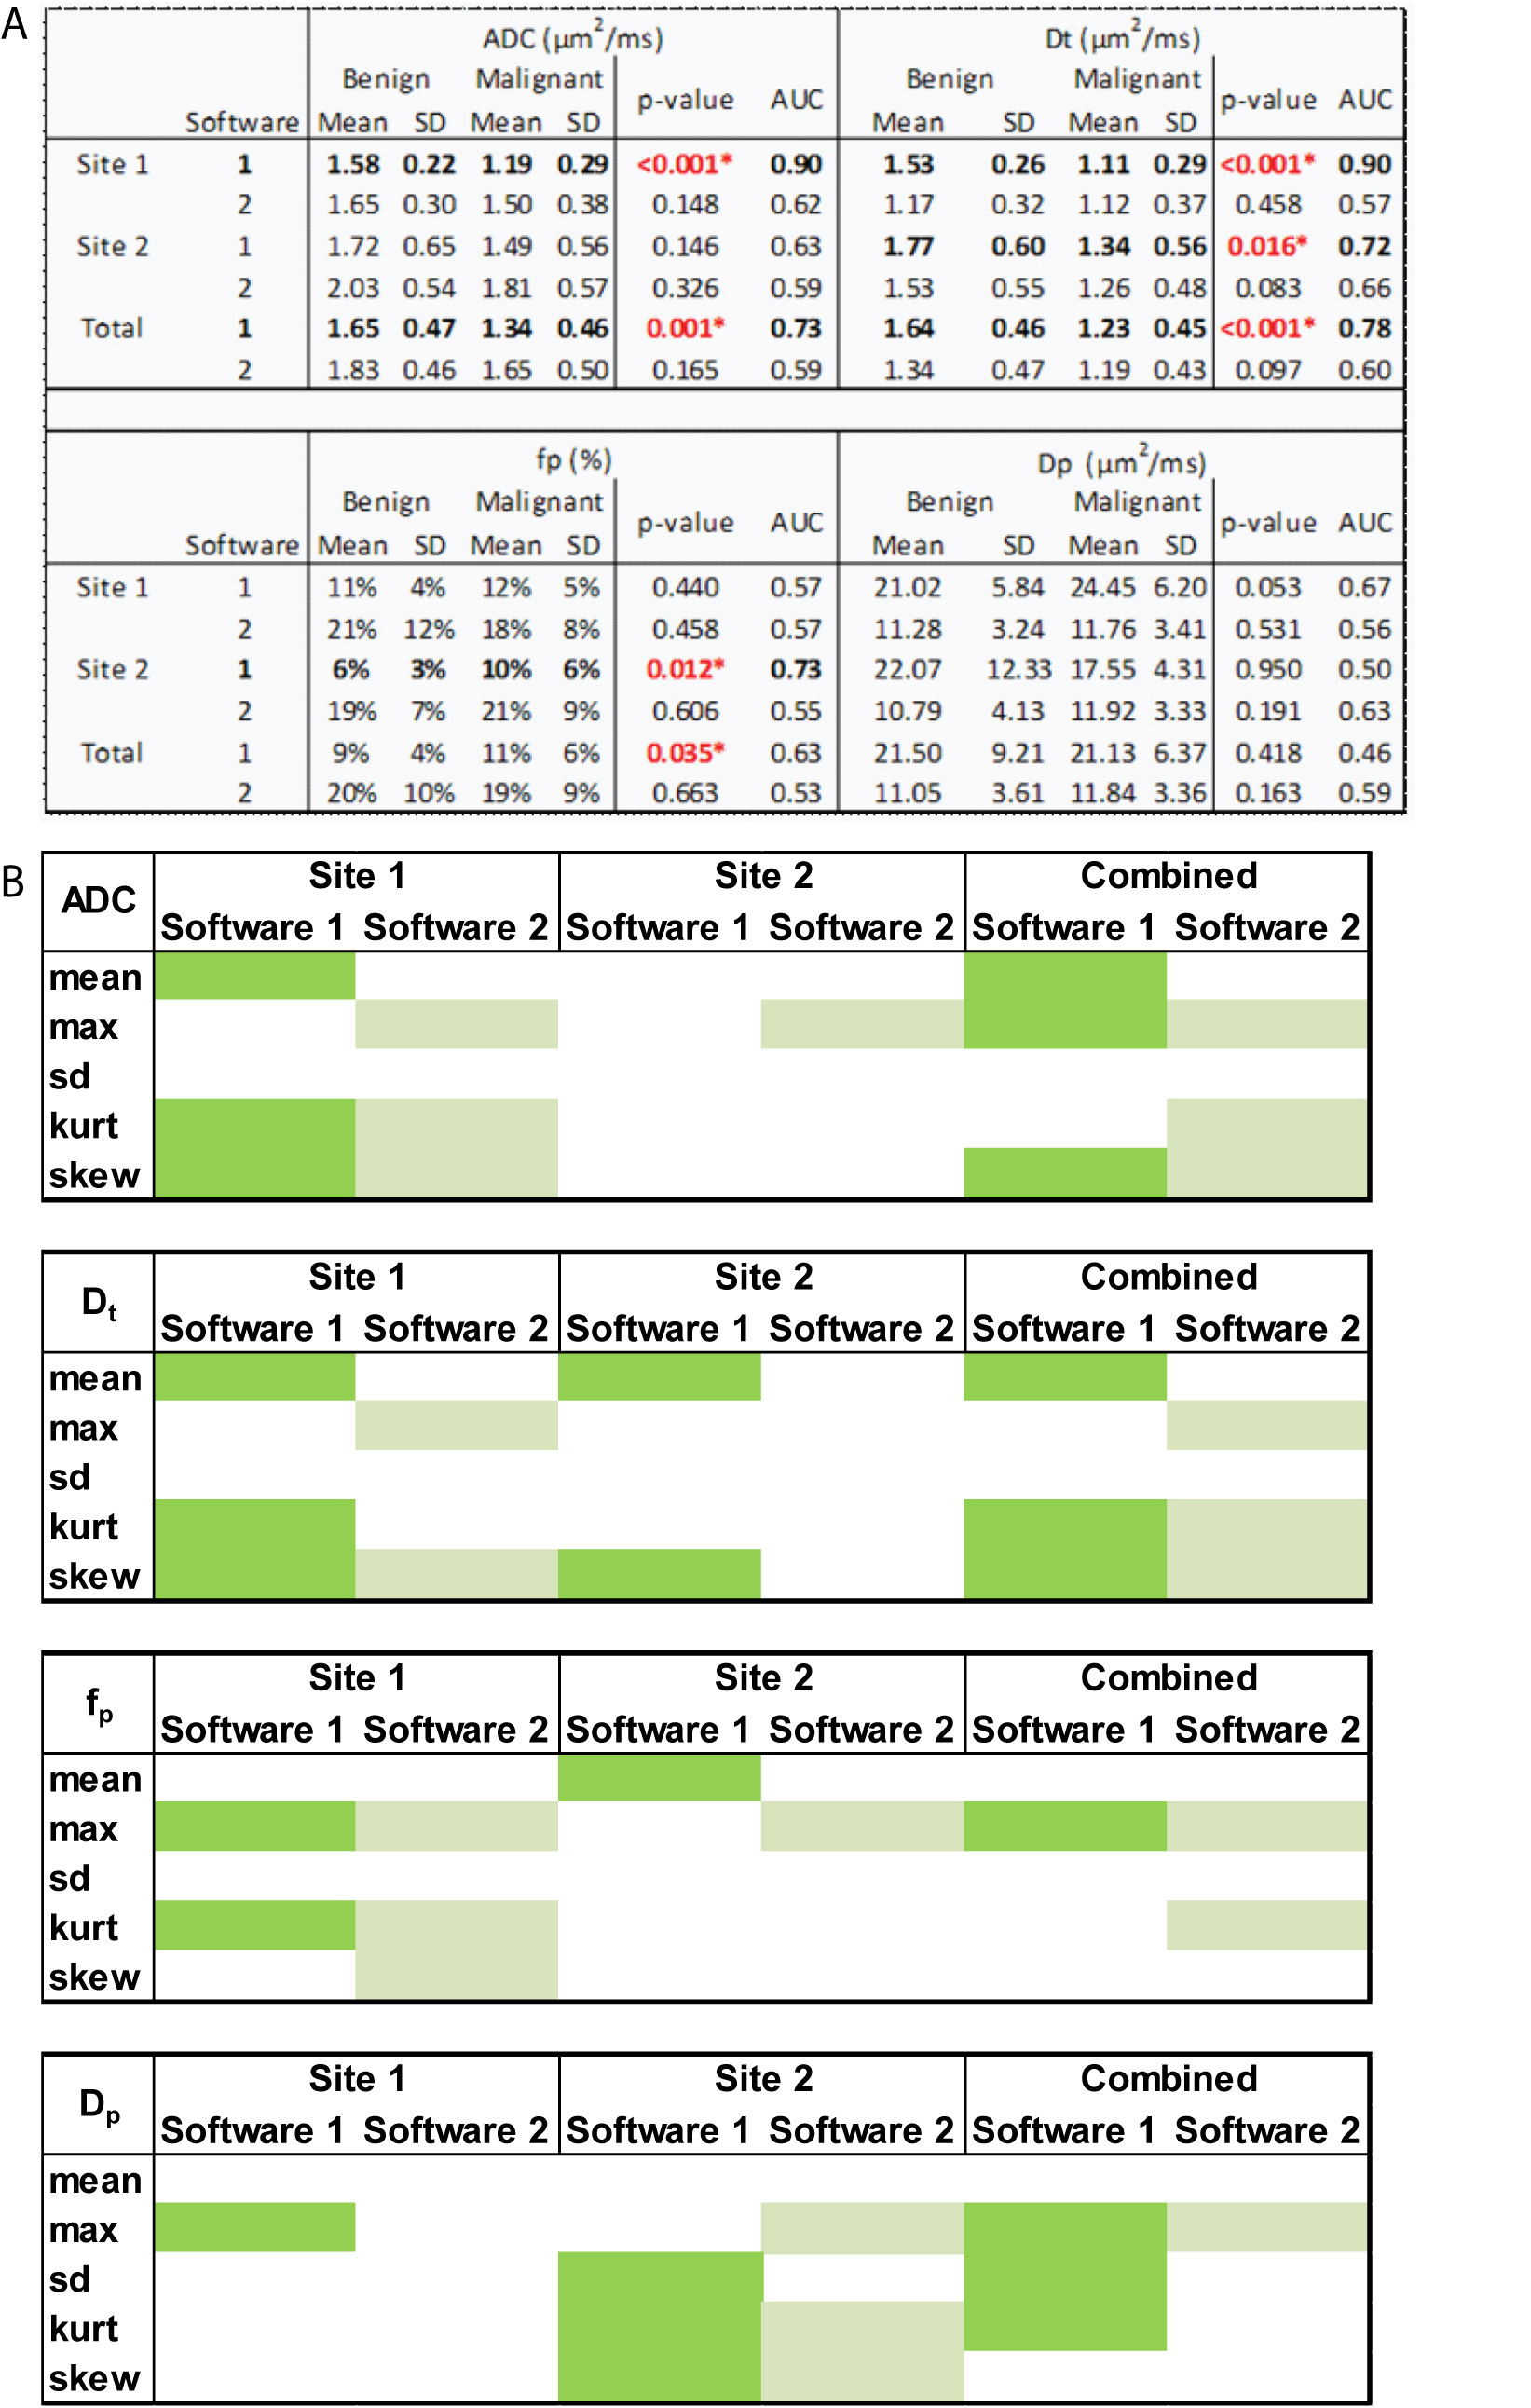
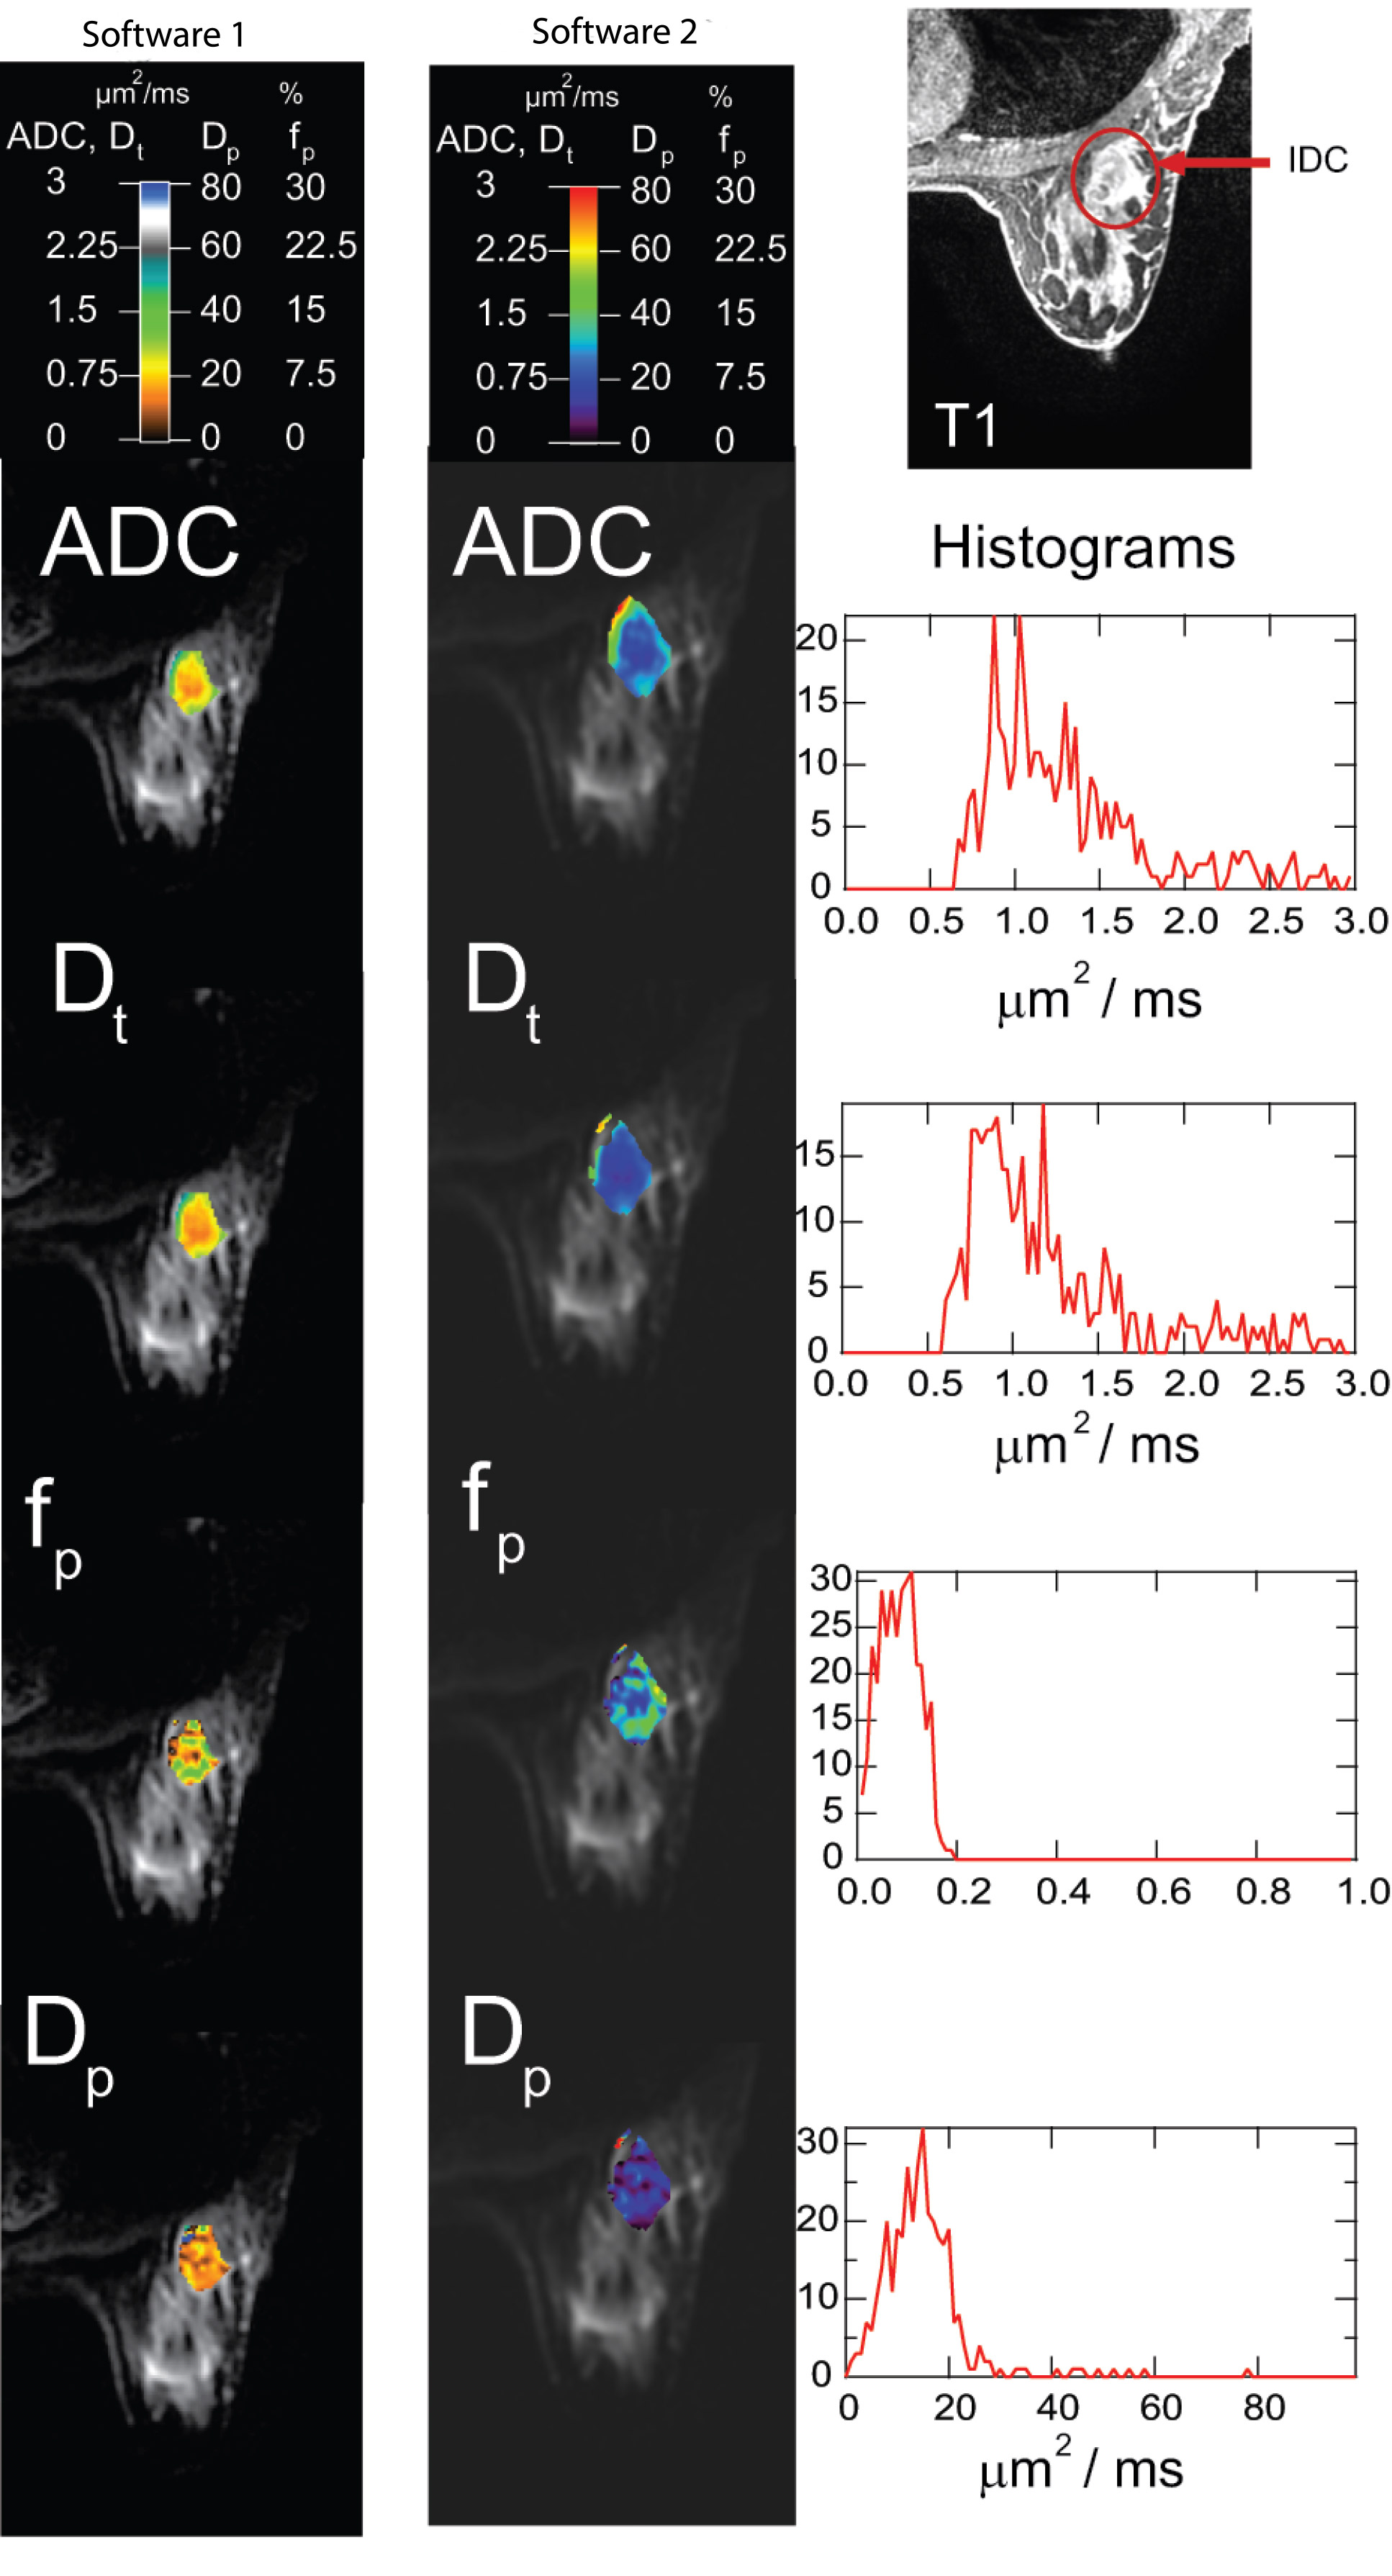
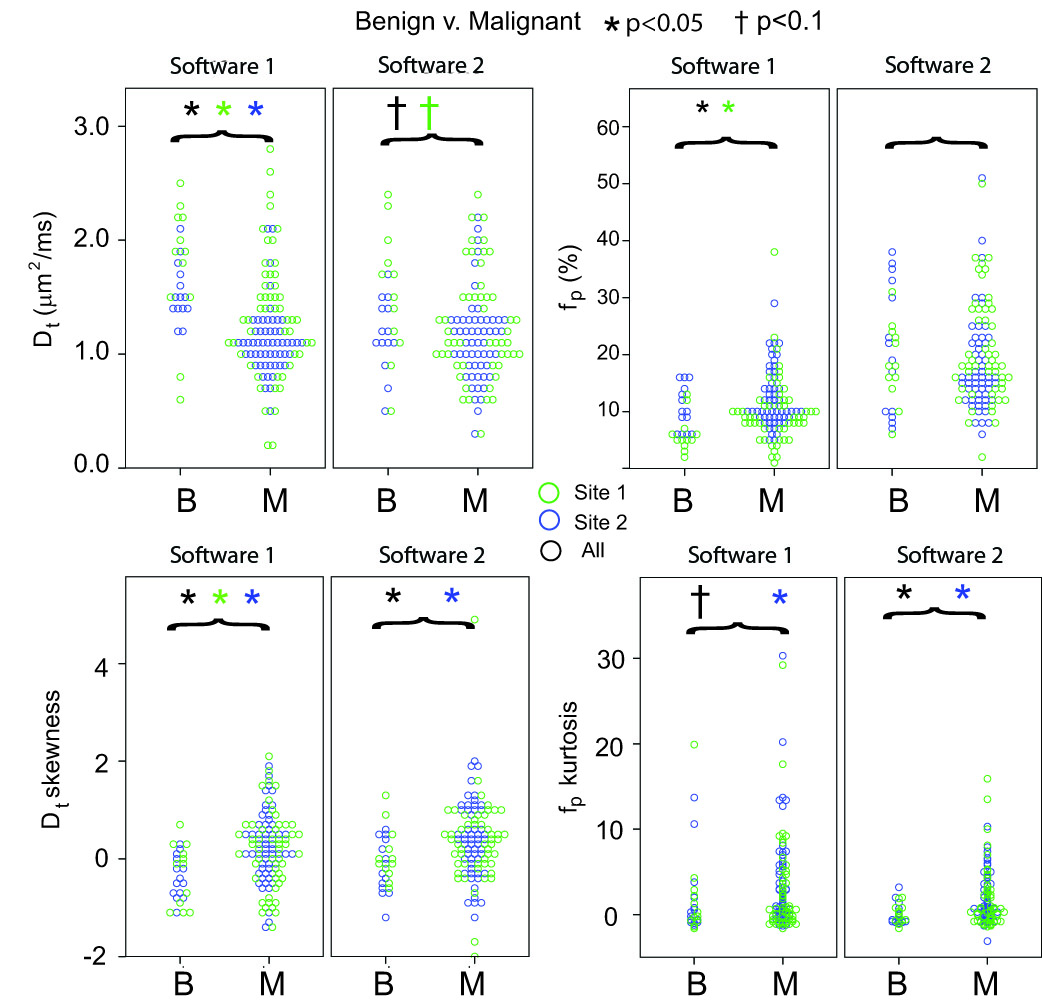
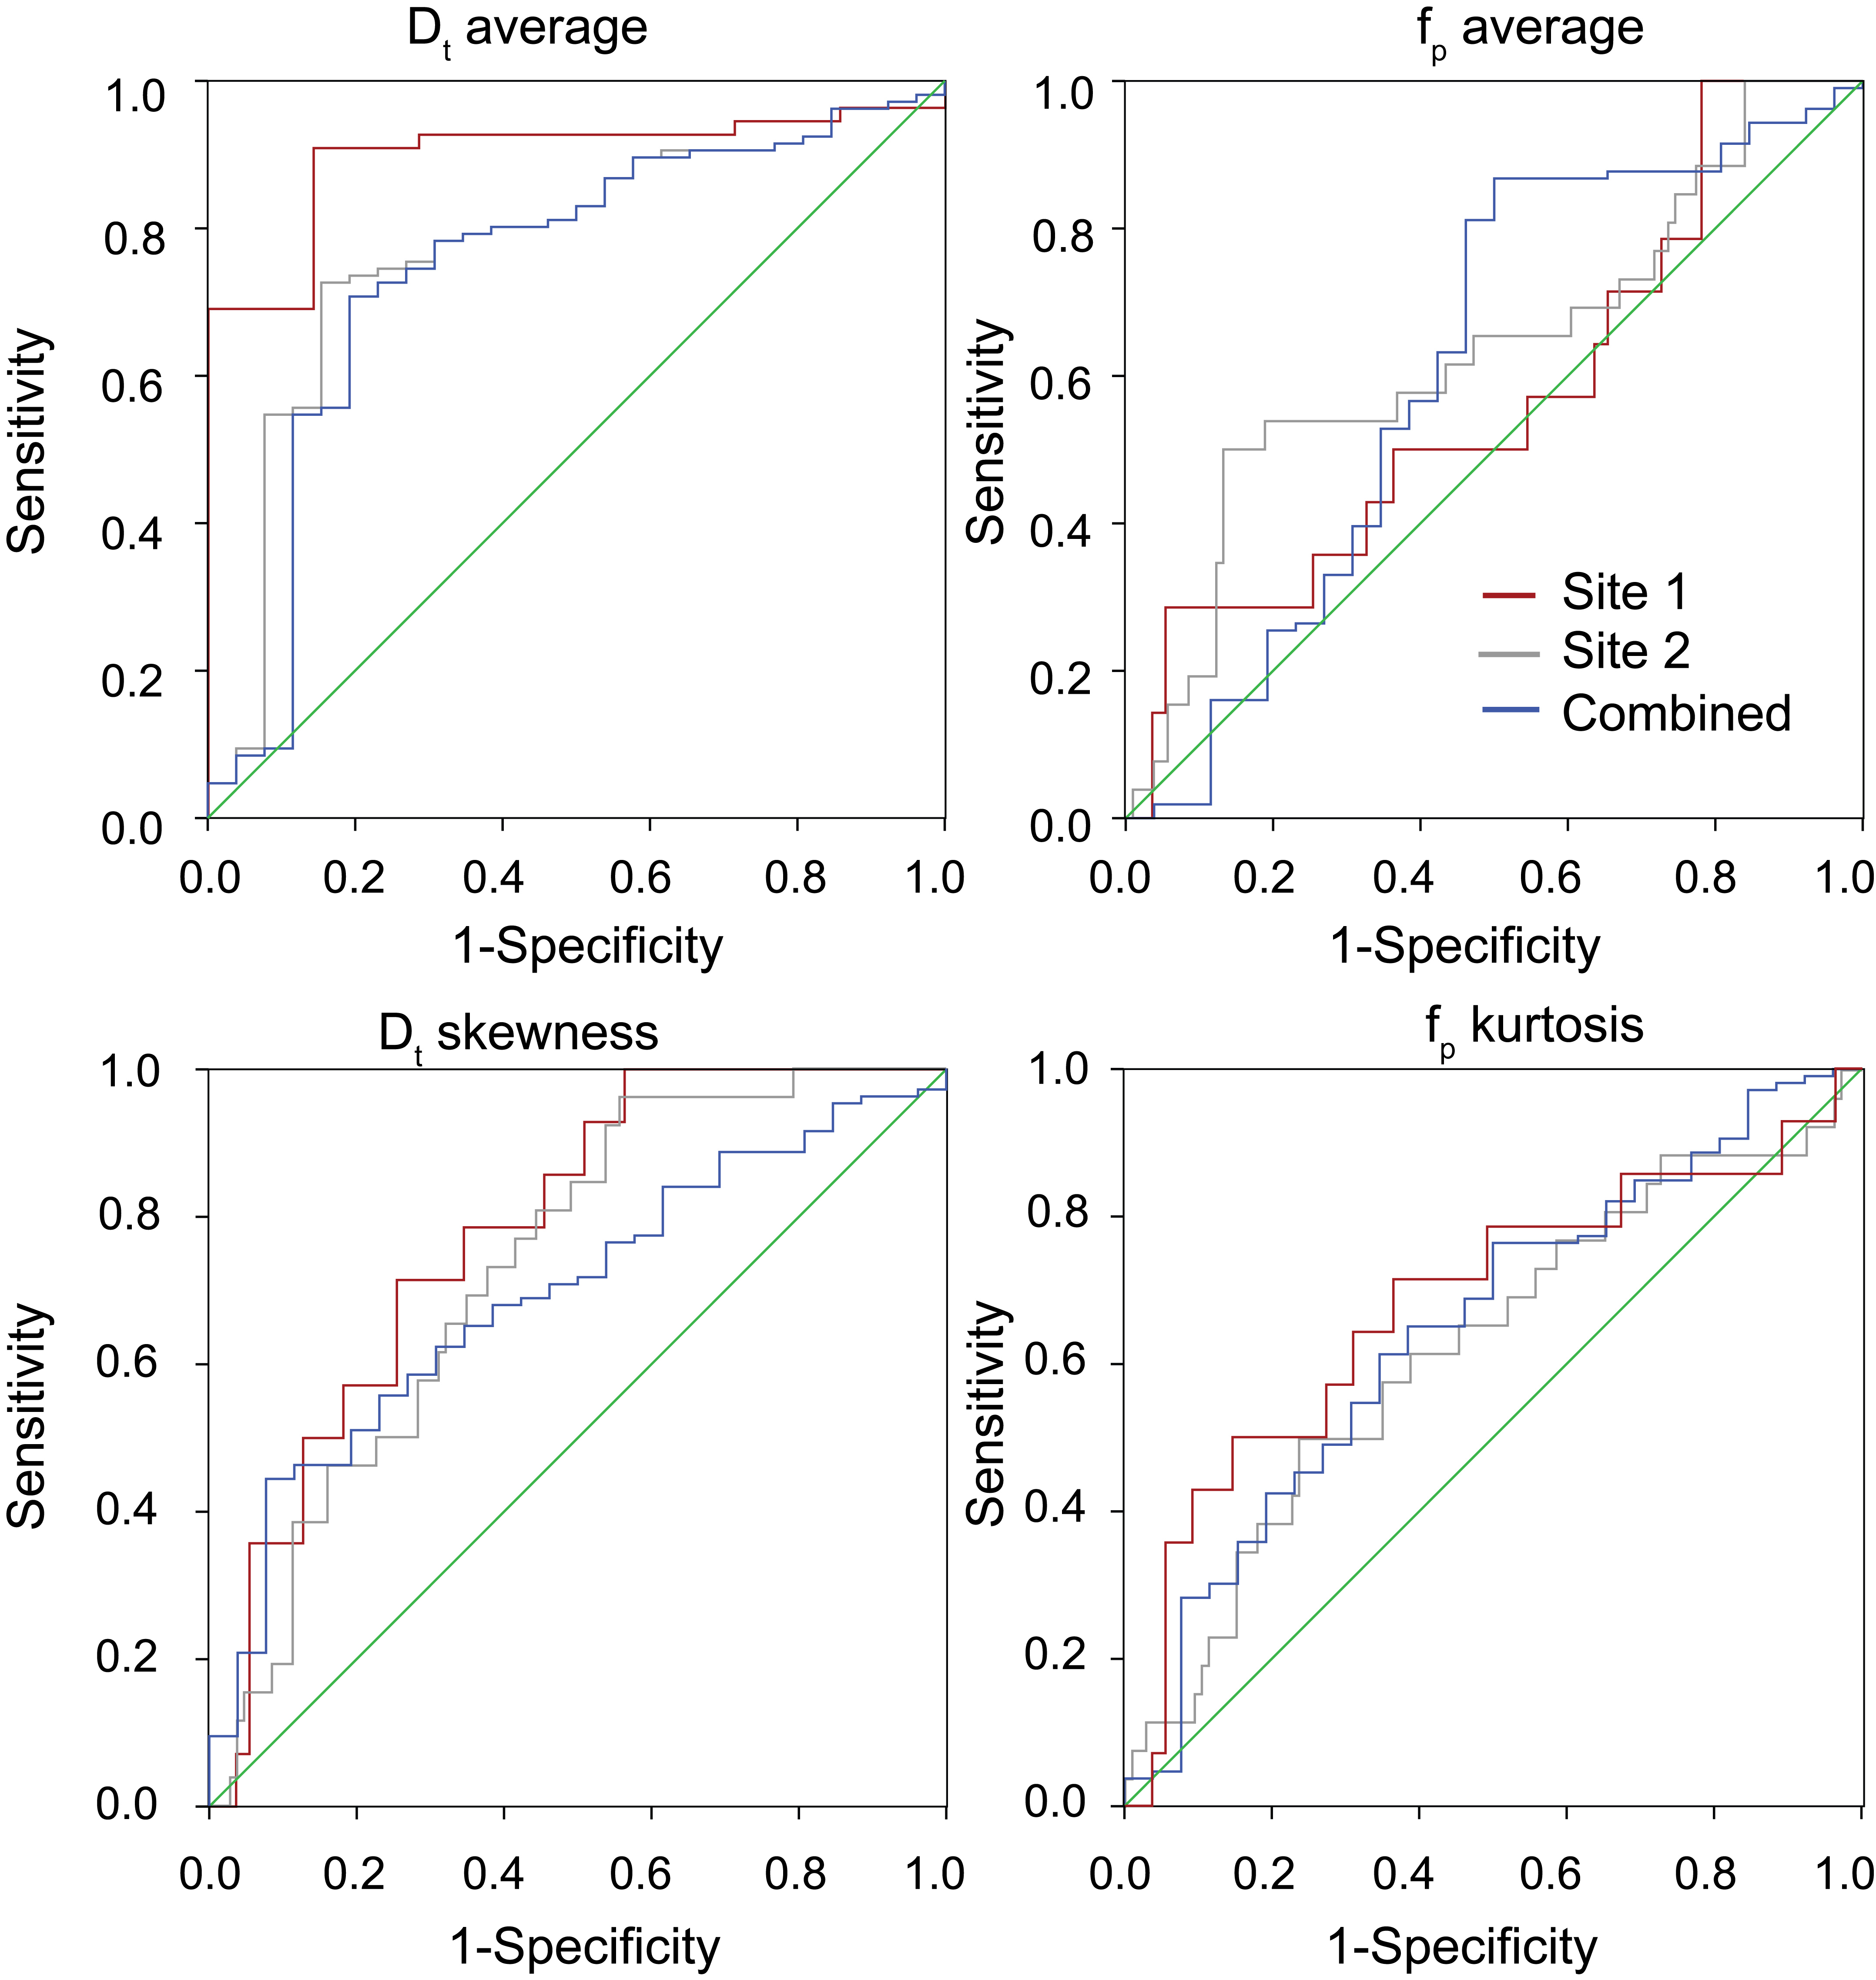
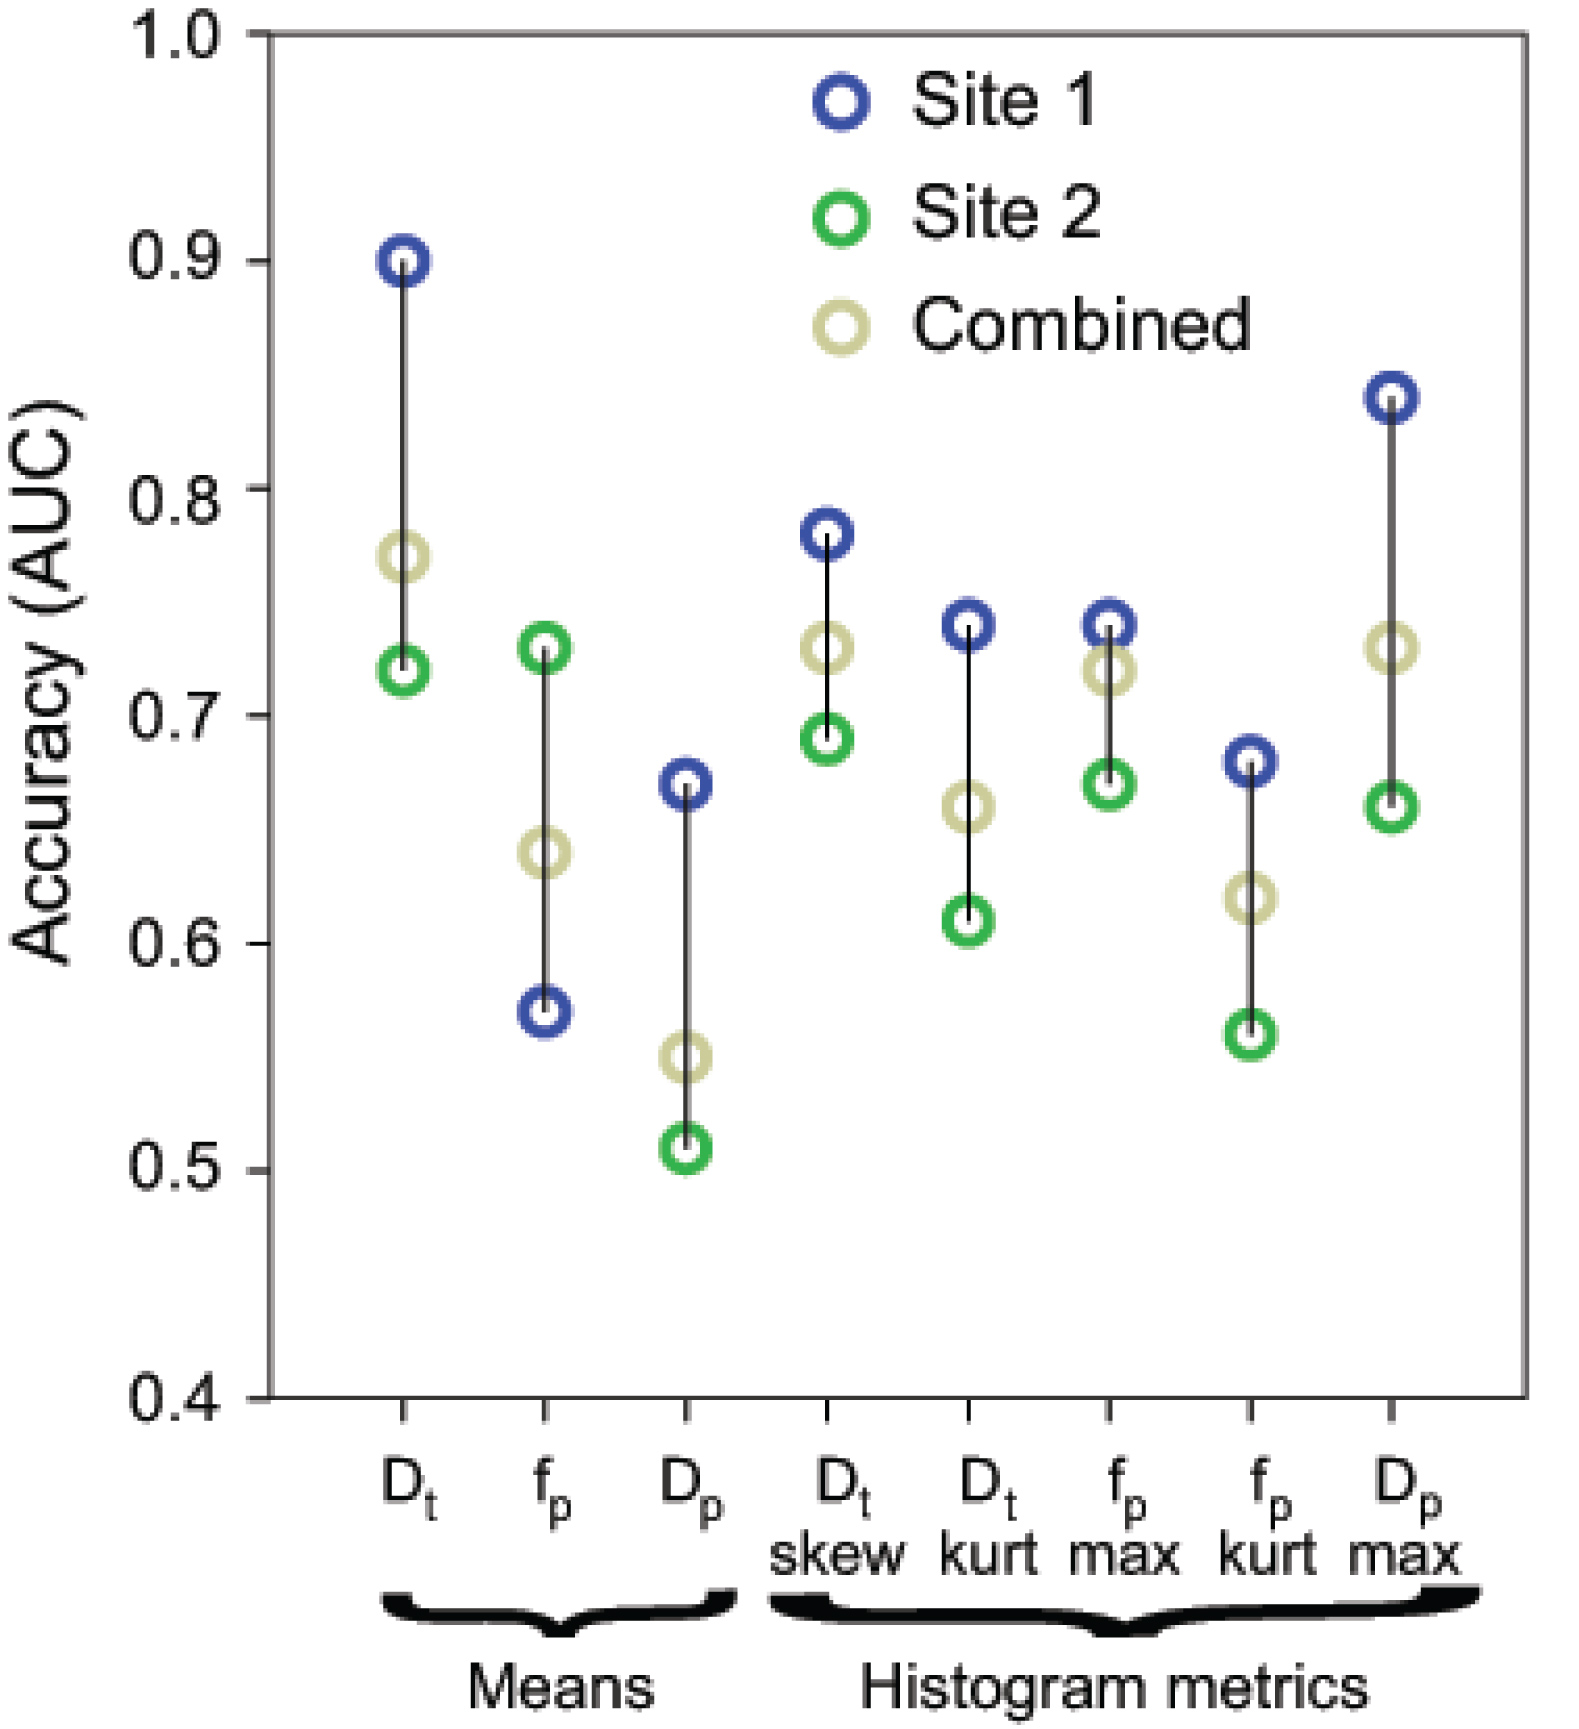
69/132 patients (14 benign, 55 malignant) came from Site 1, while 63/132 patients (12 benign, 51 malignant) from Site 2. Mean Dt from Software 1 significantly differentiated benign/malignant lesions for each site individually and for both sites (combined), while mean fp from Software 1 differentiated only at Site 2 and combined (Table 1). Histogram metrics revealed that Dt kurtosis/skewness, maximum fp, and maximum Dp also displayed significant differentiation in the combined cohort when analyzed by either software. Combination of ADC skewness, Dp kurtosis, Dt kurtosis, maximum fp, and fp skewness resulted in AUC values of 0.861 with a positive predictive value of 100% and a negative predictive value of 47.3% for benign/malignant discrimination of the entire cohort by Software 1. Figure 1 shows parametric maps from the two software and the histogram results for a representative patient. Figure 2 and 3 show dotplots comparing sites and software as well as the diagnostic accuracy using Software 1 for mean Dt, fp, Dt skewness, and fp kurtosis. Histogram parameters show less site variability and higher combined performance than mean values alone (Fig. 4). Each software presents several significant findings when observing all metrics (Software 1 - 9/6/10, Software 2 - 8/5/9 for Site 1/Site 2/Combined).Discussion
This multi-site comparison of IVIM data enables a valuable assessment of the broad use of IVIM biomarkers for breast cancer. Cross-sectional data comparison highlights the robustness of IVIM biomarkers and their histogram metrics across software and platforms. The results of lower Dt/higher fp in malignant lesions5,7-9,11-12 are observed in separate and combined cohorts. Some histogram parameters tend to be more robust than mean values for both software and sites. Moreover, all elements of each software workflow have not been individually matched; such matching may improve software agreement.Conclusion
This study suggests that IVIM biomarkers may have strong potential for translation across site/analysis platforms. Future work will deepen and expand this analysis in pursuit of robust and broad validation of IVIM diagnostic assessment of breast cancer.Acknowledgements
No acknowledgement found.References
[1] Le Bihan D, Breton E, Lallemand D, Aubin ML, Vignaud J, Laval-Jeantet M. Separation of diffusion and perfusion in intravoxel incoherent motion MR imaging. Radiology 1988;168(2):497-505.
[2] Sigmund EE, Cho GY, Kim S, et al. Intravoxel incoherent motion imaging of tumor microenvironment in locally advanced breast cancer. Magn Reson Med 2011;65(5):1437-47.
[3] Thoeny HC, Zumstein D, Simon-Zoula S, et al. Functional evaluation of transplanted kidneys with diffusion-weighted and BOLD MR imaging: initial experience. Radiology 2006;241(3):812-21.
[4] Lemke A, Laun FB, Klauss M, et al. Differentiation of pancreas carcinoma from healthy pancreatic tissue using multiple b-values: comparison of apparent diffusion coefficient and intravoxel incoherent motion derived parameters. Invest Radiol 2009;44(12):769-75.
[5] Cho GY, Moy L, Kim SG, et al. Evaluation of breast cancer using intravoxel incoherent motion (IVIM) histogram analysis: comparison with malignant status, histological subtype, and molecular prognostic factors. Eur Radiol 2016;26(8):2547-58.
[6] Cho GY, Moy L, Zhang JL, et al. Comparison of fitting methods and b-value sampling strategies for intravoxel incoherent motion in breast cancer. Magn Reson Med 2014.
[7] Iima M, Yano K, Kataoka M, et al. Quantitative non-gaussian diffusion and intravoxel incoherent motion magnetic resonance imaging: differentiation of malignant and benign breast lesions. Invest Radiol 2015;50(4):205-11.
[8] Suo S, Lin N, Wang H, et al. Intravoxel incoherent motion diffusion-weighted MR imaging of breast cancer at 3.0 tesla: Comparison of different curve-fitting methods. J Magn Reson Imaging 2015;42(2):362-70.
[9] Bokacheva L, Kaplan JB, Giri DD, et al. Intravoxel incoherent motion diffusion-weighted MRI at 3.0 T differentiates malignant breast lesions from benign lesions and breast parenchyma. J Magn Reson Imaging 2014;40(4):813-23.
[10] Sinha S, Lucas-Quesada FA, Sinha U, DeBruhl N, Bassett LW. In vivo diffusion-weighted MRI of the breast: potential for lesion characterization. J Magn Reson Imaging 2002;15(6):693-704.
[11] ijkstra H, Dorrius MD, Wielema M, et al. Semi-automated quantitative intravoxel incoherent motion analysis and its implementation in breast diffusion-weighted imaging. J Magn Reson Imaging 2016;43(5):1122-31.
[12] Kim Y, Ko K, Kim D, et al. Intravoxel incoherent motion diffusion-weighted MR imaging of breast cancer: association with histopathological features and subtypes. Br J Radiol 2016:20160140.
[13] Wang Q, Guo Y, Zhang J, Wang Z, Huang M, Zhang Y. Contribution of IVIM to Conventional Dynamic Contrast-Enhanced and Diffusion-Weighted MRI in Differentiating Benign from Malignant Breast Masses. Breast Care 2016;11(4):254-8.
[14] Yuan J, Wong OL, Lo GG, Chan HHL, Wong TT, Cheung PSY. Statistical assessment of bi-exponential diffusion weighted imaging signal characteristics induced by intravoxel incoherent motion in malignant breast tumors. Quantitative Imaging in Medicine and Surgery 2016;6(4):418-29.
[15] Lee YJ, Kim SH, Kang BJ, et al. Intravoxel incoherent motion (IVIM)-derived parameters in diffusion-weighted MRI: Associations with prognostic factors in invasive ductal carcinoma. J Magn Reson Imaging 2016: DOI: 10.1002/jmri.25514.
[16] Bedair R, Priest AN, Patterson AJ, et al. Assessment of early treatment response to neoadjuvant chemotherapy in breast cancer using non-mono-exponential diffusion models: a feasibility study comparing the baseline and mid-treatment MRI examinations. Eur Radiol 2016:1-11.
Figures