2126
Quantitative Breast MRI Background Parenchymal Enhancement for Predicting Response to Chemotherapy1University of California, San Francisco, San Francisco, CA, United States, 2University of California, San Francisco
Synopsis
The purpose of this study was to investigate how background parenchymal enhancement (BPE) may additively improve an MR tumor model for prediction of non-pathologic complete response (non-PCR) patients in the neoadjuvant setting. BPE identified 24-36% of non-PCR patients independent of tumor factors while maintaining a low misclassification of PCR patients. In conjunction with a tumor model using tumor and treatment factors, addition of BPE may improve residual cancer prediction of up to 60% of patients, but results were not statistically significant.
Introduction
The ACRIN 6657 trial found that change in MR-measured tumor volume was strongly predictive of pathologic complete response (PCR) in advanced breast cancer patients undergoing neoadjuvant therapy. PCR is a composite measure of microscopic evidence of invasive tumor absent in the breast and axillary lymph nodes in the surgical specimen due to successful neoadjuvant therapy, and is recognized by the FDA as an endpoint for accelerated drug approval. Identifying non-PCR patients with MRI affords the opportunity to redirect therapy and potentially improve recurrence free survival. Background parenchymal enhancement (BPE) represents physiologic uptake of contrast in normal fibroglandular tissue during contrast-enhanced breast MRI. Preliminary studies suggest this may also represent an independent biomarker of response to therapy(1-3). The purpose of this study was to investigate how BPE may additively improve an MR tumor model for prediction of non-PCR patients in the neoadjuvant setting.Methods
In this IRB approved study, 105 patients with locally advanced breast cancer (Stage 2/3) were evaluated with serial breast MRIs to assess neoadjuvant response. Of these, 25 patients had PCR and 80 patients had non-PCR at time of surgery. Four dynamic contrast-enhanced (DCE) MRI scans were acquired for each patient: pre-treatment (V1), after 1 month of neoadjuvant therapy (V2), after 3 months (V3), and pre-surgery (V4). Images were acquired on a 1.5 T or 3.0 T magnet, with DCE sequences optimized for high-spatial-resolution (in-plane spatial resolution, (≤ 1mm) using 3D fat-suppressed T1-weighted gradient-echo sequence with 80-100 second temporal resolution. MRI segmentation and BPE measurement was performed on the contralateral (unaffected) breast. BPE processing was performed by manual parenchymal segmentation using a custom-developed breast segmentation tool programmed in the IDL environment (Exelis Inc., Boulder, CO), and fibroglandular tissue classification with fuzzy c-means clustering(4). BPE was calculated as an average of early enhancement measured for each voxel of fibroglandular tissue, where early enhancement is defined as (S1 – S0)/S0 (S0: signal intensity prior to injection and S1: signal intensity at the first postcontrast acquisition). Logistic regression models were created using relative change of BPE as predictors relative to baseline for each consecutive time point (i.e. V2/V1, V3/V1, V4/V1). A multivariate tumor model excluding BPE was first created using the tumor factors (overall tumor volume change to pre-surgery, tumor receptor HR and HER2 status) and treatment type. The relative benefit was then assessed by inclusion of BPE change predictors to the multivariate model. Diagnostic accuracy was assessed by focusing on the percentage of non-PCR patients identified (or sensitivity) while constraining to a low PCR misclassification rate (1-specificity) set to less than 10%. This constrained misclassification model is being developed for an eventual clinical strategy to redirect therapy in non-responsive patient.Results
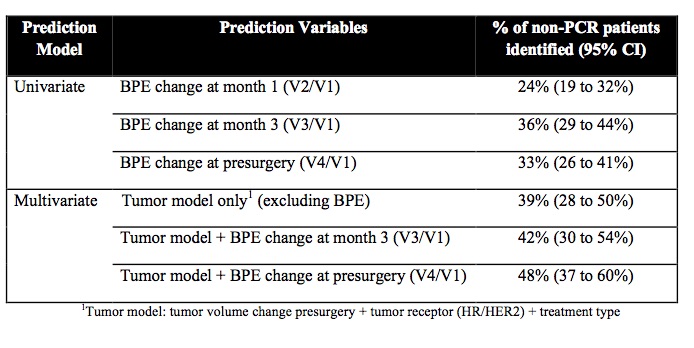
Using the univariate model, BPE change from baseline to month 1 (V2/V1) identified 24% of non-PCR patients (95% CI: 19 to 32%). BPE change to month 3 (V3/V1) identified 36% of non-PCR patients (95% CI: 29 to 44%), and BPE change to pre-surgery (V4/V1) identified 33% of non-PCR patients (95% CI: 26 to 41%). Using a multivariate tumor model excluding BPE, 39% of non-PCR patients were identified (95% CI: 28 to 50%). Addition of BPE change at month 3 (V3/V1) identified 42% of non-PCR patients (95% CI: 30 to 54%), and BPE change at pre-surgery (V4/V1) identified 48% of non-PCR patients (95% CI: 37 to 60%). Addition of BPE to tumor model appears to improve the model, however a high degree of overlap existed with the confidence intervals.Conclusion
BPE identified a significant
number of non-PCR patients independent of tumor factors while maintaining a low
misclassification of PCR patients. In
conjunction with a tumor model using tumor and treatment factors, addition of BPE
may improve residual cancer prediction of up to 60% of patients, but results
were not statistically significant. Future work will continue to verify results in
a larger cohort as well as investigate breast subtype specific prediction.Acknowledgements
This work was supported by an NIH / NIBIB T32 EB001631 training grant.References
1. King V, Goldfarb SB, Brooks JD, et al.: Effect of Aromatase Inhibitors on Background Parenchymal Enhancement and Amount of Fibroglandular Tissue at Breast MR Imaging. Radiology 2012; 264:670–678.
2. Schrading S, Schild H, Kühr M, Kuhl C: Effects of Tamoxifen and Aromatase Inhibitors on Breast Tissue Enhancement in Dynamic Contrast–enhanced Breast MR Imaging: A Longitudinal Intraindividual Cohort Study. Radiology 2014; 271:45–55.
3. Hattangadi J, Park C, Rembert J, et al.: Breast Stromal Enhancement on MRI Is Associated with Response to Neoadjuvant Chemotherapy. American Journal of Roentgenology 2008; 190:1630–1636.
4. Klifa C, Carballido-Gamio J, Wilmes L, et al.: Quantification of breast tissue index from MR data using fuzzy clustering. Conf Proc IEEE Eng Med Biol Soc 2004; 3:1667–1670.
Figures