2123
Ductal carcinoma in situ of the breast: Investigation of quantitative MRI features of lesion and normal tissue to predict recurrence after treatment1Radiology, University of Washington, Seattle, WA, United States, 2Breast Imaging, Seattle Cancer Care Alliance, Seattle, WA, United States
Synopsis
Ductal carcinoma in situ (DCIS) is a pre-invasive breast cancer that may be overtreated due to lack of reliable clinical and pathological prognostic features. Kinetics parameters on dynamic contrast-enhanced MRI have shown promise as breast cancer risk biomarkers. We compared imaging parameters of lesions and normal breast tissue between patients with DCIS recurrence and matched controls and found that patients with larger lesions with higher signal enhancement ratio (SER) and higher background parenchymal enhancement (BPE) on preoperative MRI were more likely to recur. These MRI biomarkers show promise for decreasing DCIS overtreatment and warrant further study in larger cohorts.
Purpose
Ductal carcinoma in situ (DCIS) is a pre-invasive breast cancer that accounts for 17%–34% of cancers detected by screening mammography, with an estimated 61,000 new cases in the US in 2016.1 While some clinical, histologic2 and genetic3 features have been shown to correlate with risk of recurrence, these features are not reliable enough to guide therapies. As a result, the majority of DCIS lesions are treated aggressively due to an inability to differentiate indolent from aggressive disease, leading to overtreatment. Functional breast MRI parameters of lesions and background parenchymal enhancement (BPE) in normal tissue have shown promise as breast cancer risk biomarkers.4-6 However, few studies to date have explored the relationship of such MRI features with meaningful clinical outcomes for DCIS. Therefore, we aimed to assess whether preoperative MRI features can predict DCIS recurrence after treatment.Methods
In this IRB approved, HIPAA compliant study, we retrospectively identified all patients diagnosed with pure DCIS who underwent preoperative MRI from 2004 through 2013 and had an ipsilateral recurrence (defined as a new diagnosis of DCIS or invasive breast cancer) at least 6 months after definitive surgical treatment. For each index case, a DCIS control patient who did not recur was identified, rigorously matched on multiple clinical (age $$$\pm$$$ 4 years; BRCA status; menopausal status; prior chemoprevention), Van Nuys Pathologic Grade (nuclear grade/comedonecrosis), estrogen receptor status, final surgical margins in accordance with the Van Nuys Prognostic Index7 classification (widely free margins $$$\geq$$$10mm, intermediate margins of 1-9 mm, and involved or close margins <1 mm), endocrine therapy, and radiation therapy. Preoperative MRI scans were performed at 1.5T or 3T using a dedicated breast coil and imaging protocol in accordance with American Colleges of Radiology breast MRI guidelines, which included a T1-weighted, fat-suppressed dynamic contrast-enhanced MRI sequence. 3D quantitative MRI features were assessed for lesion and ipsilateral normal breast tissue using in-house, semiautomatic software tools.8,9 Enhancement kinetics were calculated for lesion voxels that demonstrated ≥50% increase in signal from pre-contrast to first post-contrast images, and included percent enhancement (PE) (eq.1)and SER (eq.2): $$$PE = \frac{SI_1-SI_0}{SI_0} × 100$$$ (eq.1), $$$SER = \frac{SI_1-SI_0}{SI_2-SI_0} × 100$$$ (eq.2), where SI0, SI1 and SI2 are the signal intensities for the pre-contrast, ~2 min initial post contrast, and $$$\geq$$$4.5 min delayed post contrast images, respectively. Functional volume was calculated as the sum of all lesion voxels with PE $$$\geq$$$50%, and washout fraction was defined as the percentage of lesion voxels with SER $$$\geq$$$1.1. BPE maps were generated for the normal tissue at varying PE thresholds (5-50%) (eq.1). Quantitative normal tissue features of BPE volume and BPE mean were calculated by summing the volume or averaging the percent enhancements of each voxel of the BPE map, respectively. Mammographic breast density was also recorded. Differences in lesion and BPE features between the DCIS recurrence and control cohorts were evaluated by Wilcoxon signed rank test or Pearson’s chi-squared test, and an optimal enhancement threshold for BPE metrics was identified based on areas under the receiver operator characteristic curve (AUCs).Results
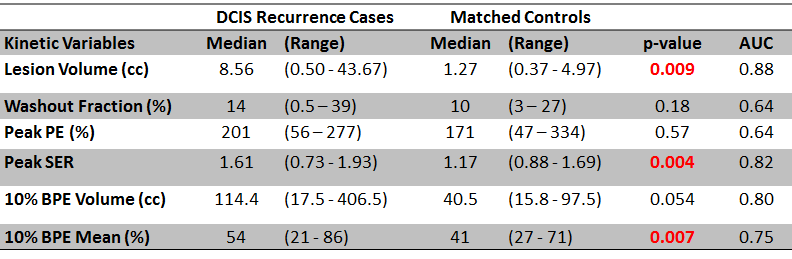
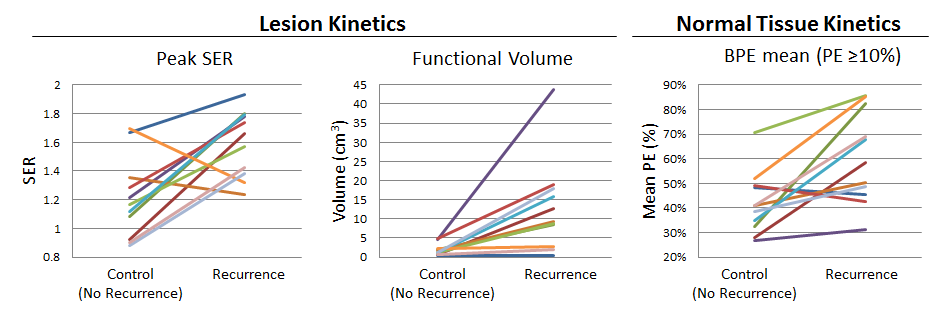
Recurrences were identified in 14/415 (3.4%) women with pure DCIS who underwent preoperative MRI during the study timeframe. Due to the rigorous matching criteria, matched controls could not be identified for 3/14 cases. Thus, a total of 22 patients (11 with and 11 without ipsilateral recurrence) were included. For the 11 included recurrence cases, median age was 46 (range: 33-78) years and median time to recurrence was 14 (6-60) months. Median follow-up time for control cases was 92 (42-130) months. Compared to the matched controls, DCIS recurrence cases exhibited significantly (p < 0.05) higher lesion peak SER, lesion volume, and BPE mean on preoperative MRI, Table 1 and Figure 1. A 10% PE threshold was observed to optimize model performance for BPE metrics. Mammographic density was not significantly different between recurrence cases and their matched controls (p = 0.34).Conclusions
DCIS recurrence after treatment was a rare event in this patient population, in keeping with general concerns of overtreatment. Women who did experience a recurrence had DCIS lesions that demonstrated a larger volume on DCE MRI with higher levels of SER than women who did not recur, suggesting functional MRI measurements of size and vascularity have prognostic value. Furthermore, women who recurred also demonstrated increased enhancement (BPE) in surrounding normal tissue than those women who did not, suggesting MRI can identify normal tissue environments that are more likely to promote recurrence after treatment. These findings suggest that MRI biomarkers are promising for use to decrease DCIS overtreatment and warrant further study in larger cohorts.Acknowledgements
This research was supported by a RSNA Research Scholar Grant (Rahbar), an ISMRM 2013-2014 Seed Grant, and a gift from the Safeway Foundation.References
1. American Cancer Society. Breast Cancer Facts and Figures 2015-2016. Atlanta, GA: American Cancer Society, 2015.
2. Rudloff U, et al. Nomogram for Predicting the Risk of Local Recurrence After Breast-Conserving Surgery for Ductal Carcinoma In Situ. J Clin Oncol 2010, Aug 10; 29(23): 3762-9.
3. Solin LJ, et al. A multigene expression assay to predict local recurrence risk for ductal carcinoma in situ of the breast. J Natl Cancer Inst 2013, May 15; 105(10):701-10.
4. Li H, et al. MR Imaging Radiomics Signatures for Predicting the Risk of Breast Cancer Recurrence as Given by Research Versions of MammaPrint, Oncotype DX, and PAM50 Gene Assays. Radiology. 2016 Nov;281(2):382-391.
5. Dontchos BN, et al. Are Qualitative Assessments of Background Parenchymal Enhancement, Amount of Fibroglandular Tissue on MR Images, and Mammographic Density Associated with Breast Cancer Risk? Radiology 2015, Aug; 276(2):371-80.
6. Kim SA, et al. Background parenchymal signal enhancement ratio at preoperative MR imaging: association with subsequent local recurrence in patients with ductal carcinoma in situ after breast conservation surgery. Radiology 2014 Mar; 270(3):699-707.
7. Kelley L, et al. Analyzing the Risk of Recurrence after Mastectomy for DCIS: A New Use for the USC/Van Nuys Prognostic Index. Ann Surg Oncol 2011; 18:459–462.
8. Partridge SC, et al. Association Between Serial Dynamic Contrast-Enhanced MRI and Dynamic 18F-FDG PET Measures in Patients Undergoing Neoadjuvant Chemotherapy for Locally Advanced Breast Cancer. J Magn Reson Imaging 2010 Nov;32(5):1124-31.
9. Liu CL, et al. Optimization of Quantitative MRI Background Parenchymal Enhancement Metrics to Predict Breast Cancer Risk. Presented at International Society of Magnetic Resonance in Medicine (ISMRM) Annual Meeting, June 2015.
Figures