2117
Dynamic contrast-enhanced magnetic resonance imaging in discriminating invasive ductal carcinoma and fibroadenoma: 2D maximum diameter versus 3D whole-tumor1Department of Diagnostic Radiology, the First Affiliated Hospital of Xi’an Jiaotong University, Xi'an, Shaanxi, People's Republic of China
Synopsis
DCE quantitative measurement plays an important role in the identification of breast tumors. However, different ROI placement can directly affect the inspection results. However, there is no clear standard protocol for clinical routine use. This study aims to evaluate the effect of 2-dimensional maximum diameter (2DMD) and 3-dimensional whole-tumor (3DWT) on quantitative DCE-MRI in differentiating invasive ductal carcinoma (IDC) and breast fibroadenoma which are confirmed by surgical pathology, and determined the more efficient approach for ROI measurement. Our results suggested that 2DMD mean value has more diagnostic performance than 3DWT assessment in distinguishing IDC from fibroadenoma.
Introduction
It is widely recognized that the 3-dimensional whole-tumor (3DWT) analysis method has potential of better revealing intratumoral heterogeneity, and could be used for prediction of pathologic responses to neoadjuvant chemotherapy[1,2]. However, previous methods especially the 2-dimensional maximum diameter (2DMD) which usually excluded the necrotic and cystic still are the most often selected methods used in daily practice of breast dynamic contrast-enhancement magnetic resonance imaging (DCE-MRI) analysis[3]. However, there is no clear standard protocol in terms of repeatability as well as practicability. Thus, the objective of this study is to evaluate the effect of the two methods on quantitative DCE-MRI in differentiating invasive ductal carcinoma (IDC) and breast fibroadenoma, and determined the efficient approach for ROI measurement.Methods
The study was approved by the Ethics Committee and informed consents were obtained from all participants. 83 surgical pathologically confirmed breast cancer patients underwent DCE-MRI. All the MRI examinations were performed on a 3.0T MRI scanner (Signa HDXT, GE Healthcare, Milwaukee, USA) with a 8-channel breast coil. DCE-MRIs were acquired by T1 weighted fast spoiled gradient echo sequence (TR/TE, 4.4ms/2.1ms; FA, 15°; slice thickness, 5mm; FOV, 350mm; matrix, 416×320). Data analysis 2DMD and 3DWT were used for ROIs measurements. 2-dimensional (2D) mean value of DCE-MRI parameters (Ktrans, ve and kep ) and their 3-dimensional (3D) histogram metrics (skewness, kurtosis, median, variance, entropy and energy) were calculated by commercially Omni-Kinetics2.0(GE Healthcare, China) and Matlab softwares, respectively. All metrics were assessed by Wilcoxon rank-sum test. Bland-Altman plots were generated to define mean difference and 95% limits of agreement. The areas under the receiver operating characteristic curves (AUCs) of all metrics were further compared by non-parametric test.Results
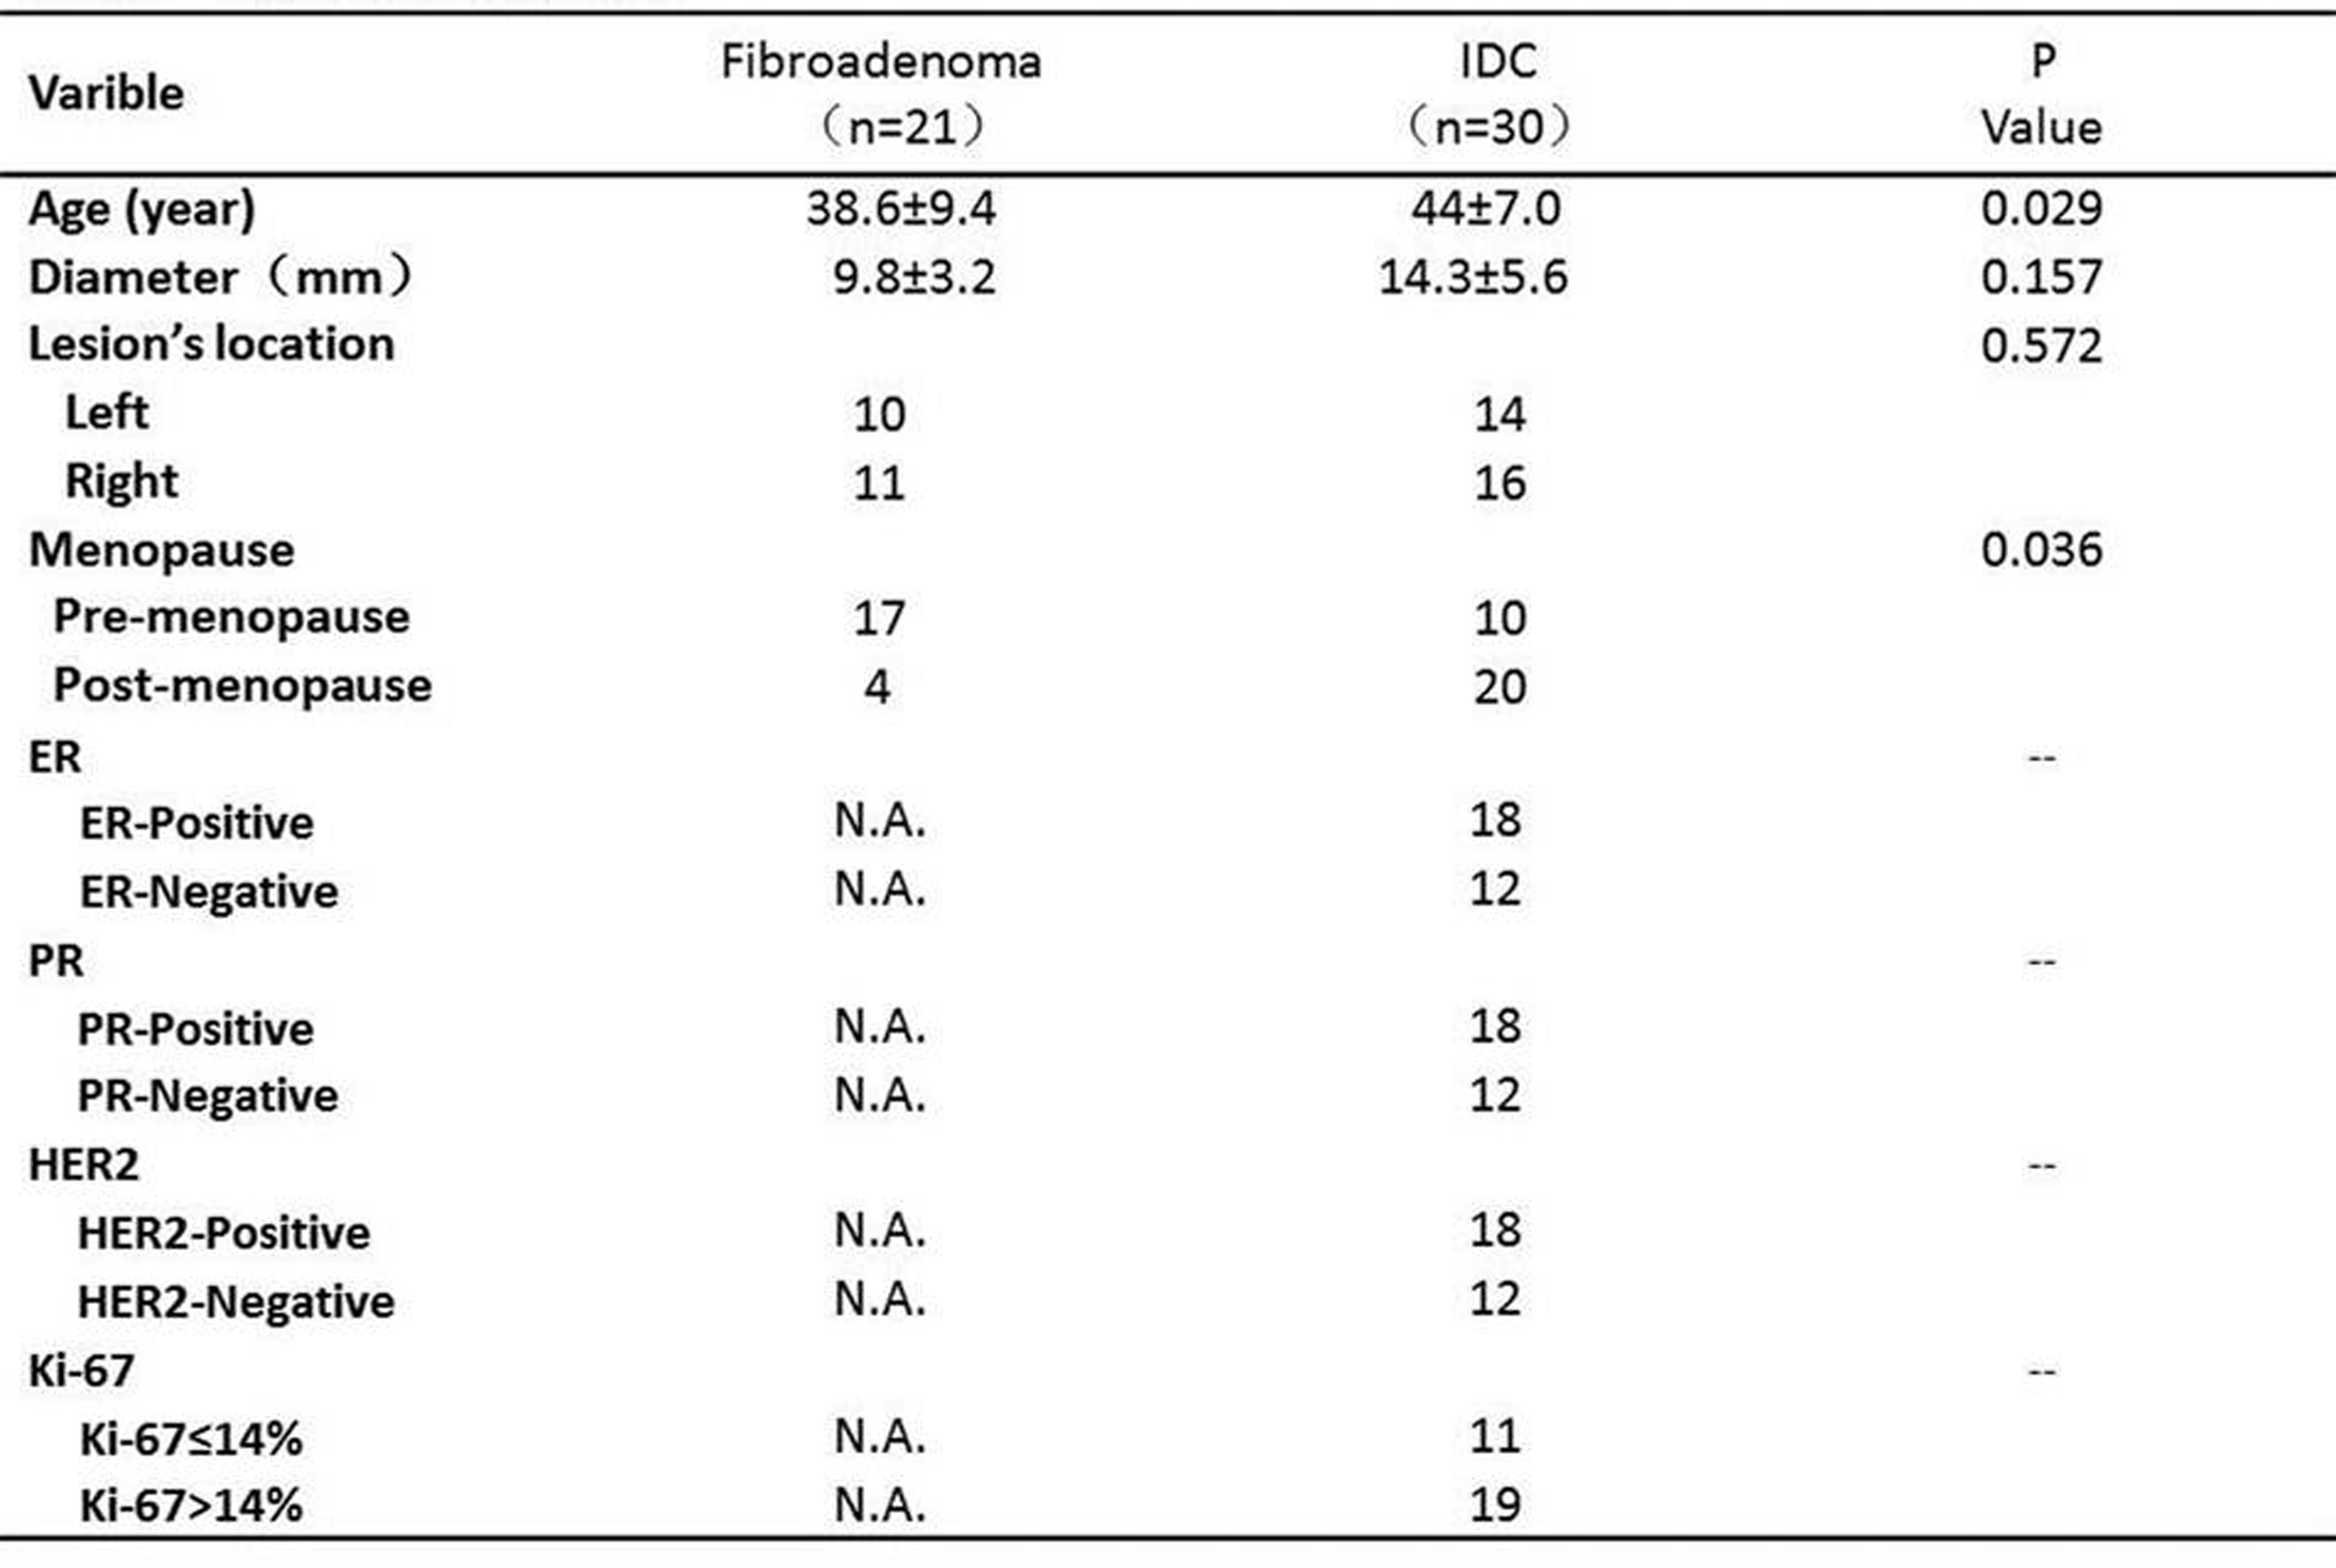
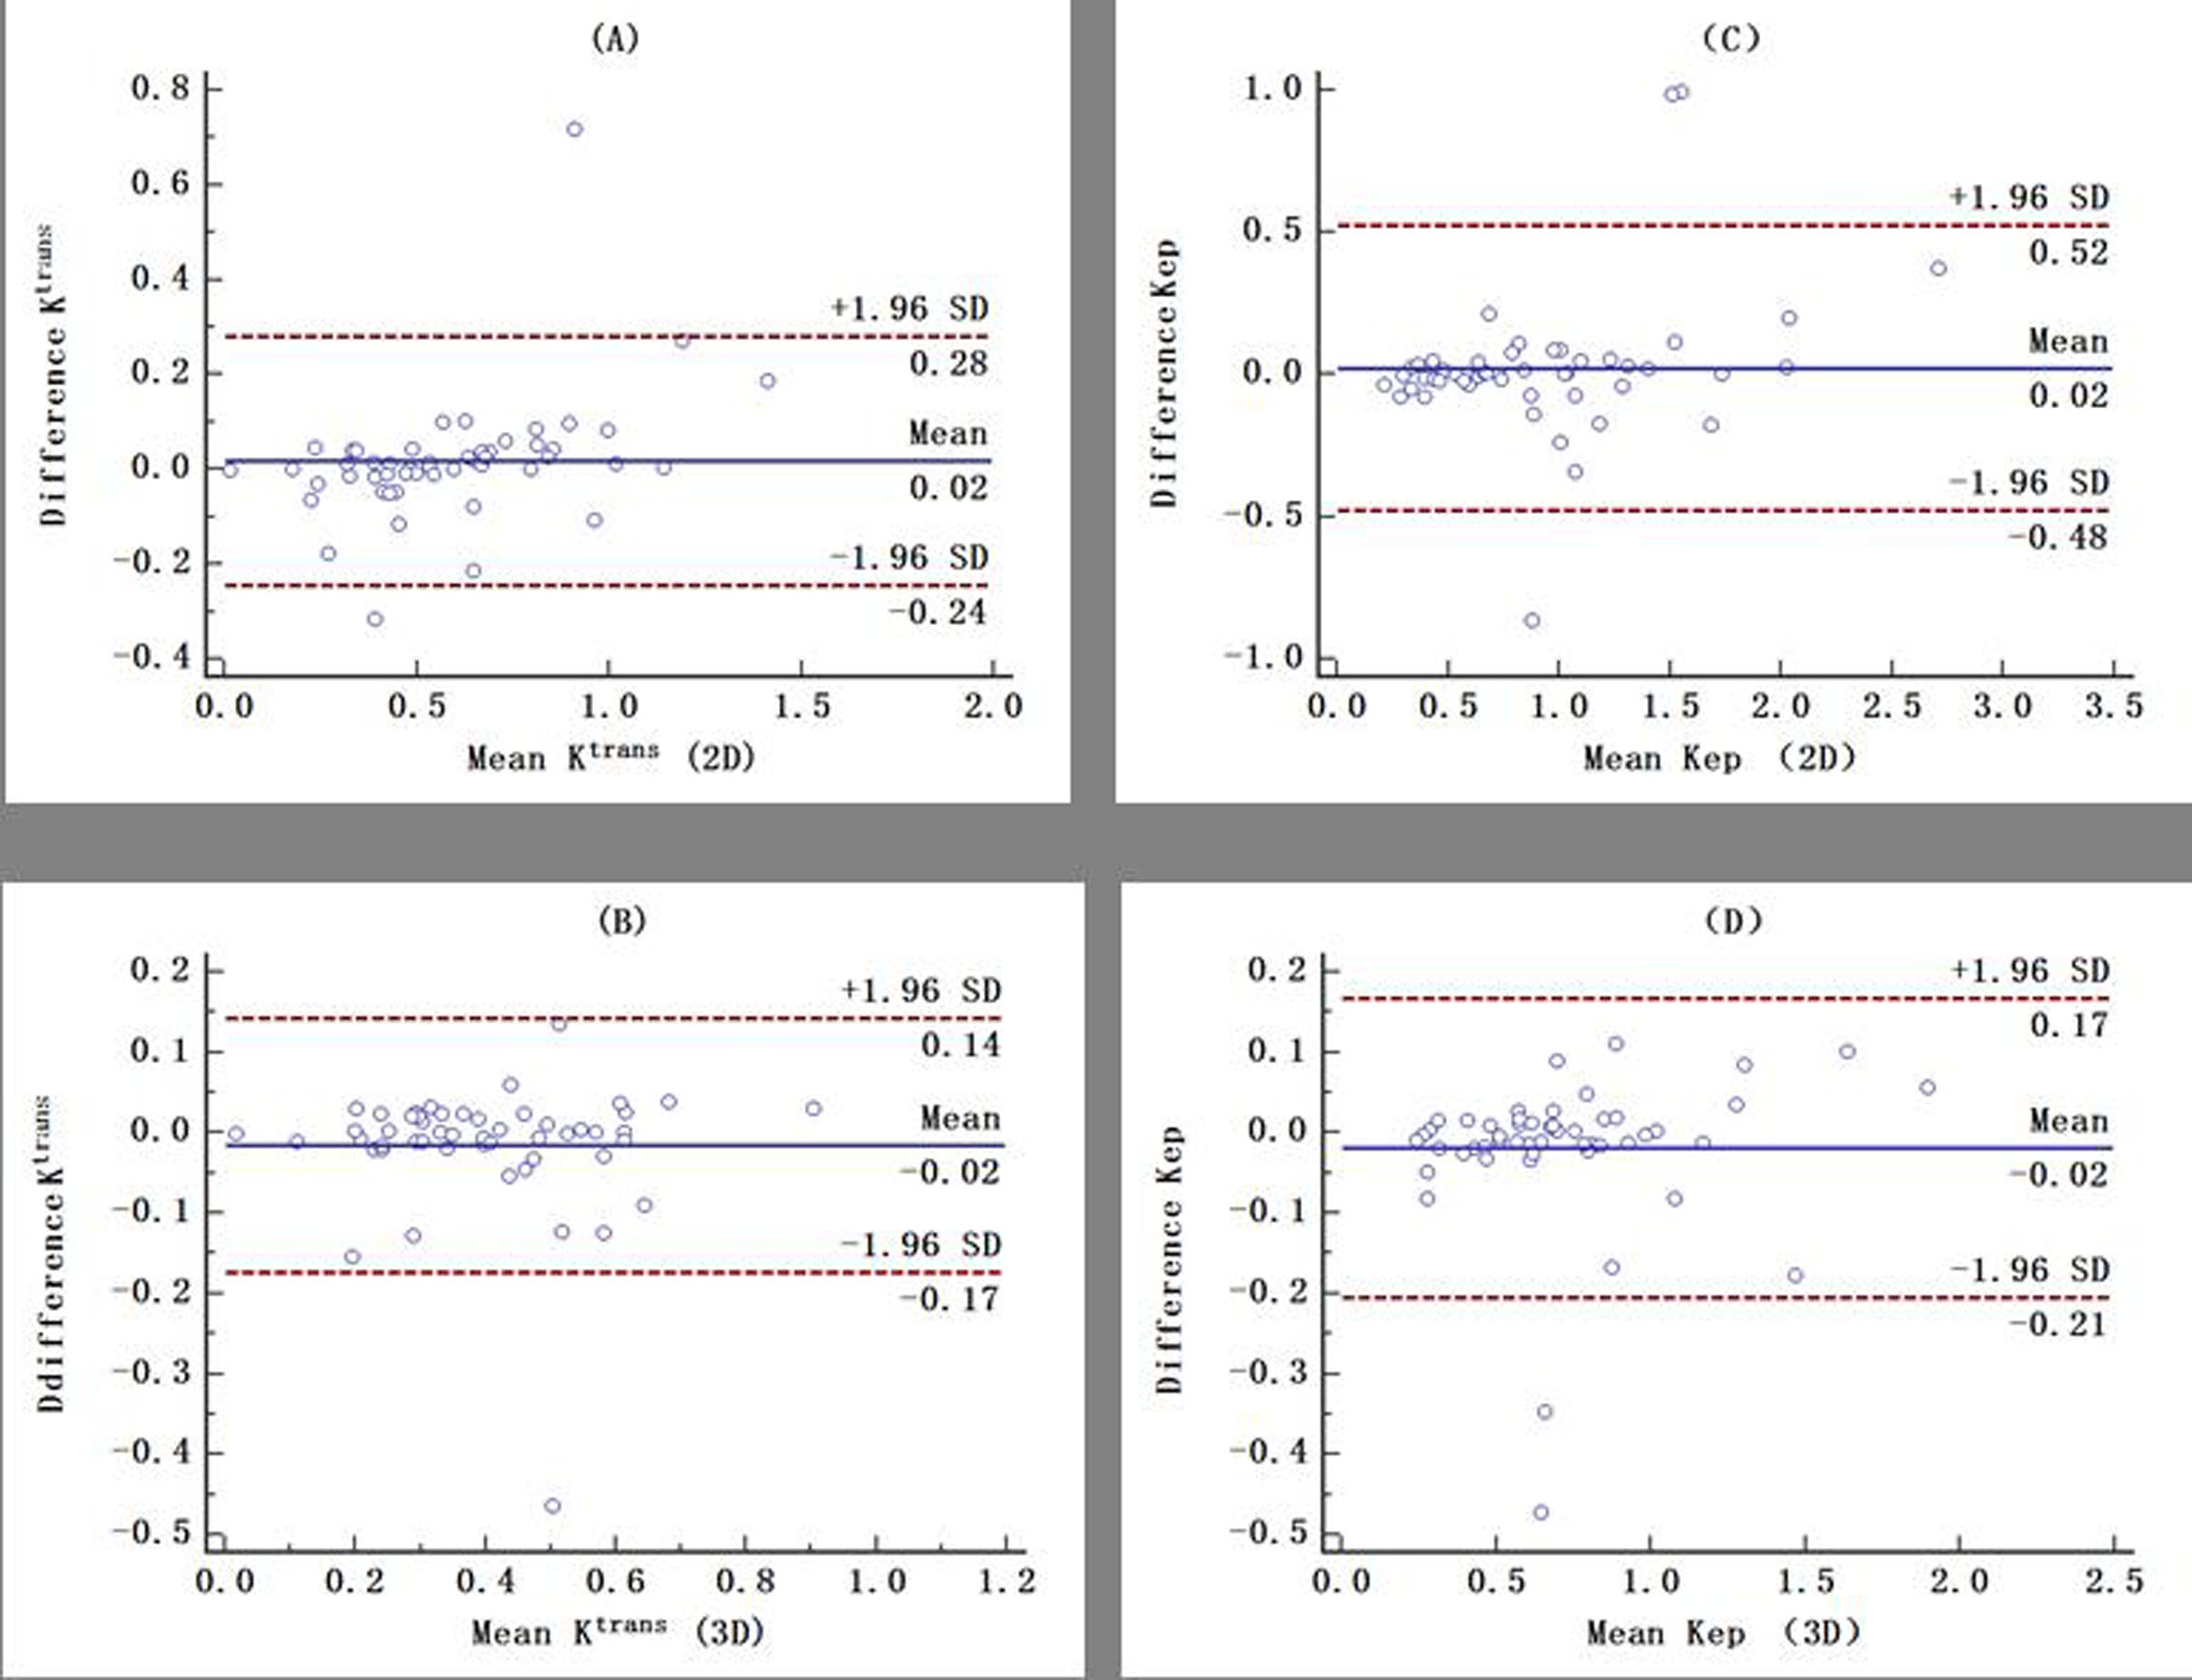
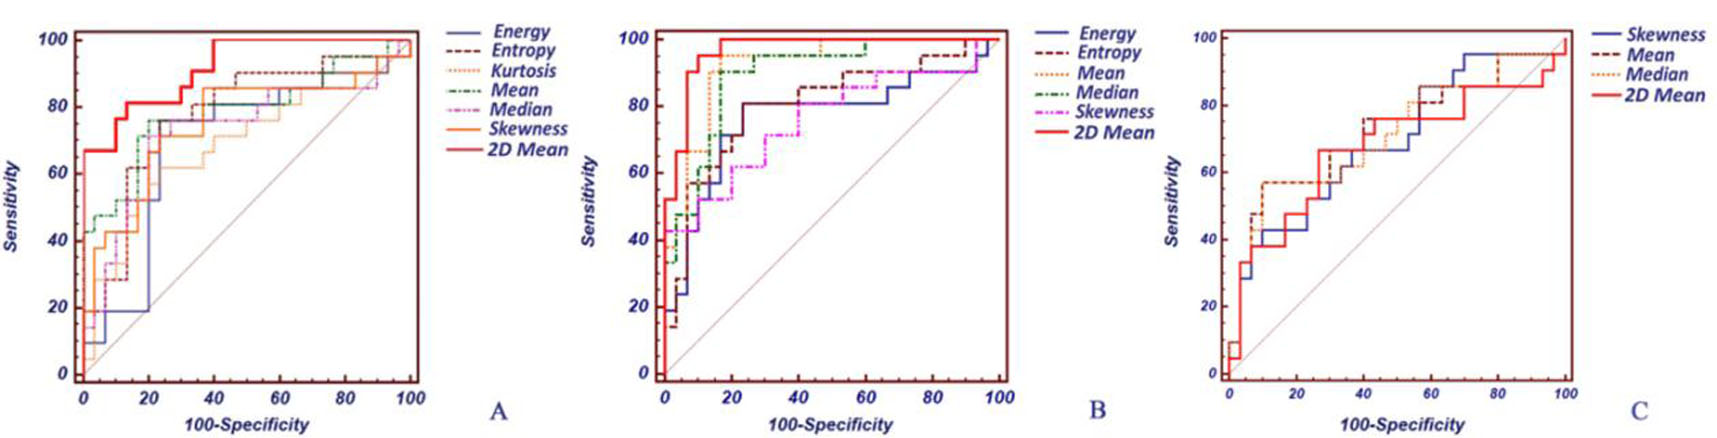
The 51 patients (21 fibroadenoma, mean age of 38.6 years old, range 23~49 years; 30 IDC, mean age of 44 years old, range 31~78 years) were finally recruited in this study. No significant differences were observed between fibroadenoma and IDC groups in terms of mean tumor’s maximal diameter, and lesion location (Table 1). Bland-Altman analysis revealed a good agreement for 2D and 3D ROI on measuring means of Ktrans and Kep values (Figure 1). Of the compassion between 2D and 3D methods, the AUC of 2D mean value was higher than all the 3D histogram parameters for the Ktrans (pmax=0.021). For AUC of kep, the AUC of 2D mean value was also higher than the 3DWT histogram metrics (energy, entropy and skewness) (pmax<0.05) (Figure 2).Discussion
This study demonstrated that different placement of ROI in the quantification of DCE-MRI substantially influence diagnostic value of parameters estimation, and the 2DMD ROI placement is more valuable than 3DWT ROI in identifying IDC from fibroadenoma. Previous study indicated that Ktrans and kep were significantly higher for IDC versus fibroadenoma.4 In comparison to fibroadenoma, IDC contains more necrosis and cystic components. And meanwhile, it is well known that the 3DMT analysis method covering the entire tumor which contains more necrosis and cystic and could cause the decrease of Ktrans values .5Thus, the difference of Ktrans and kep between IDC and fibroadenoma will shrink, and then explain our results.Conclusion
In breast DCE-MRI, 2DMD mean value has more diagnostic performance than 3DWT assessment in distinguishing IDC from fibroadenoma, which should be widely used in clinical routine practice.Acknowledgements
This work was supported by the National Key Research and Development Program of China (2016YFC0100300), National Natural Science Foundation of China (No.81171317, 81471631), and the 2011 New Century Excellent Talent Support Plan of the Ministry of Education, China (NCET-11-0438).References
1. Suo S, Zhang K, Cao M, et al. Characterization of breast masses as benign or malignant at 3.0 T MRI with whole-lesion histogram analysis of the apparent diffusion coefficient[J]. Journal of MagneticResonance Imaging, 2015. Iima M, Le Bihan D, Okumura R, et al. Apparent diffusion coefficient as an MR imaging biomarker of low-risk ductal carcinoma in situ: a pilot study. Radiology, 2011, 260(2): 364-372.
2. Cho N, Im S, Park I, et al. Breast Cancer: Early Prediction of Response to Neoadjuvant Chemotherapy Using Parametric Response Maps for MR Imaging[J]. Radiology, 2014, 272(2): 385-396.
3. Ko E S, Han B K, Kim R B, et al. Apparent Diffusion Coefficient in Estrogen Receptor–Positive Invasive Ductal Breast Carcinoma: Correlations with Tumor-Stroma Ratio[J]. Radiology, 2013, 271(1): 30-37.
4. Hirano M, Satake H, Ishigaki S, et al. Diffusion-weighted imaging of breast masses: comparison of diagnostic performance using various apparent diffusion coefficient parameters[J]. American Journal of Roentgenology, 2012, 198(3): 717-722.
5. Cai K, Xu H N, Singh A, et al. Breast cancer redox heterogeneity detectable with chemical exchange saturation transfer (CEST) MRI. Mol Imaging Biol, 2014, 16(5): 670-679.
Figures