2114
Application of Whole-lesion Histogram Analysis of Pharmacokinetic Parameters in Dynamic Contrast-Enhanced MR Imaging of Breast lesions with CAIPIRINHA-Dixon-TWIST-VIBE TechniqueYiqi Hu1, Tao Ai1, Xu Yan2, Dominik Nickel3, and Liming Xia1
1Radiology, Tongji Hospital, Wuhan, People's Republic of China, 2MR Collaboration NE Asia, Siemens Healthcare, 3MR Collaboration, Siemens Healthcare
Synopsis
As the use of neoadjuvant chemotherapy is gradually increased in the treatment of breast cancer, evaluating its therapeutic effect is gaining importance. However, tumors are markedly heterogeneous in cells, micro-environmental factors and vasculature structures, which manifests as radiologic heterogeneity. A few studies have been trying to extract heterogeneity metrics from regions of interest (ROIs) such as by means of histogram analysis. Thus, the aim of our study is to investigate the feasibility of whole-lesion histogram analysis of pharmacokinetic parameters in breast T1-weighted dynamic contrast-enhanced MR imaging (DCE-MRI) for differentiating the malignant from benign breast lesions.
Purpose
To investigate the feasibility of whole-lesion histogram analysis of pharmacokinetic parameters in breast T1-weighted dynamic contrast-enhanced MR imaging (DCE-MRI) for differentiating the malignant from benign breast lesions.Method
92 patients with 97 breast lesions (26 benign and 71 malignant) were enrolled in this retrospective study with their informed consent. Patients underwent dynamic breast imaging at 3T MR (Siemens, Healthcare) with a prototype CAIPIRINHA-Dixon-Twist-Vibe (CDT-VIBE) technique and subsequently confirmed by histopathologic results. The imaging protocol included 1 min 05 s for T1 mapping (FA = 2 and 14 degree, respectively) and 6 min 58 s for DCE MR imaging (35 phases X 11s). The detailed imaging parameters included TR = 5.4ms, TE = 2.46/3.69ms, FA = 9 degree, FOV = 320 mm, matrix = 320 X 320,slice thickness = 1.5mm. In addition, a contrast medium (Omniscan, GE Healthcare) was administrated at the beginning of the fourth phase of the DCE sequence, via a power injector (0.1 mmol/kg body-weight). Ktrans (volume transfer constant between plasma and EES), kep (constant flux rate between EES and plasma) and ve (EES volume per unit volume of tissue) were then calculated using the functional tissue 4D software (Fig.1). The cumulative histogram parameters of pharmacokinetic parameters including mean value, 25th/50th/75th/90th percentiles, skewness and kurtosis were extracted. Single-sample K-S test, paired t-test with Bonferroni correction and receiver operating characteristic curve (ROC) analysis were used for statistical analysis.Results and discussion
Malignant breast lesions had significantly higher Ktrans, kep and lower ve in mean value, and 25th/50th/75th/90th percentiles with higher skewness of ve than those of benign lesions (all P < 0.05; Table 1). These results demonstrated that most histogram parameters can differentiate malignant from benign breast lesions. For diagnostic accuracy, the results of ROC analysis were shown in Table 2. These results demonstrated that the 90th percentile of Ktrans and kep, and the 50th percentile of ve had the greatest area under receiver operating characteristic curve (AUC) than the other histogram-derived values. It indicates that the 90th percentile of pharmacokinetic parameters of Ktrans and kep has better diagnostic performance for the differentiation of the breast lesions; and may be more closely related to the angiogenesis and aggression of the breast carcinoma. In addition, the 90th percentile of kep achieved the highest AUC value (0.927) among the all histogram-derived values. However, the results showed no significant differences in skewness values of Ktrans and kep between the malignant and benign breast lesions (all P > 0.05). And there were no significant differences in kurtosis values for all three metrics between the malignant and benign breast lesions (all P > 0.05).Conclusions
The whole-lesion histogram analysis of pharmacokinetic parameters can improve the diagnostic accuracy of breast DCE-MRI imaging with CDT-VIBE technique. The 90th percentile of kep may be the best indicator in the differentiation of malignant and benign breast lesions.Acknowledgements
No acknowledgement found.References
No reference found.Figures
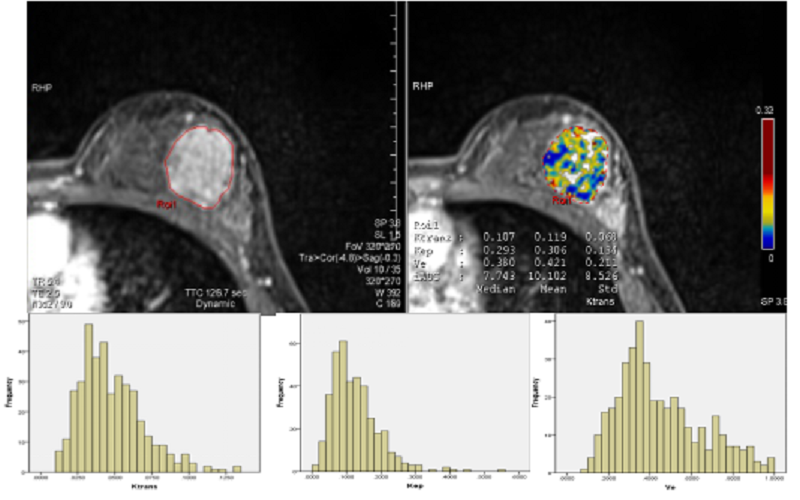
Figure1.The upper-line images are contrast-enhanced image and magnified pseudocolor map. The lower-line images are histograms of pharmacokinetic parameters (Ktrans, kep and ve respectively).
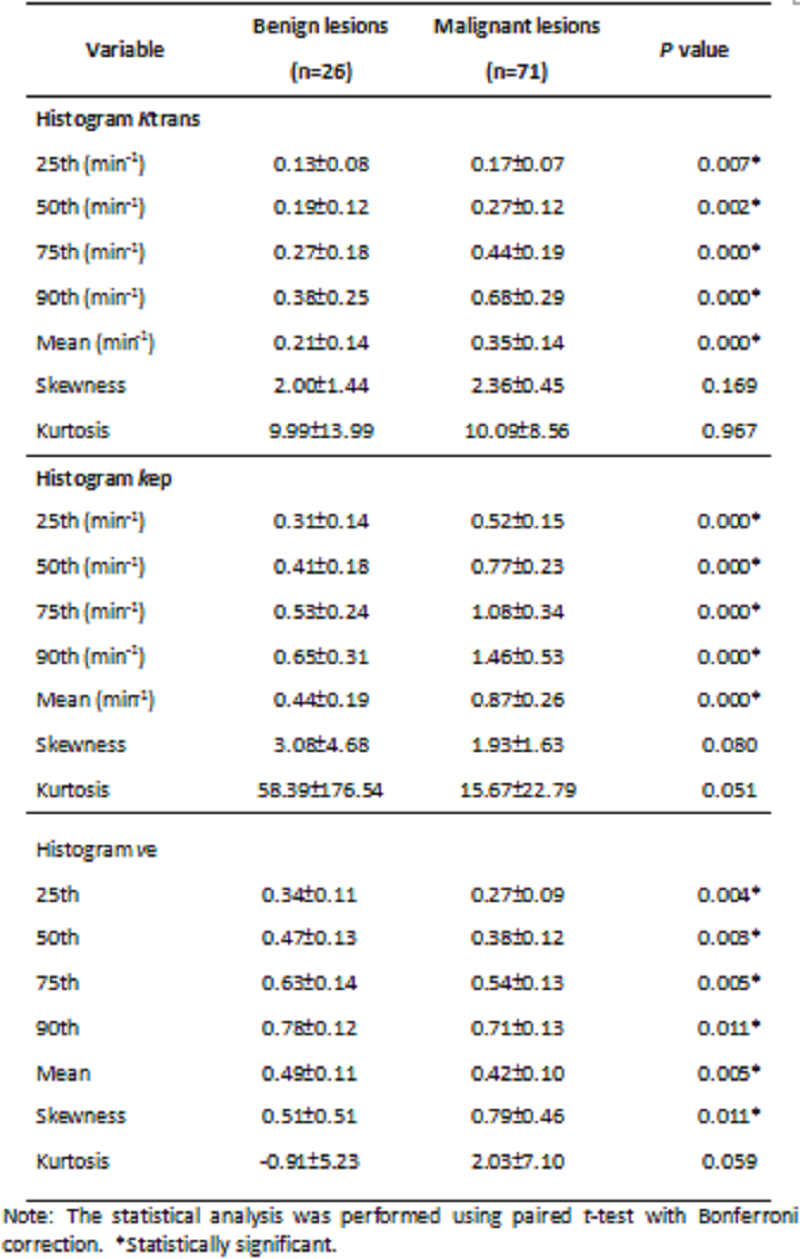
Table 1. Histogram derived parameters (Mean ± SD) for the breast lesions.
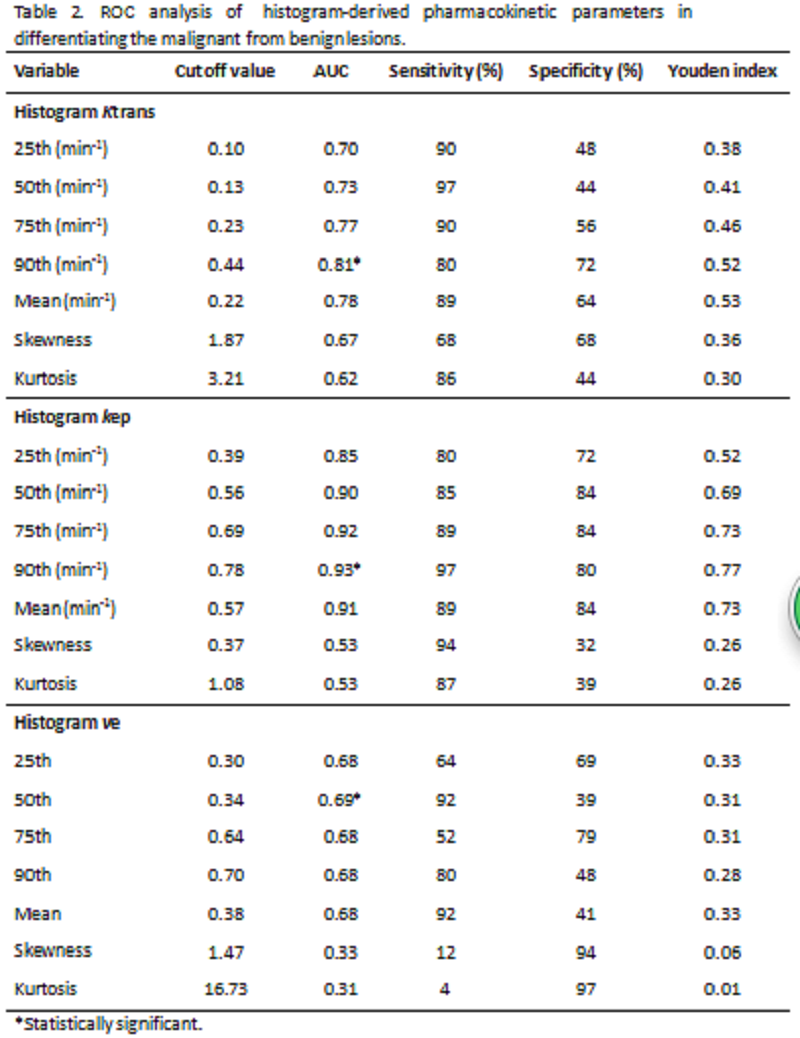
Table 2. ROC analysis of histogram-derived pharmacokinetic parameters in differentiating the malignant from benign lesions.