2113
T2 Relaxation Times of Breast Fibroglandular Tissue Measured From High Resolution, Non-Fat Saturated MR Imaging1Radiology, Memorial Sloan Kettering Cancer Center, New York, NY, United States
Synopsis
Reported T2 values in breast tissue are sparse and often disagree. In this study we estimate the T2 relaxation time of fibroglandular breast tissue including fatty compartments intermixed within the fibroglandular matrix. T2 mapping was performed at high spatial resolution for 15 patients at 3T with 4 TEs from 12 to 160 ms and intra- and inter-patient T2 heterogeneity were evaluated. T2 within the finroglandular environment is on the order of 100 ms with a mean standard deviation per patient of 29.6 ms. We hypothesize that this heterogeneity may reflect differences in the fibroglandular microenvironment related to breast cancer risk.
Introduction
T2 mapping is not routinely performed in the breast. Literature on T2 times in breast tissue is sparse and reported values disagree1-3. To our knowledge, all recent studies of T2 in breast tissue have employed some form of fat saturation. This leads to overestimation of fibroglandular volume, propagation of inhomogeneity/error in fat saturation to calculated T2 and loss of information regarding the role of fat in the fibroglandular microenvironment. The purpose of the current study is to estimate the T2 relaxation time of fibroglandular breast tissue including fatty compartments intermixed within the fibroglandular matrix and evaluate intra- and inter-patient T2 heterogeneity.Methods
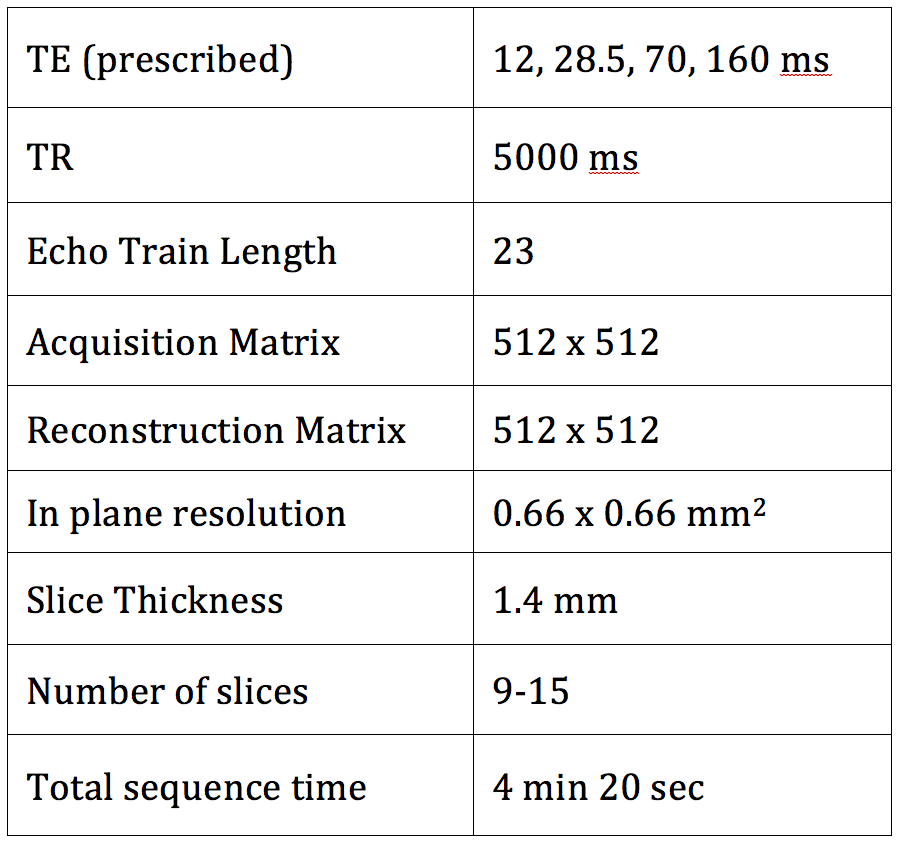
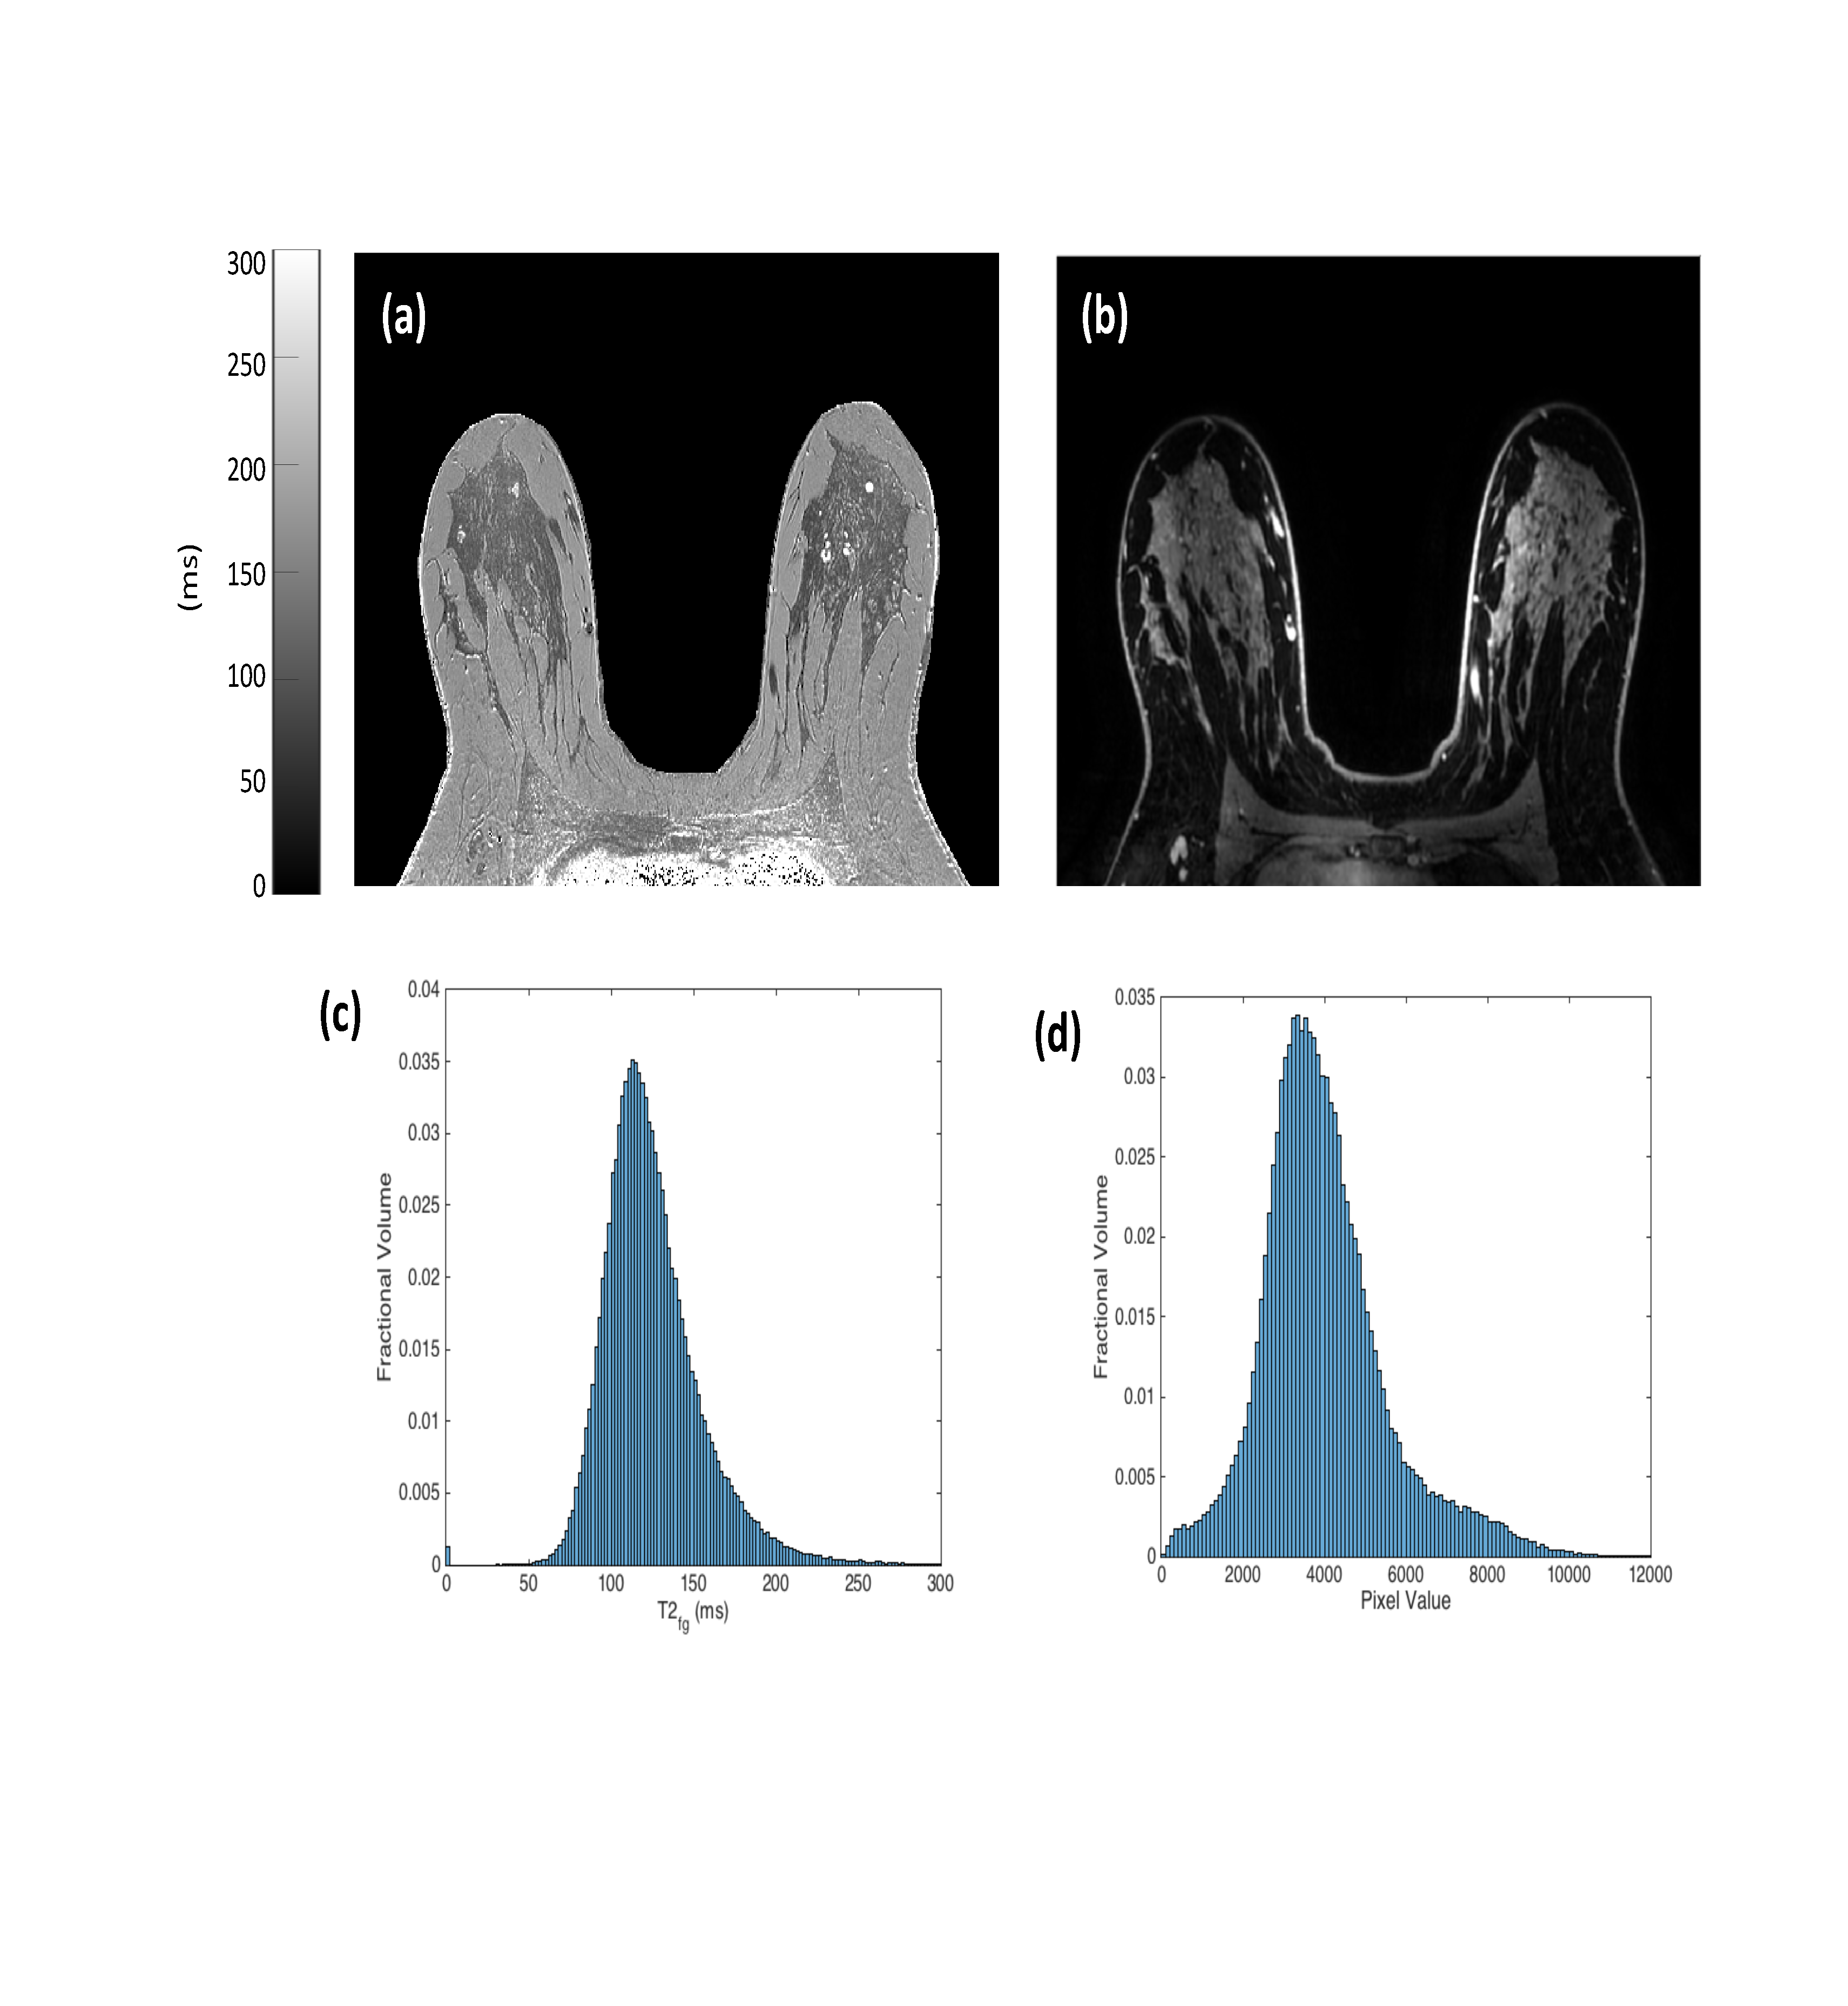
15 patients undergoing a clinical breast MRI exam at our institution including a T2 mapping sequence were included in this IRB-approved and HIPAA-compliant study. All scans were performed on a 3T GE Discovery MR750 scanner (GE Healthcare, Waukesha, WI, USA) with a dedicated 8- or 16-channel breast coil. The T2 mapping protocol was performed before the administration of intravenous contrast and consisted of 4 back–to-back, single echo, fast spin echo sequences without any shimming or tuning and matching between sequences (Table 1). Images were acquired at high resolution (0.66 x 0.66 mm2 in-plane) without fat saturation. Full, volumetric segmentation of the breast fibroglandular tissue was performed for each patient by a breast imaging radiologist. Segmentations were generated semi-automatically using a combination of the TE=160 ms T2-weighted image acquired during the mapping protocol and a fat-saturated T1-weighted, post-contrast image acquired between 30-60 seconds after the administration of intravenous gadolinium.
Volumetric segmentations of breast pathology
(benign or malignant) were performed. When present these segmentations were dilated
and subtracted from the patient’s fibroglandular tissue volume. Regions of
interest (ROIs) were also drawn encompassing homogenous regions of fat outside
of the fibroglandular matrix where no vasculature or connective tissue was
visible. These fat ROIs were drawn on both breasts and on multiple slices
throughout the segmented volume. Patient motion was assumed to be negligible
during the T2 map imaging acquisition, based on visual evaluation. T2
relaxation time was then calculated on a pixel-wise basis according to $$$S(TE)=S_0exp(-TE/T2)$$$
and measured within the fibroglandular tissue
(T2fg) and within the homogenous fat ROIs (T2fat). Intra-patient
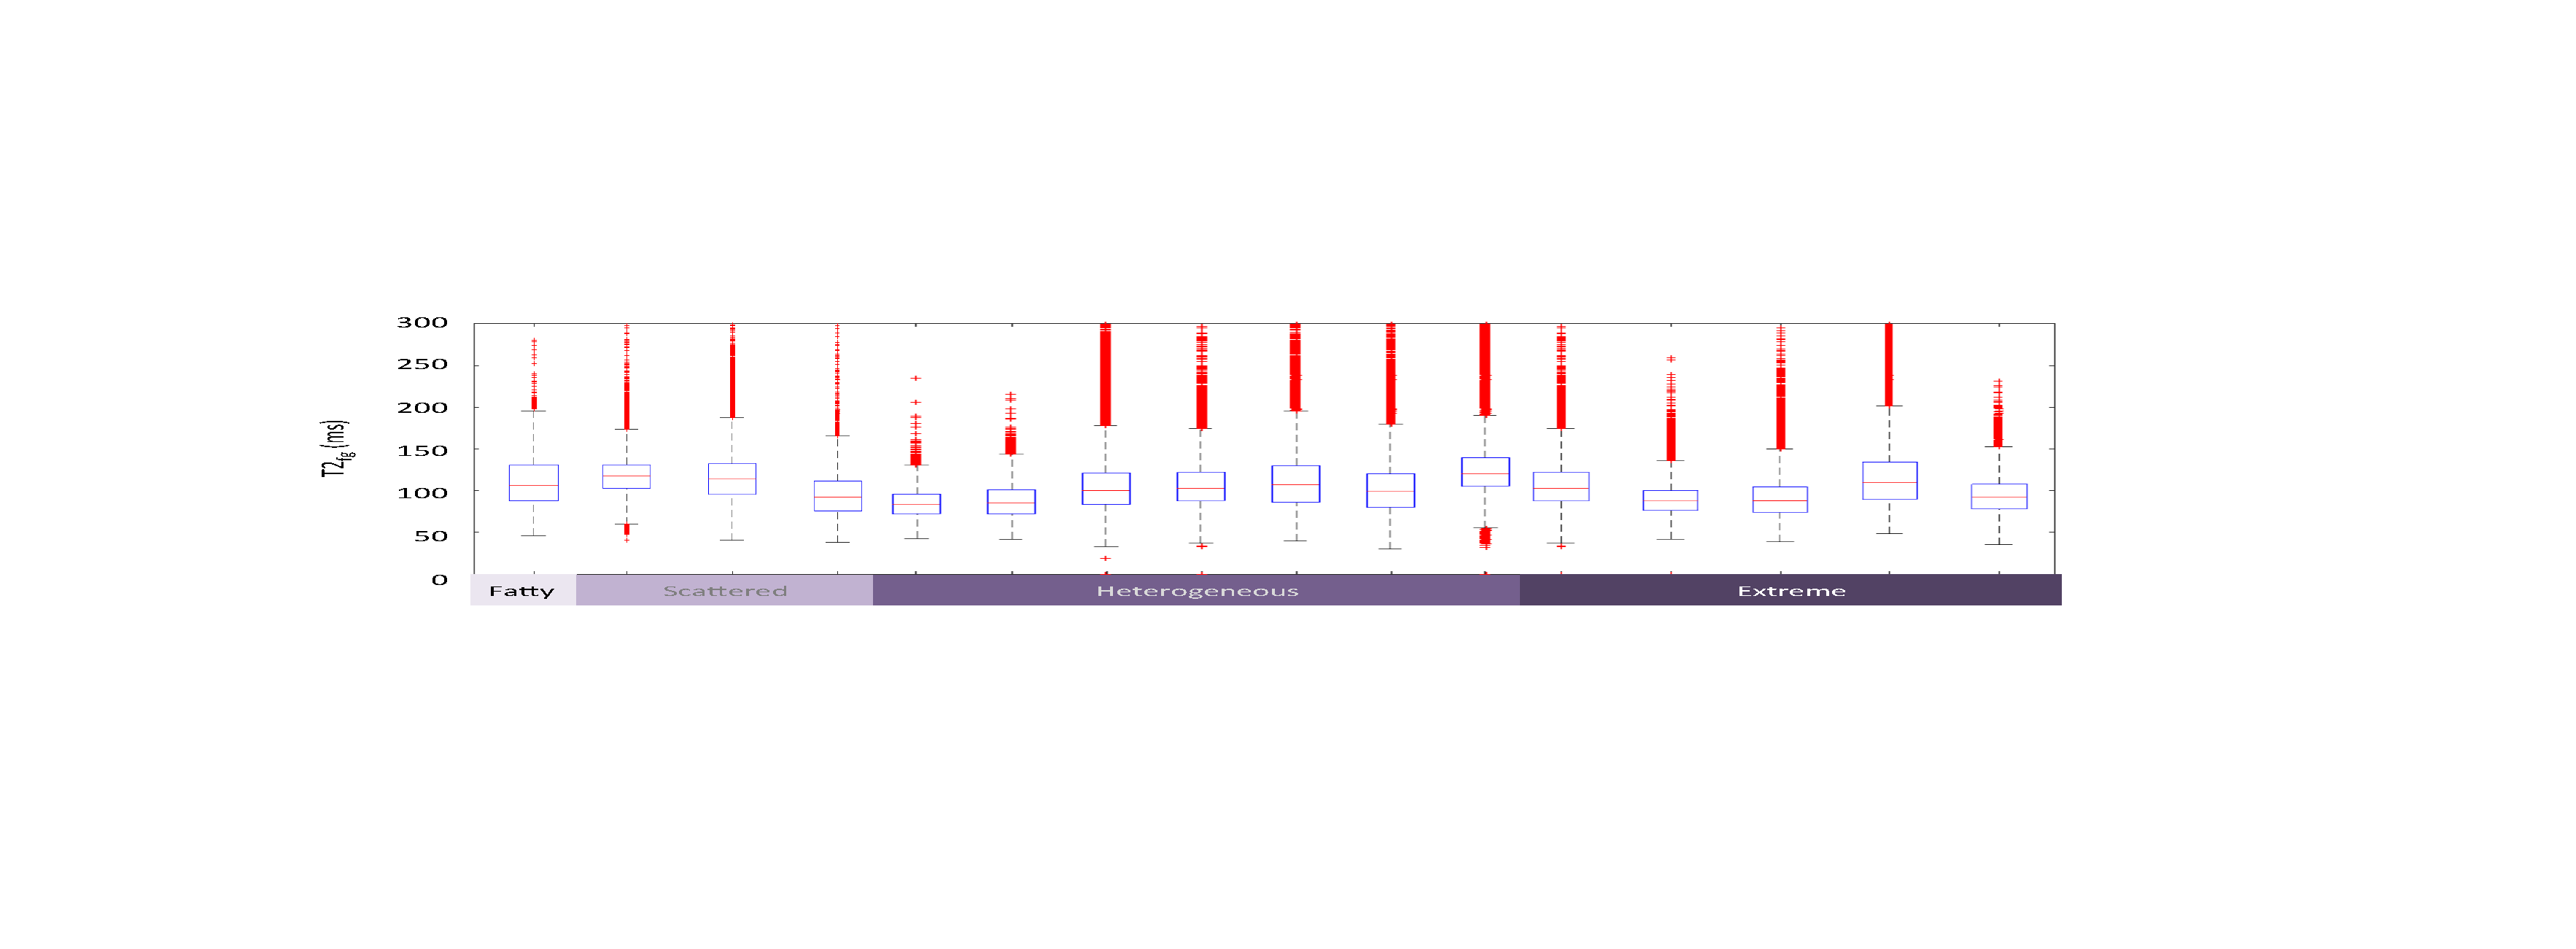
heterogeneity was evaluated as the standard deviation of T2fg within
a single patient and inter-patient variation was evaluated as the standard
deviation across all patients of mean T2fg per patient.
Results
Mean T2fat was measured as 153.0 ms, which is consistent with literature values at 3T in the breast and musculoskeletal sites3-4 (range of mean T2fat per patient: 145.6 – 161.4 ms). The standard deviation in T2fg within a single patient ranged from 16.83 to 41.79 ms (mean 29.6 ms) indicating a high intra-patient variability. Mean T2fg per patient was 103.9 ms with standard deviation 12.5 ms.Discussion
An increased proportion of fibroglandular tissue with respect to total breast volume is associated with an increased breast cancer risk5-6. Increased background parenchymal enhancement is also an independent marker of increased breast cancer risk5-6. T2 mapping offers a quantitative method of characterizing the microenvironment of breast tissue. We hypothesize that intra- and inter-patient heterogeneity in our measured T2 relaxation times are likely due to differences not only in the fibroglandular tissue environment but also in the composition and structure of infiltrating fatty components. T2 may, then, hold promise as a tool that can be used to identify clinically applicable quantitative predictive and prognostic biomarkers. Our pilot cohort presented here can be used to guide a larger study of T2 and breast cancer risk.Conclusion
T2 of fibroglandular breast tissue measured without fat saturation is on the order of 100 ms but has high intra-patient variation. This heterogeneity may reflect differences in the fibroglandular microenvironment related to breast cancer risk.Acknowledgements
No acknowledgement found.References
1. Rakow-Penner, R., Daniel, B., Yu, H., Sawyer-Glover, A. and Glover, G. H., Relaxation times of breast tissue at 1.5T and 3T measured using IDEAL. J. Magn. Reson. Imaging, (2006) 23: 87–91.
2. Liu, Li, et al. Changes of T2 Relaxation Time From Neoadjuvant Chemotherapy in Breast Cancer Lesions. Iranian Journal of Radiology In Press (2016).
3. Tess V. Clendenen, Sungheon Kim, Linda Moy, Livia Wan, Henry Rusinek, Frank Z. Stanczyk, Malcolm C. Pike, Anne Zeleniuch-Jacquotte, Magnetic Resonance Imaging (MRI) of hormone-induced breast changes in young premenopausal women, Magnetic Resonance Imaging, (2013) 31(1):1-9
4. Garry E. Gold, Eric Han, Jeff Stainsby, Graham Wright, Jean Brittain, and Christopher Beaulieu, Musculoskeletal MRI at 3.0 T: Relaxation Times and Image Contrast, American Journal of Roentgenology 2004 183:2, 343-351
5. Albert, M., Schnabel, F., Chun, J., Schwartz, S., Lee, J., Leite, A. P. K., & Moy, L. (2015). The relationship of breast density in mammography and magnetic resonance imaging in high-risk women and women with breast cancer. Clinical imaging, 39(6), 987-992.
6. Pike, M. C., and C. L. Pearce. "Mammographic density, MRI background parenchymal enhancement and breast cancer risk." Annals of oncology24.suppl 8 (2013): viii37-viii41.
Figures