2112
Quantifying Fibroglandular Tissue Volume using Chemical-Shift Encoded MRI: Validation in a Phantom1Department of Medical Physics, University of Wisconsin-Madison, Madison, WI, United States, 2Department of Radiology, University of Wisconsin-Madison, Madison, WI, United States, 3Department of Biomedical Engineering, University of Wisconsin-Madison, Madison, WI, United States, 4Department of Emergency Medicine, University of Wisconsin-Madison, Madison, WI, United States, 5Department of Medicine, University of Wisconsin-Madison, Madison, WI, United States, 6Carbone Cancer Center, University of Wisconsin-Madison, Madison, WI, United States
Synopsis
Increased breast density is a known risk factor for the development of breast cancer. Quantitative MRI methods have the potential to provide accurate, volumetric measures of breast tissue volume and density. A novel, confounder-corrected chemical shift encoded (CSE) MRI technique designed to provide accurate fibroglandular tissue volume and density quantification is validated using a fat and water phantom. The CSE MRI technique provided accurate quantification of water and volumes and was robust to changes in spatial resolution and complexity of fat/water interfaces, indicating this method is expected to produce accurate and robust quantification of fibroglandular and adipose tissue in-vivo.
Purpose
Women with mammographically dense breasts are known to have an increased risk for developing breast cancer1. Clinical interpretation of mammograms allows for a qualitative assessment of breast density and subjective assignment to one of four categories2. However, mammographic assessment of breast density is subject to inter- and intra-reader variability3. Thus, robust and accurate volumetric, quantitative MRI-based methods for measuring breast density would have important potential advantages for reproducible assessment of breast cancer risk.
We previously demonstrated the feasibility of a quantitative chemical-shift encoded (CSE) MRI technique capable of providing measures of both fibroglandular tissue volume and the overall percentage of fibroglandular tissue4. Here, we further validate this method in a phantom consisting of known volumes of fat and water.
Materials and Methods
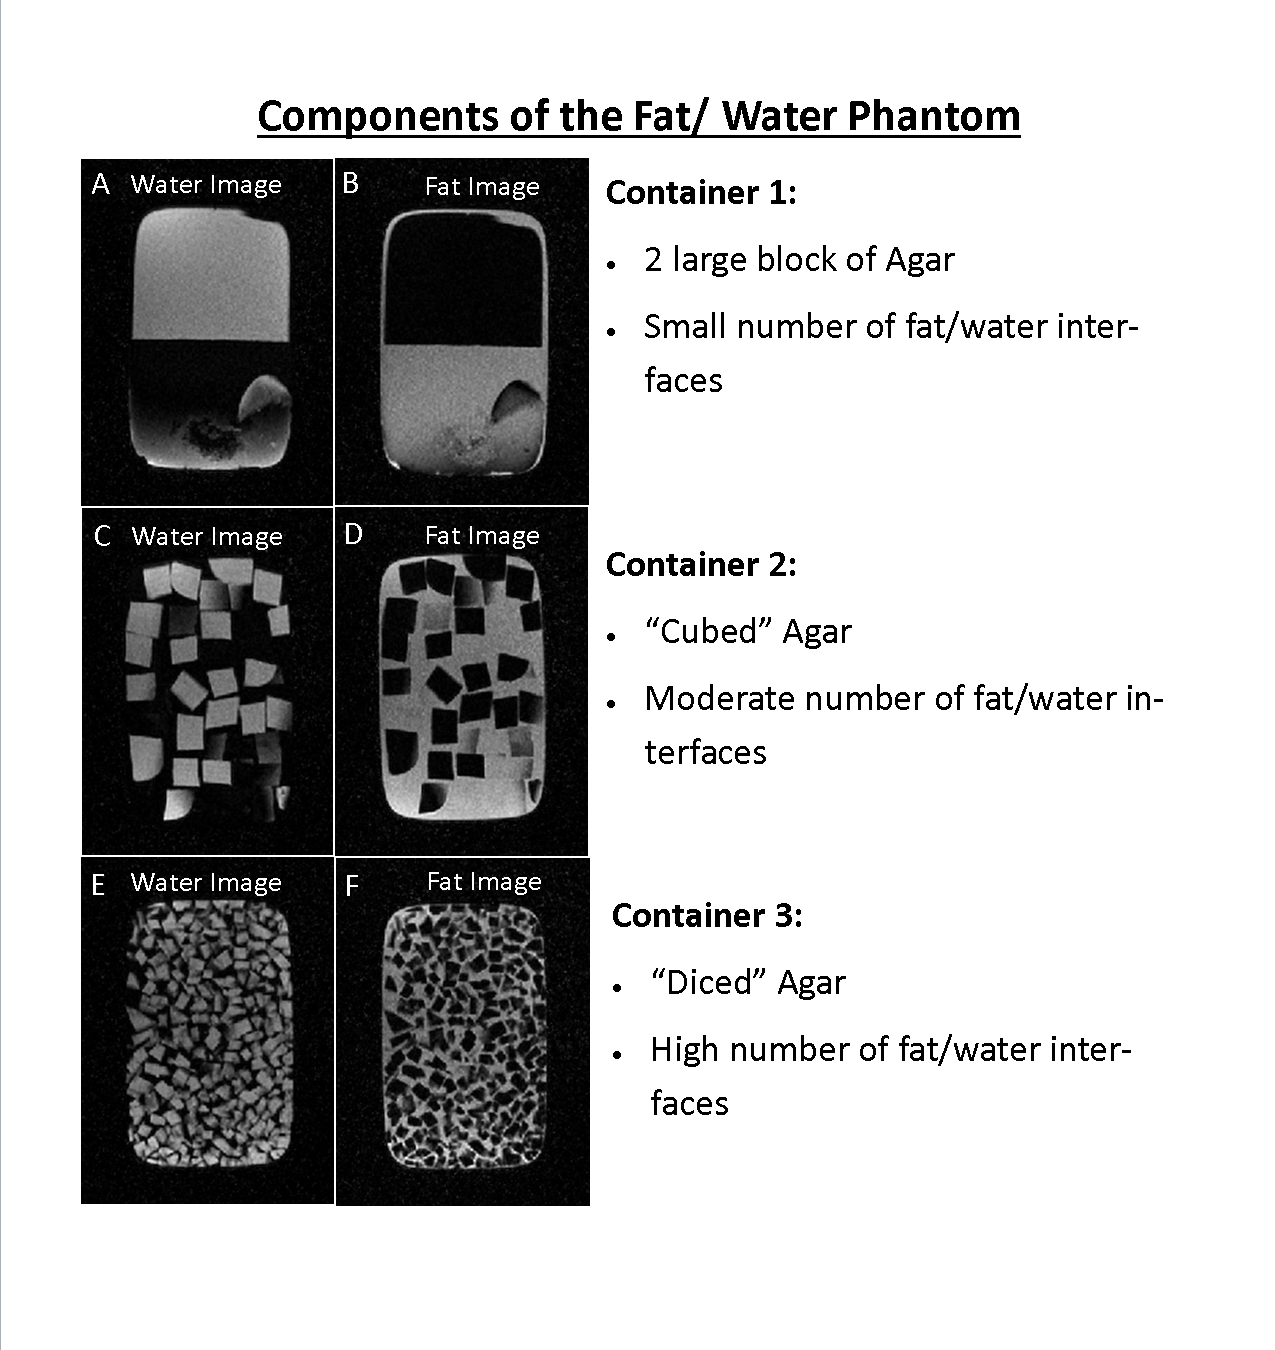
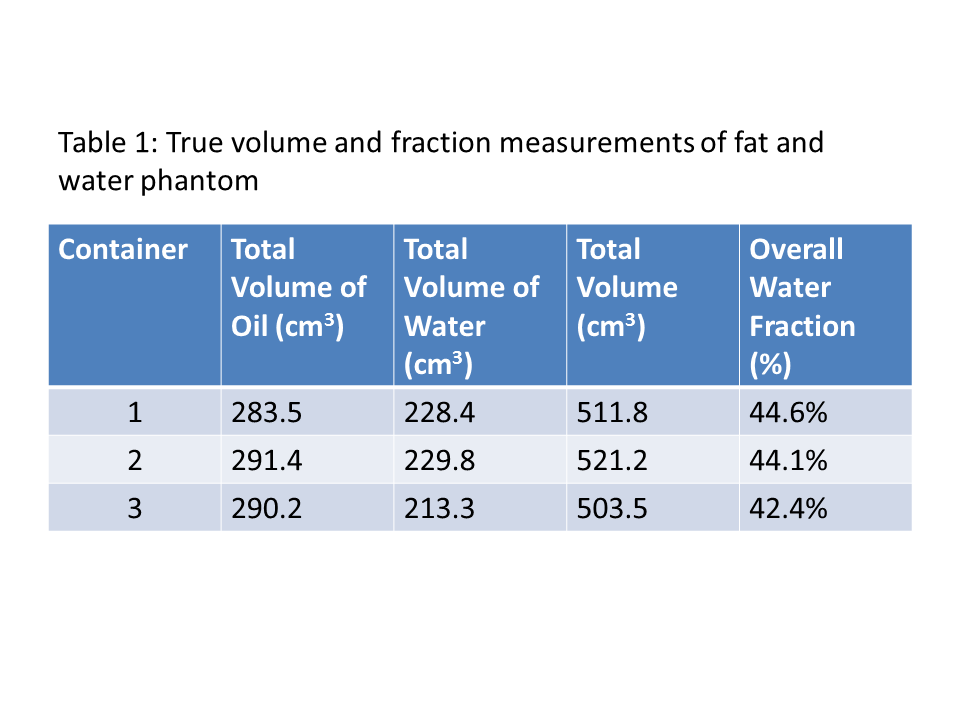
A phantom consisting of three containers with known volumes of peanut oil and water (2% weight by volume agar gel) was constructed. The agar was doped using CuSO4 to have a T1 similar to that of fibroglandular tissue5. True volumes of fat and water in each container are given in Table 1. To simulate increasingly complex interfaces between breast fat and fibroglandular tissue, the agar was cut into increasingly smaller volumes (see Figure 1).
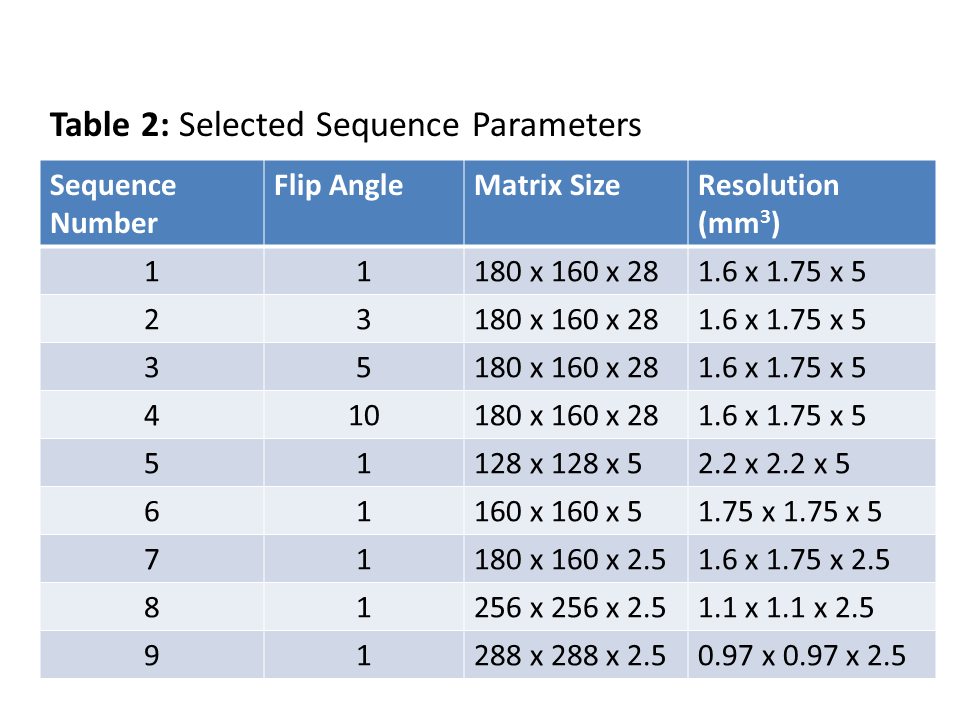
The phantom was imaged on a 1.5T scanner (Signa HDxt, GE Healthcare) using an 8-channel breast coil. Imaging was performed using investigational version of a quantitative CSE sequence (IDEAL IQ, GE Healthcare) with six echoes and an investigational version of a two-point Dixon method (FLEX, GE Healthcare). Images were acquired in the coronal plane with a 28 cm FOV and 14 cm slab. Flip angles and matrix sizes selected for imaging are given in Table 2.
Images were reconstructed offline using the previously described CSE-MRI4 technique or the two-point Dixon method. The voxel water fraction (WF) was calculated as:
$$$Voxel_{WF}=\frac{Voxel_{water}}{Voxel_{water}+Voxel_{fat}}$$$
The volume of the water was calculated as:
$$$Volume_{water}=\sum{Voxel_{WF}\times{Volume_{voxel}}}$$$
Where the summation was performed over the entire volume of the phantom as defined via a noise thresholding operation on the highest resolution CSE-MRI image of each container. Similar measures were made for fat. Overall water fraction was calculated as the total water volume divided by total calculated volume of the container.
Results
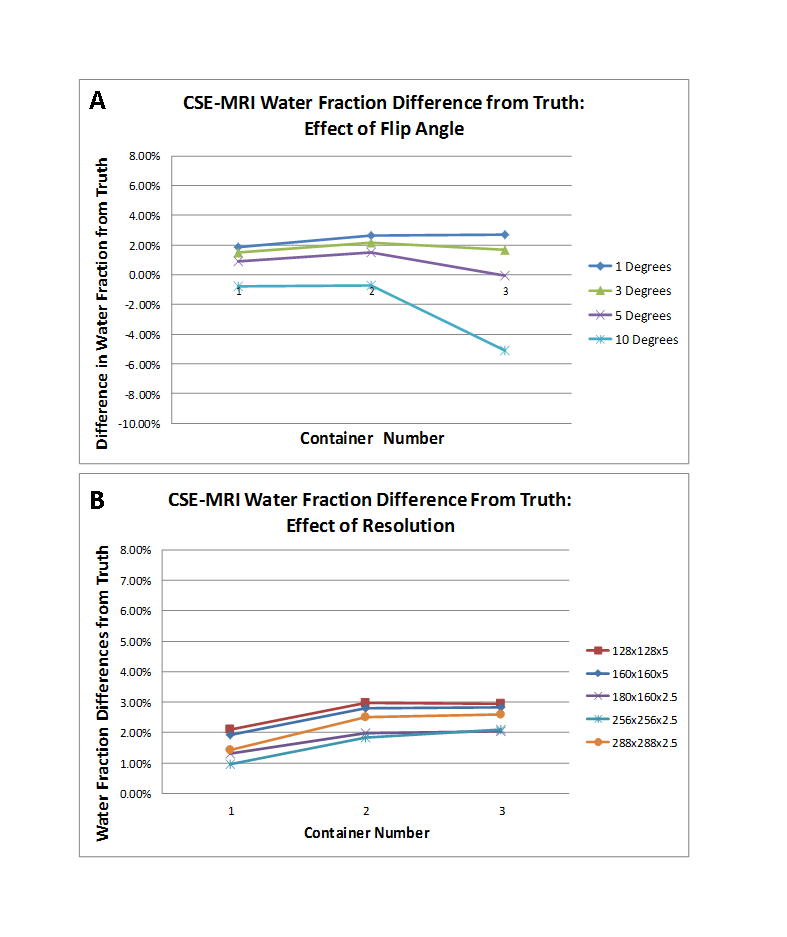
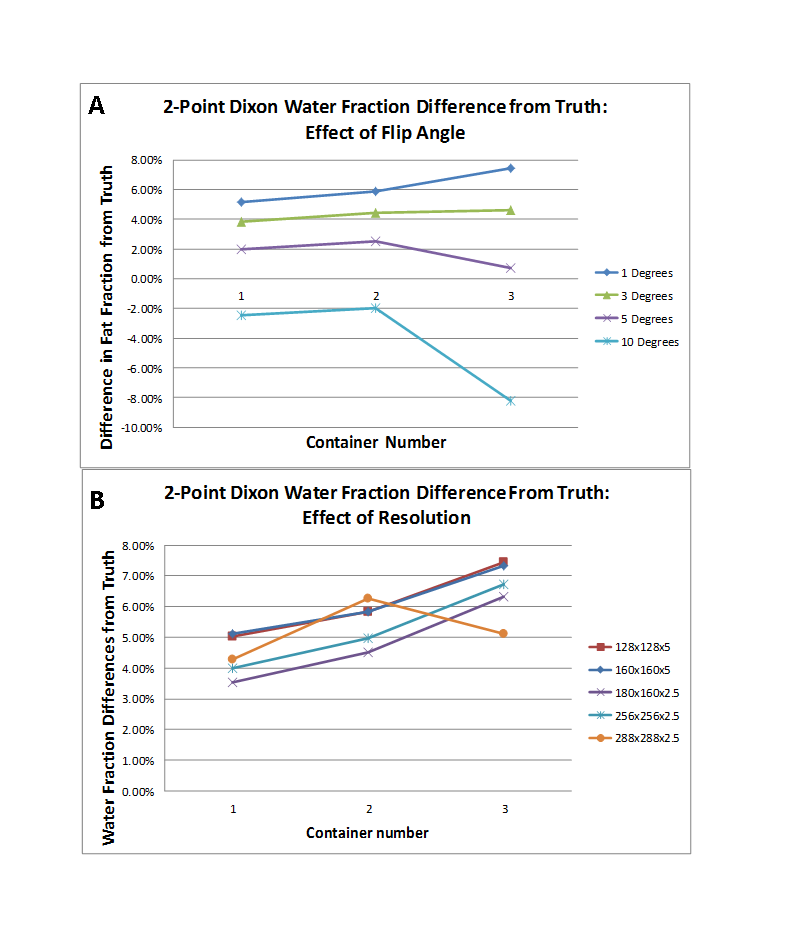
The overall volume of containers 1-3 were calculated to be 515.8 cm3, 512.6 cm3 and 499.8 cm3 respectively using the CSE-MRI technique, representing a deviation from the true volume of 0.77%, -1.65% and -0.72%. Plots showing the deviation of the calculated water fraction from the known truth for each of the sequences at the flip angles and matrix sizes given in Table 2 are shown in Figures 2 and 3. There is a small, baseline (1-2%) overestimation of the water fraction as compared to the true water fraction in the low interface case, which increases by ~1% in the higher interface cases using CSE MRI. With two-point Dixon, this baseline overestimation increases (3.5-5.1%).Discussion
The CSE-MRI method was able to calculate the overall volume of each container within 2% of the true volume. Increased T1-weighting at higher flip angles led to underestimation of the overall water volume in voxels containing a mix of species types as expected from previously published results6. This effect had the largest impact in container 3 (see Figure 2) due to the increased water-fat interfaces. Consistent water fraction measurements (within 1% of one another) were observed across the three containers (increasing number of interfaces) despite changes in matrix size (Figure 2), indicating the CSE-MRI technique accurately accounts for partial voluming effects to quantify the water fraction on a per voxel basis. The small, baseline overestimation of the water fraction is of yet unexplained.
The two-point Dixon method was also investigated as it can produce fat and water separated images in a fraction of the acquisition time required for quantitative six-echo CSE-MRI, but it does not account for all known confounding factors. Similar results were seen in response to increasing flip angle (Figure 3 A), but baseline overestimation of the water fraction was higher. The impacts of uncorrected bias are seen more clearly in the water fraction results at different resolutions, with increased overestimation of the water fraction with increasing levels of partial voluming, due to additional interfaces and/or decreasing matrix size.
Conclusion
The CSE-MRI technique produced accurate estimates of both the overall phantom volume and water fraction despite increasing numbers fat water interfaces and changes to the imaging matrix size, confirming that the technique is robust to spatial resolution and partial voluming effects compared with two-point Dixon techniques.Acknowledgements
The authors would like to acknowledge support from the Department of Radiology at the Authors' institution, the Cancer Center at the Authors' institution, the NIH/NCI (T32 CA009206, P30 CA014520, R01 DK083380, R01 DK100651, K24 DK102595), the Radiological Society of North America, and GE Healthcare.References
1. Boyd NF, Guo H, Martin LJ, Sun L, Stone J, Fishell E, Jong RA, Hislop G, Chiarelli A, Minkin S and others. Mammographic density and the risk and detection of breast cancer. N Engl J Med 2007;356(3):227-36.
2. Morris EA, Comstock CE, Lee CH, Lehman CD, Ikeda DM, Newstead GM, Tozaki M, Hylton N, Helbich TH, Kuhl C and others. ACR BIRADS Magnetic Resonance Imaging. ACR BIRADS Atlas, Breast Imaging Reporting and Data System. Reston, VA: American College of Radiology; 2013.
3. Ciatto S, Houssami N, Apruzzese A, Bassetti E, Brancato B, Carozzi F, Catarzi S, Lamberini MP, Marcelli G, Pellizzoni R and others. Categorizing breast mammographic density: intra- and interobserver reproducibility of BI-RADS density categories. Breast 2005;14(4):269-75.
4. Strigel RM, Henze Bancroft LC, Hernando D, Reeder SB. Proton Density Water Fraction as a Measurement of Breast Fibroglandular Tissue Volume and Concentration. 2016; Singapore.
5. Rakow-Penner R, Daniel B, Yu H, Sawyer-Glover A, Glover GH. Relaxation times of breast tissue at 1.5T and 3T measured using IDEAL. J Magn Reson Imaging 2006;23(1):87-91.
6. Liu CY, McKenzie CA, Yu H, Brittain JH, Reeder SB. Fat quantification with IDEAL gradient echo imaging: correction of bias from T(1) and noise. Magn Reson Med 2007;58(2):354-64.
Figures