2111
Accuracy of Multi-Expert algorithm for segmenting the breast1Radiology Dept., NYU School of Medicine, New York, NY, United States
Synopsis
Breast density, defined as fraction of fibroglandular tissue (FGT), and post-contrast FGT enhancement (background parenchymal enhancement) are considered cancer risk factors. These MRI measures are recommended for radiologic reports and are promising cancer biomarkers. There is a general agreement that isolating the breasts from the chest wall (CW) is the most difficult to automate step in the FGT segmentation pipeline. Various methods for this task have been reported, but all show significant limitations. We have previously developed a semi-automated FGT segmentation tool that required approximately 7 min per case. We are reporting a new algorithm based on six overlapping Experts that significantly improves segmentation speed and accuracy.
Background
Breast density, defined as fraction of fibroglandular tissue (FGT), and post-contrast FGT enhancement (background parenchymal enhancement) are considered cancer risk factors 1,2. These MRI measures are recommended for radiologic reports and are promising cancer biomarkers3.
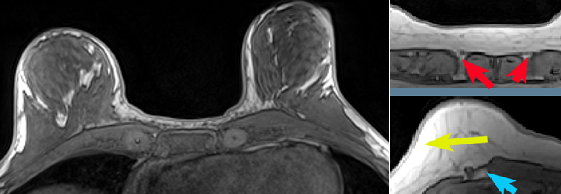
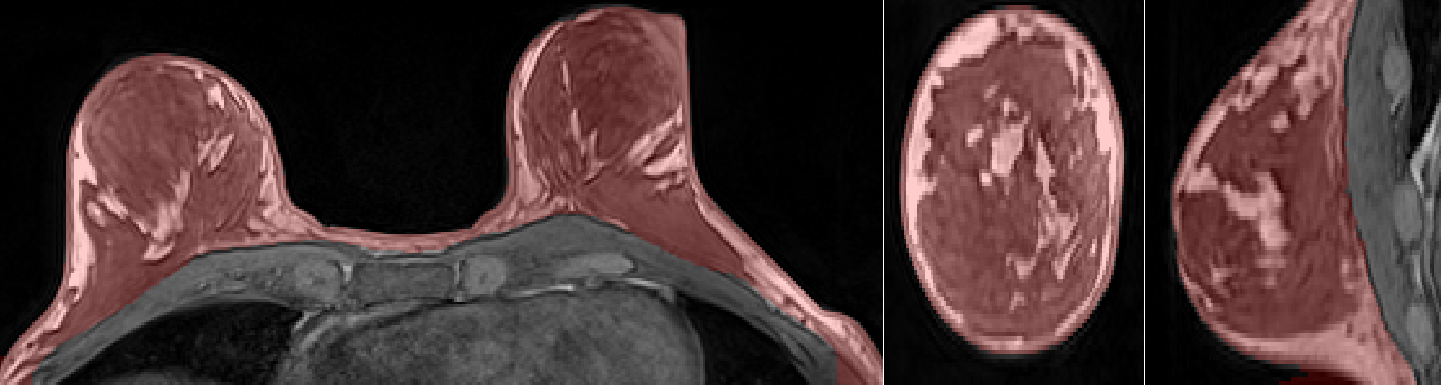
There is a general agreement that isolating the breasts from the chest wall (CW) is the most difficult to automate step in the FGT segmentation pipeline (Fig.1). Various methods for this task have been reported, but all show significant limitations.
Purpose
We have previously developed a semi-automated FGT segmentation tool that required approximately 7 min per case. We are reporting a new algorithm based on six overlapping Experts that significantly improves segmentation speed and accuracy.Methods
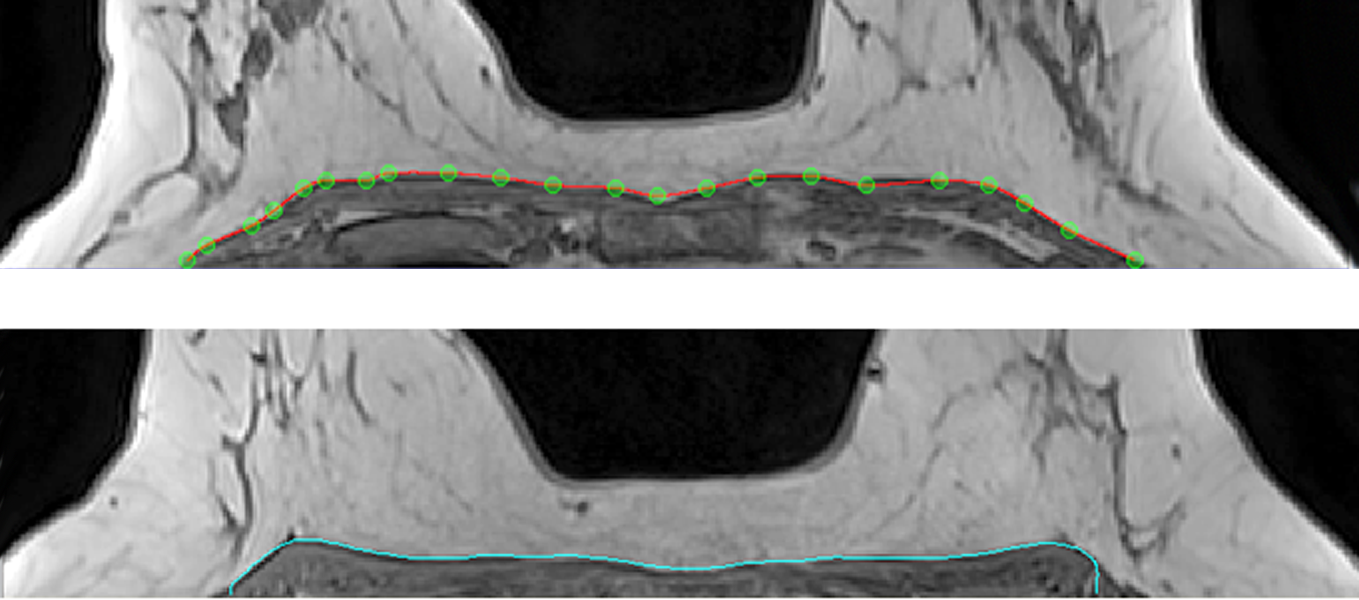
The user starts by tracing the breast-chest wall (CW) boundary using a vector spline interactive tool on the mid-axial slice (Figure 2). Spline typically consists of 25 points placed every 10 mm. It takes less than 15 sec to construct the Spline. The rest of processing is 100% automatic.
Spline contour P is quantized as a 1-voxel step polyline. Non-uniformity correction (NUC)4 is then applied to the whole volume. P is propagated in two opposite (inferior and superior) directions. For each new slice the algorithm adjusts each control point of the polyline received from an adjacent slice. We use 6 overlapping Experts inside the iterative loop: Max Edge strength, Vicinity signal signature, Gradient similarity, Contour-Gradient consistency, Whole contour signal consistency, and Gradient/Contour Normal consistency. Each expert is a statistical measure implemented in ~30 lines of C++ code. At each iteration we form a candidate 2D shift vector based on the consensus of all Experts. The 5-pixel neighborhood of each control point is scored by each of 6 experts. After score normalization following SoftMax formula5, the weighted average from all Experts is used to shift P to its new position. This is followed by a smoothing step. The process terminates when contour changes become < 0.01 mm or it exceeds the specified (100) number of iterations. Average execution time is: 15-sec for initial spline, 30 sec for NUC, and 30 sec for contour propagation.
Twelve cases were randomly selected from a local database of 400+ screening breast MRIs. Selected patients were 24 – 76 years old. Breasts were imaged on Siemens 3T Magnetom Trio equipped with a 7-element surface breast coil. The algorithm was applied to T1-weighted non-fat-suppressed 3-D sequence with parameters TR=4.74 ms, TE=1.79 ms, FOV=320 mm2, 448 x 358 x (110-180) matrix, ~0.7 x 0.7 x 1.1 mm voxels. An experienced breast radiologist drew contours (ground truth) that delineate the breast (including the axillary tail) and separates it from CW. The pectoralis fascia and pectoralis muscles were used as reference points for the anterior and anterolateral CW; the medial border of the axilla was the posterolateral boundary.
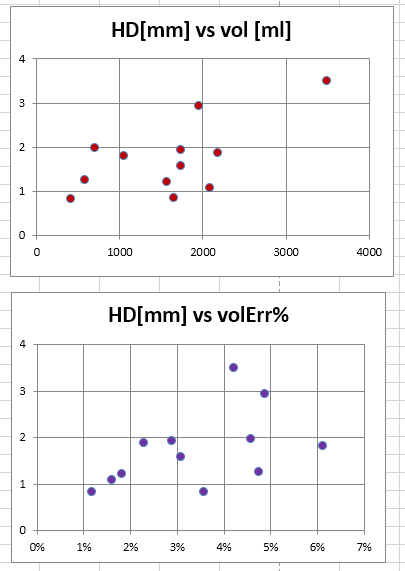
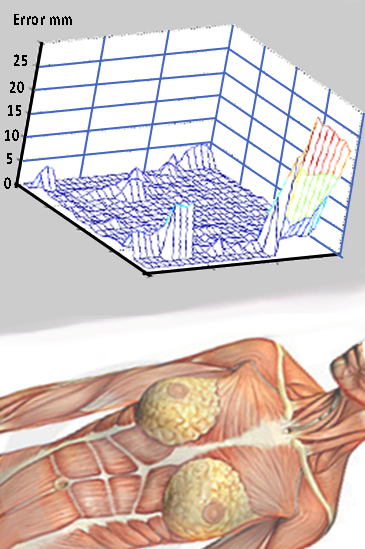
Two metrics were used to estimate accuracy. (1) The conventional volumetric error was obtained by dividing the volume DV of misclassified breast voxels over the true breast volume V. DV/V combined false positive (over-segmentation) and false negative (under-segmentation) errors. (2) The Hausdorff distance (HD) was measured for each voxel from the true breast/chest wall border to the closest voxel produced by the algorithm. HD was averaged over the entire acquisition; it was further analyzed for regional error distribution by projecting it on the coronal plane (Fig. 4).
Results
Across all 12 cases the border distance error HD was 1.7+/-0.8 mm (average+/-standard deviation) , range 0.8-3.5 mm. Regional plot demonstrated excellent agreement with ground truth border except for lateral, axillary tail areas (Fig. SurfacePlot). The volume error DV/V was 3.4%+/-1.5%, range 1.2%-6.1%. There was no correlation between the two measures (Figure 4, R2 = 0.24, p=0.11). The 12 cases covered a wide range 407.5 - 3480.2 ml of breast volumes. There was a significant positive correlation (R2=0.40, p=0.02) between volumetric error and the true breast volume V, but there was no correlation between HD and V (R2=0.07, p=0.41).Discussion and conclusions
Given its accuracy, speed and versatility, the multi-agent breast segmentation method appears to be ready for clinical use as a part of larger workflow (Figure 5). The limitations include the need to insert the seed border and the failure to separate parts of axillary tail from the chest. As no breast-specific heuristics were employed, the multi-agent algorithm appears to be applicable to a variety of medical segmentation tasks. We plan to integrate the algorithm into automated FGT Segmentation workflow and include results in routine diagnostic reports.Acknowledgements
The work was performed under the rubric of the Center for Advanced Imaging Innovation and Research (www.cai2r.net), a NIBIB Biomedical Technology Resource Center (NIH P41 EB017183).References
[1] King V BJ, Bernstein JL, Reiner AS, Pike MC, Morris EA. Background parenchymal enhancement at breast MR imaging and breast cancer risk. Radiology. 2011; 260(1):50-60.
[2] Dontchos BN RH, Partridge SC, Korde LA, Lam DL, Scheel JR, Peacock S, Lehman CD. Are Qualitative Assessments of Background Parenchymal Enhancement, Amount of Fibroglandular Tissue on MR Images, and Mammographic Density Associated with Breast Cancer Risk? Radiology. 2015; 276(2):371-80.
[3] Morris EA, Lee CH, et al. ACR BI-RADS® Magnetic Resonance Imaging. In: ACR BI-RADS® Atlas, Breast Imaging Reporting and Data System. 2013; Reston, VA, American College of Radiology.
[4] Mikheev A , Rusinek H, Wiggins G. Non-Uniformity Normalization Using 3D Canny Edges and Legendre Polynomial Approximation of the Bias Field: Validation on 7T T1W Brain. Proceedings ISMRM 21st Ann. Mtg. 2013
[5] Bishop, Christopher M. (2006). Pattern Recognition and Machine Learning. Springer.
Figures