2110
MRI can assess breast cancer related lymphoedema tissue composition and guide management strategy1CR-UK Cancer Imaging Centre, Royal Marsden NHS Foundation Trust and Institute of Cancer Research, London, United Kingdom, 2Cardiac and Vascular Sciences, St. George’s University of London, London, United Kingdom, 3Skin Unit, Royal Marsden NHS Foundation Trust and Institute of Cancer Research, London, United Kingdom
Synopsis
Here we present an MRI-based approach to assess breast cancer related lymphoedema tissue composition (fluid, fat, and muscle volumes) and we evaluate a cohort of 13 patients. Our measurements indicate that fat, which cannot be eliminated by first line treatment, was the predominant component of the swelling. Furthermore, changes in tissue composition were not uniform along the arm. Quantification of the volume and spatial distribution of different tissue components could greatly improve treatment delivery and patient selection for optimal treatment. With a 6 minute MRI scan and automated post-processing, this methodology shows potential for implementation in clinical practice.
PURPOSE
A defining characteristic of breast cancer related lymphoedema (BCRL) is the accumulation of both fluid and fat within the arm1. The ratio of these two components varies greatly between lymphoedema arms, yet first line treatment for BCRL (compression and drainage massage) addresses only the fluid, not the fat2. Quantification of the volume, spatial distribution, and prevalence of fat and fluid could greatly improve patient selection for optimal treatment. We present an MRI-based approach to assess BCRL tissue composition, and we evaluate a cohort of 13 patients with unilateral BCRL.METHODS
MRI protocol
Images were acquired at 1.5 T (MAGNETOM Aera, Siemens AG, Erlangen, Germany). The patient was positioned supine, with the examined arm extended along the body, and brought towards the center of the magnet with a rotation of the torso. The arm (hand to the axilla) was imaged with 3 partially overlapping volumes (FOV = 300 mm in the superior/inferior direction). The following sequences were acquired in sagittal orientation:
1) a fluid-sensitive 2D STIR (TR = 5544 ms, TE = 121 ms, TI = 160 ms, voxel size = 1.2×1.2×4 mm3, acquisition time per volume = 68 s)
2) a two-point 3D T1W gradient-echo based Dixon sequence (TR = 12.50 ms, TE = 2.34, 4.77 ms, FA = 12°; voxel size = 1×1×4 mm3, acquisition time per volume = 47 s)
Figure 1 illustrates the automated segmentation workflow (coded in IDL, version 8.2, Exelis Visual Information Solutions, Boulder, Colorado, USA) which was employed to separate the muscle, fat, and fluid components, and to contour the external volume of the arm and the muscle fascia.
Clinical measurements
Both the affected and the unaffected arms of 13
patients with diagnosed unilateral BCRL were measured with this technique. All patients were adult women who gave written
informed consent. For
each patient, the following volumes were extracted: total arm, sub-fascial,
epi-fascial, muscle (sub-fascial), fluid (epi-fascial), fat (epi-fascial). Affected
versus unaffected volumes were compared using a two-tailed paired t-test (p
< 0.05). The distribution of fluid, fat, and epi-fascial
excess volumes (affected minus unaffected) along the arm was also evaluated.
RESULTS
Total arm, epi-fascial, epi-fascial fluid, and epi-fascial fat volumes were significantly different (p < 0.0005), with greater volume in the affected arms. The increase in epi-fascial volume (globally, 94% of the excess volume) constituted the bulk of the lymphoedematous swelling, with fat comprising the main component. The total fat excess volume summed over all patients was 2.1 times that of fluid. Furthermore, fat and fluid excess volumes were linearly correlated in the cohort of patients analyzed (Figure 2), with the fat excess volume being greater than the fluid in almost all subjects (all the points falling above the identity line). Differences in muscle compartment volume between affected and unaffected arms were not statistically significant, and contributed only 6% to the total excess volume.
Considering the distribution of the different tissue excess volumes (Figure 3), fluid accumulated prevalently around the elbow (blue intensity maps), with substantial involvement of the upper arm in only a few cases. Fat excess volume (orange intensity maps) was generally greater in the upper arm; however, the relative increase in epi-fascial volume (green intensity maps), which considers the total swelling relative to the original size of the arm, was in most cases maximal within the forearm.
DISCUSSION
BCRL remains a difficult treatment challenge: our measurements indicate that fat, which cannot be eliminated by first line treatment, was the predominant component of the swelling. Furthermore, changes in tissue composition associated with BCRL were not uniform along the arm. Quantification of the volume and distribution of fat and fluid could identify those patients who would still benefit from standard decongestive treatment, and guide compression therapy or drainage massage towards the areas with prevalence of fluid. In cases where fat is the dominant component, liposuction should be considered at an earlier stage of management3. An approach to BCRL management which uses the MRI-based measurements proposed here could therefore guide the clinician regarding care requirement, saving time and resources on unnecessary treatment. Furthermore, this methodology provides quantitative means of monitoring the effects of treatment interventions on the internal composition of the swollen arm.CONCLUSION
We have introduced a methodology to visualize different BCRL tissue components within the arm and measure their volume. With a 6 minute MRI scan and automated post-processing, this methodology provides quantitative metrics not currently available during the standard clinical assessment, and shows potential for implementation in clinical practice.Acknowledgements
The authors acknowledge the support of the Cancer Research UK (CR-UK) and the Engineering and Physical Sciences Research Council (EPSRC) Cancer Imaging Centre in association with the Medical Research Council (MRC) and Department of Health (England) (grants C1060/A10334, C1090/A16464); the National Institute for Health Research (NIHR) funding to the Clinical Research Facility in Imaging and to the Biomedical Research Centre at the Royal Marsden NHS Foundation Trust and Institute of Cancer Research. MB is funded by a Healthcare Science Doctoral Research Fellowship (HCS-D13-04-002) from the NIHR and Health Education England (HEE). MOL is an Emeritus NIHR Senior Investigator. The views expressed are those of the author(s) and not necessarily those of the NHS, the NIHR or the Department of Health.References
1. Mortimer P. Arm lymphoedema after breast cancer. Lancet Oncol. 2013 May;14(6):442–3.
2. Framework L. Best practice for the management of lymphoedema. International consensus [Internet]. 2006 [cited 2016 Nov 9]; Available from: http://old.ewma.org/fileadmin/user_upload/EWMA/Wound_Guidelines/Lymphoedema_Framework_Best_Practice_for_the_Management_of_Lymphoedema.pdf
3. Brorson H. Liposuction in Lymphedema Treatment. J Reconstr Microsurg. 2016 Jan;32(1):56–65.
Figures
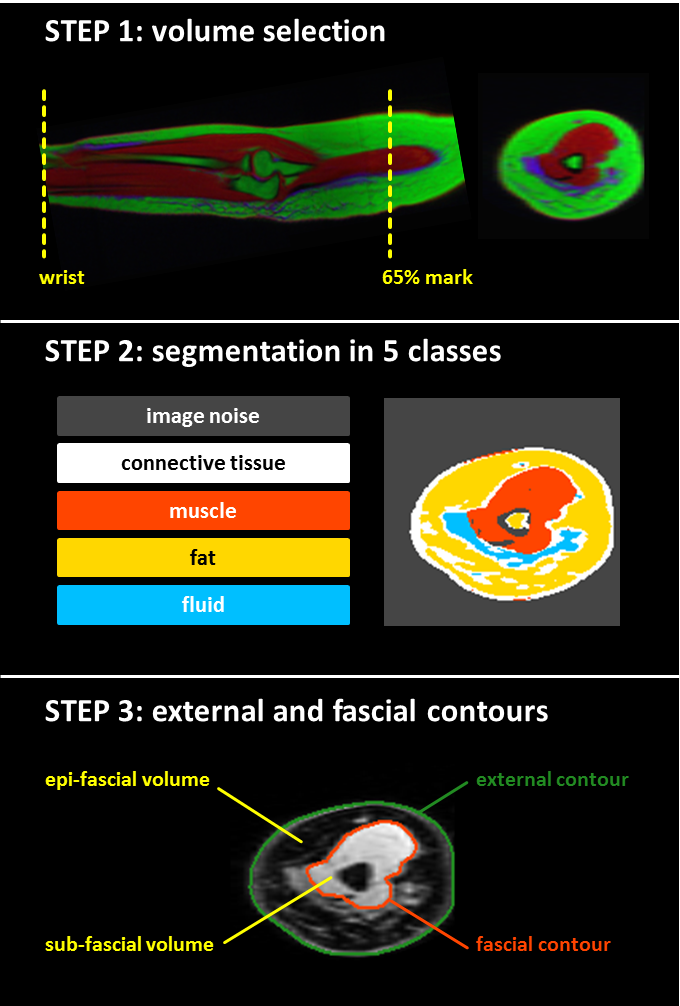
Figure 1
Step 1: Color representation of the overlapped Dixon water (red), Dixon fat (green) and STIR (blue) images. The sagittal (longitudinal) view displays the portion of the arm included in the analysis (between the wrist and the 65% of the distance between the elbow and the shoulder tip). Step 2: Segmentation map of a representative slice. The k-means algorithm (k=5) is employed to segment the arm. Step 3: Automated contouring algorithms are employed to extract the fascial and external contours (which encompass, respectively, the sub-facial and total arm volumes). The epi-fascial volume is the volume between the two contours.
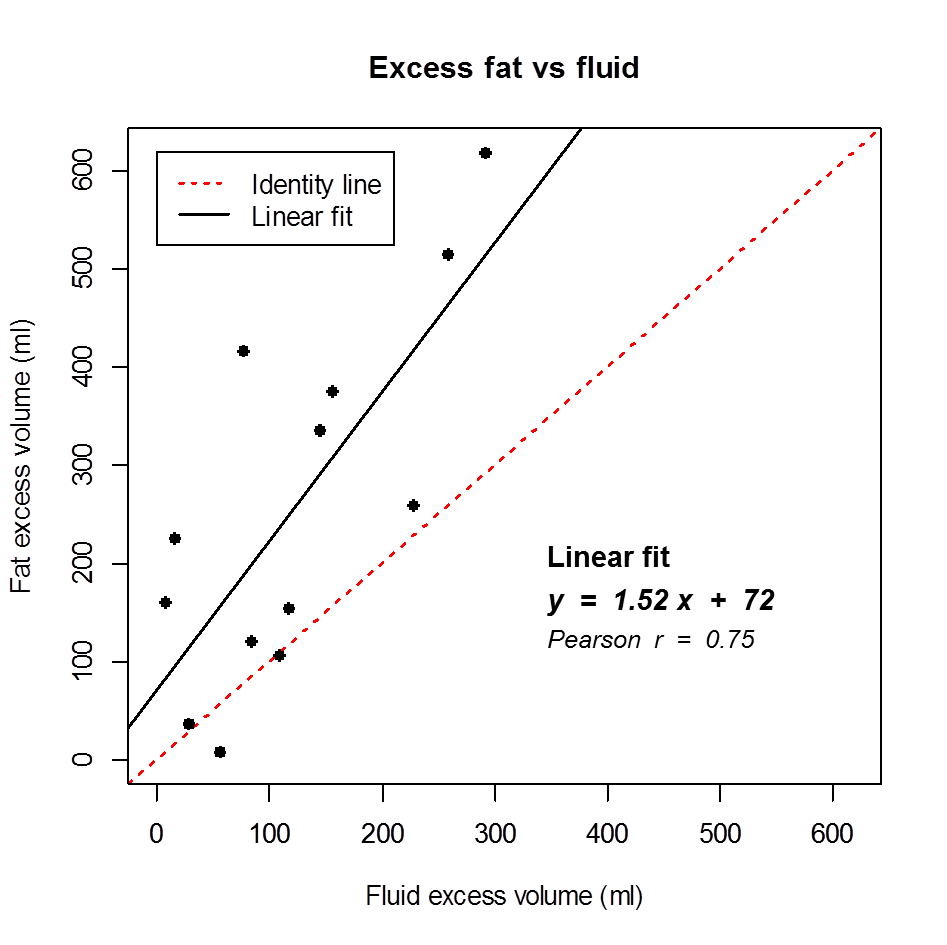
Figure 2
Correlation between fat and fluid excess volumes. The black line represents the linear fit (equation and Pearson correlation coefficient are reported on the graph). The correlation was significant (p = 0.003). The fat excess volume was greater than the fluid excess volume in almost all subjects - all the points falling above the identity line (dotted red line).
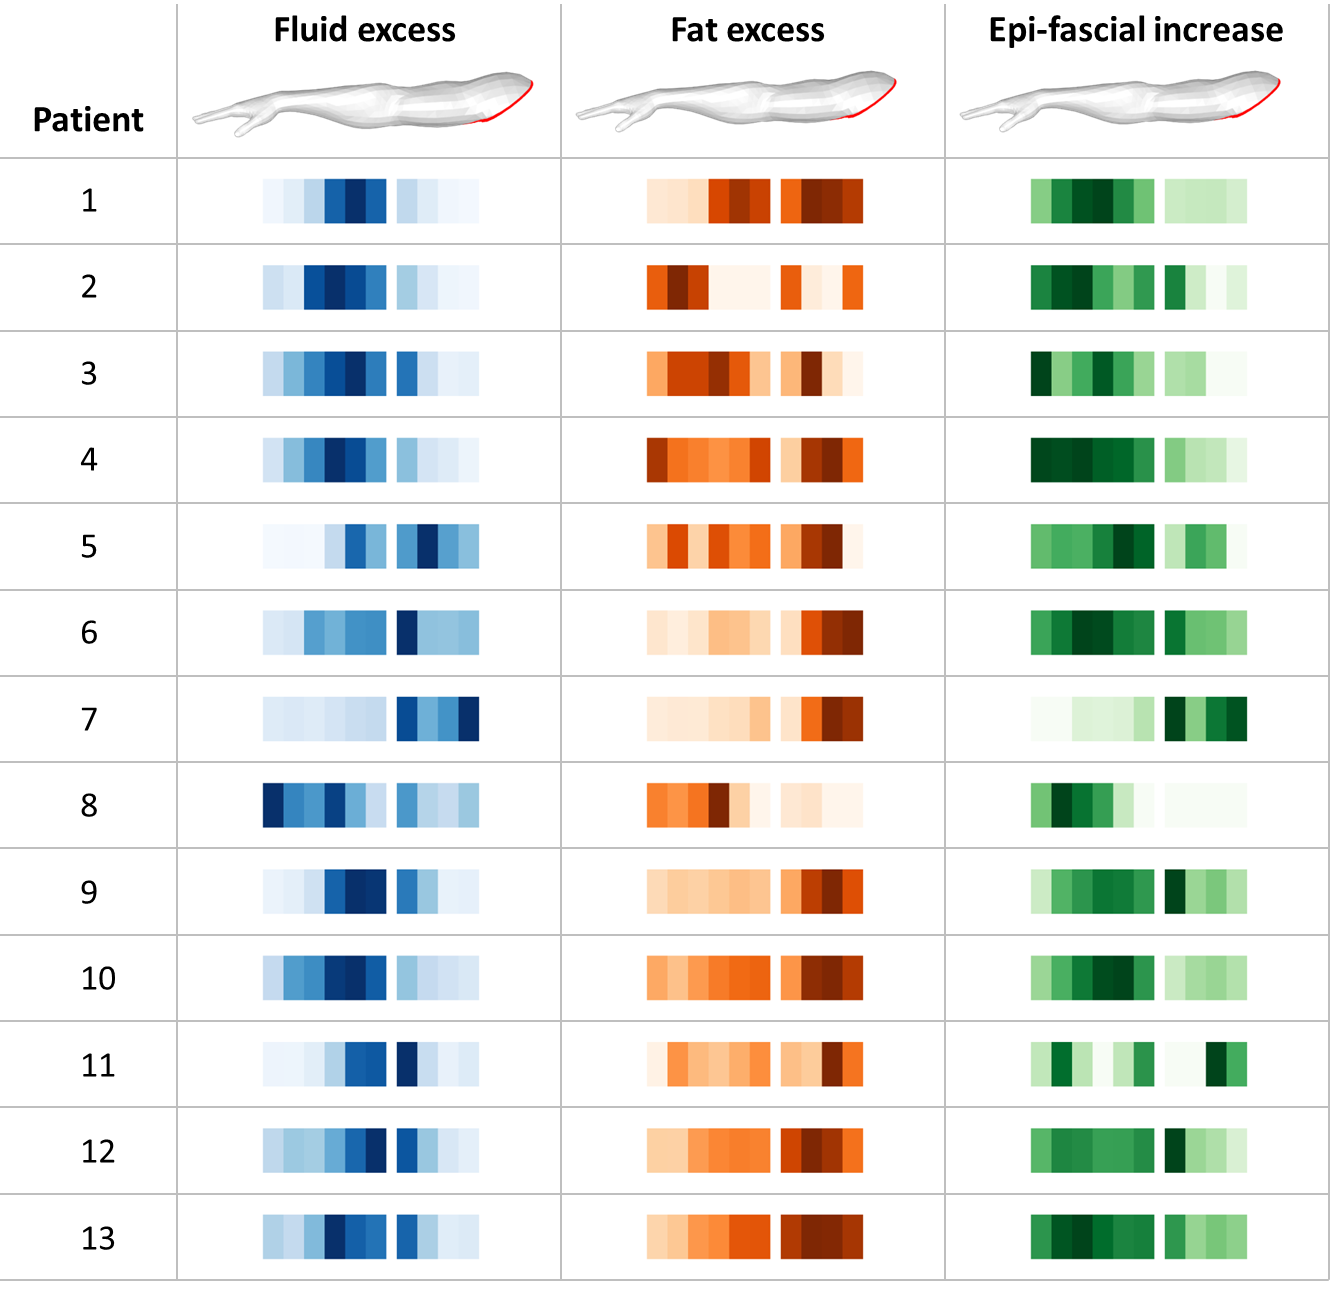
Figure 3
Arrays of longitudinal intensity maps for all 13 patients (each line represents a single patient). The intensity maps visualize the excess volumes (affected minus unaffected) along the arm; darker color indicates greater volume. The fluid and fat excess volumes (blue and orange, respectively) are calculated as the absolute difference between the two arms. The epi-fascial increase (green) is the epi-fascial excess volume relative to the original size of the unaffected volume.