2109
T2* Mapping for Breast Tumor categorizing1Clinical Science, Philips Healthcare, Beijing, People's Republic of China, 2Department of Radiology, Jiangxi Cancer Hospital
Synopsis
Utilizing the state of art water-fat separation method with multi-echo acquisition in mDIXON quant to explore the relationship between magnetic resonance transverse relaxation time (T2*) and the pathological type of breast tumors.
Introduction
MRI signal from fat contenting tissues usually generate very long T2* in multiple gradient echo sequences, and this obscures us to measure the true T2* mapping in non-fat breast tissue. Because of the difficulty in removing fat content from breast MRI, it is very challenging to quantify T2* of non-fat tissue in breast. However, T2* indicates important biological characteristics of tissue, such as cellular swelling as well as hypoxia. T2* imaging techniques may provide noninvasive prognostic prediction and guide cancer therapies [2, 3, 4, 5].
mDIXON quantification [1] utilizes a 7-peak model for the separation of water and fat with multi-echo scan scheme. The transverse relaxation time (T2*) is better quantified with incorporation of modeling the water-fat frequency shift. Herein we examined the relationship of T2* measured by mDIXON quant with clinicopathological type to test the feasibility of categorizing breast tumors.
Methods
A total of 25 patients with pathologically confirmed breast cancer went mDIXON-quant MR imaging on a 3.0T MR Scanner (Ingenia, Philips Healthcare, Best, the Netherlands) by an radiologist. The routine breast MRI examination included turbo spin-echo T1- and T2-weighted sequences and sagittal T2 SPAIR, as well as a three-dimensional dynamic contrast-enhanced sequence. Before injection of the contrast agent, mDIXON quant was performed using a multiple fast-field echo sequence within single breath hold (12 seconds). Raw images at each echo in the axial planes were obtained with scanning parameters as: TR, 8.8 ms; TE1, 1.11ms; 6echos with delta TE 1.3ms; FOV 300 × 300 × 189 mm, FA=3°, resolution=2.5×2.5×3.0mm, SENSE=2.
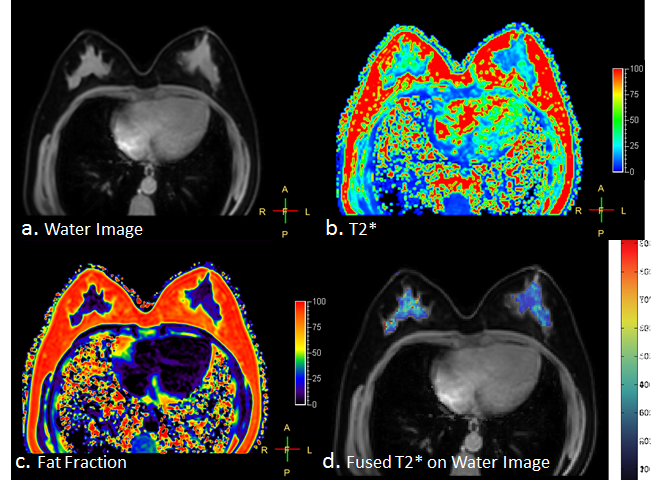
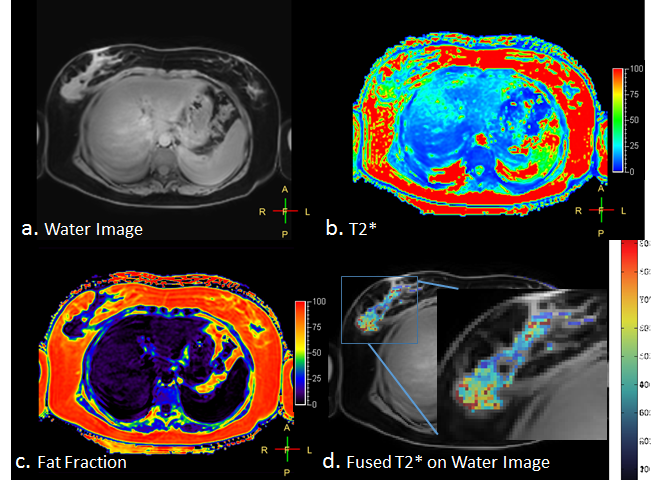
Image processing was done based on the output from the mDIXON quant. Voxels with 25% or less in fat fraction quantification was segmented as mostly water; then the T2* quantification results, masked by the water segmentation, were overplayed on top of the water images.
Results
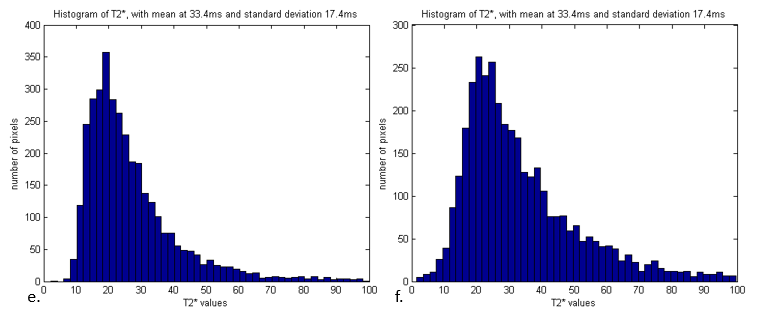
The T2 star values are found to correlate well with the pathological type of breast masses. Figure 1 shows the T2* (Fig.1) result from a patient with ductal hyperplasia; we didn’t find abnormal T2* values. Figure 2 shows high values in the T2* on a patient’s right breast, where the lesion was confirmed grade 3 IDC (invasive ductal carcinomas) and also lymph node metastasis. Overall we found that the T2* values are higher (showed in red in Fig.3) in the breast cancer tissue, on the contrary to previous studies with BOLD-MRI protocols [6].Conclusion and discussion
We found that breast cancer tissue have higher T2* value than other tissues; this phenomenon might relates to cellular swelling due to the cancer tissue metabolism. The mDIXON fat fraction method provides a very quick (one breath-hold scan) and clear way to visualize the non-fat tissue T2* mapping. The result is contradicting to previous BOLD-MRI in measuring T2*, which might due to water-fat frequency shift modeling as well as the very short TEs in mDIXON quant exams. We are looking into more clinical cases to analyze the impact of this new method in improving MRI application in breast tumor categorization.Acknowledgements
No acknowledgement found.References
[1]. Kukuk, GM. et al. Comparison between modified Dixon MRI techniques, MR spectroscopic relaxometry, and different histologic quantification methods in the assessment of hepatic steatosis. Eur Radiol. 2015 Oct;25(10):2869-79.
[2]. Padhani AR, et al. Imaging oxygenation of human tumors. Eur Radiol. 2007 Apr; 17(4): 861–872.
[3]. Rodolfo P, et al. Non-invasive assessment of tumor neovasculature: techniques and clinical applications. Cancer Metastasis Rev 2008;27:615–630.
[4]. Zhang X, et al. Induction of mitochondrial dysfunction as a strategy for targeting tumour cells in metabolically compromised microenvironments. Nat Commun 2014;5:3295 doi: 10.1038/ncomms4295 .
[5]. Padhani AR, et al. Imaging oxygenation of human tumors. Eur Radiol 2007;17:861–872. [6]. Choi HY, et al. Prognostic Significance of Transverse Relaxation Rate (R2*) in Blood Oxygenation Level-Dependent Magnetic Resonance Imaging in Patients with Invasive Breast Cancer. PLoS One. 2016; 11(7): e0158500.
Figures