2104
Estimating breast tumor blood flow during neoadjuvant chemotherapy using interleaved high temporal and high spatial resolution MRI1Division of Biomedical Imaging, University of Leeds, Leeds, United Kingdom, 2Department of Radiology, Leeds Teaching Hospital NHS Trust, 3Department of Medical Physics and Engineering, Leeds Teaching Hospital NHS Trust, 4Department of Western General Hospital, NHS Lothian
Synopsis
An ideal breast MRI protocol might include high spatial and high temporal resolution images acquired following a single contrast agent injection. Here we present an acquisition strategy to acquire both for clinical reporting and tracer kinetic analysis. The approach was evaluated using simulations and tested through application in patients undergoing neoadjuvant chemotherapy. Radiologists could adapt similar protocol strategies to examine the physiological characteristics of tumors and their associated changes during treatment without significantly compromising the data used for clinical reporting.
Introduction
Neoadjuvant chemotherapy (NACT) is an option for patients with advanced breast cancer, but a significant proportion of patients do not benefit from it1. Assessment of treatment response is typically limited to clinical examinations that monitor morphological changes2. It is however recognized that changes in tumor physiology, such as tumor blood flow (TBF), may precede morphological changes3. Dynamic contrast-enhanced (DCE) MRI with tracer kinetic analysis may provide insights, but there is limited adoption into clinical practice because it requires high temporal resolution (HTR) data that come at the expense of recommended high spatial resolution (HSR; http://www.acr.org/Quality-Safety/Standards-Guidelines). There have been several attempts to overcome this issue but even then the temporal resolution was suboptimal4,5. In this study we present and evaluate an interleaved sampling strategy6 that acquires both HTR DCE data for quantifying breast TBF and HSR DCE data for clinical reporting, following a single standard injection of contrast agent.Methods
A simulation study was undertaken to evaluate the interleaved strategy outlined in Figure 1. A realistic arterial input function (AIF) was simulated7 at HTR and convolved with tissue residue functions described using a 2 compartment exchange model (2CXM)8. The model is defined by four physiological parameters: TBF (Fb), capillary permeability surface-area product (PS), blood volume fraction (vb) and extracellular-extravascular space (EES) volume fraction (ve).
Three typical tumor curve types (3, 4 and 5) were tested at various noise levels (SNR: 20, 30, 50 and 80). The series were cropped to simulate three sampling strategies: method 1 (SM1), continuous HTR (2.2 s) imaging for approximately 8 minutes; method 2 (SM2), as SM1 with gaps for HSR imaging as in the clinical protocol (Figure 1); and method 3 (SM3), as SM2 with the initial burst of HTR data shortened to remove the second pass of the AIF, which would allow earlier HSR acquisition. 1000 tissue curves were generated for each case.
Ten female patients diagnosed with locally advanced breast cancer and due to undergo NACT were scanned on a 1.5 T Avanto MR scanner (Siemens, Germany) at baseline and following two cycles of NACT. To increase the sensitivity in the descending aorta a flexible matrix coil was positioned on the patient’s back. The MRI protocol is shown in Table 1. At the start of HTR imaging a dose of 0.1 mmol/kg Gd-DOTA was administered at 3 ml/s followed by 20 ml saline. All MRI data were processed in Matlab (Mathworks, USA). Inversion recovery images were used to obtain baseline T1,0 relaxation time estimates for tumors and AIF. Tumor and AIF 3D regions of interest (ROIs) were selected on HTR images. HSR images were used for tumor volume estimation. The signal intensity time series were converted to relaxation rate changes and interpolation was used to account for the gaps in the AIF resulting from the interleaved scheme before fitting with the 2CXM.
Results
Simulations
Scatter plots for combinations of parameter estimates (Figure 2) illustrate that some fit errors occurred with type 3 and 5 curves. Interstitial volume (ve) is estimated with a low precision for type 3 at a SNR of 20, but improved at a SNR of 50 and as more data points were used in the fitting process (i.e. SM1 and SM2 outperform SM3). Figure 2 (bottom row) shows that fitting type 5 curve acquired with SM3 and, to a lesser extent, with SM2, can lead to fit failures. For type 4 curves, the distribution of parameter estimates is more homogeneous without fit errors.
Clinical Application
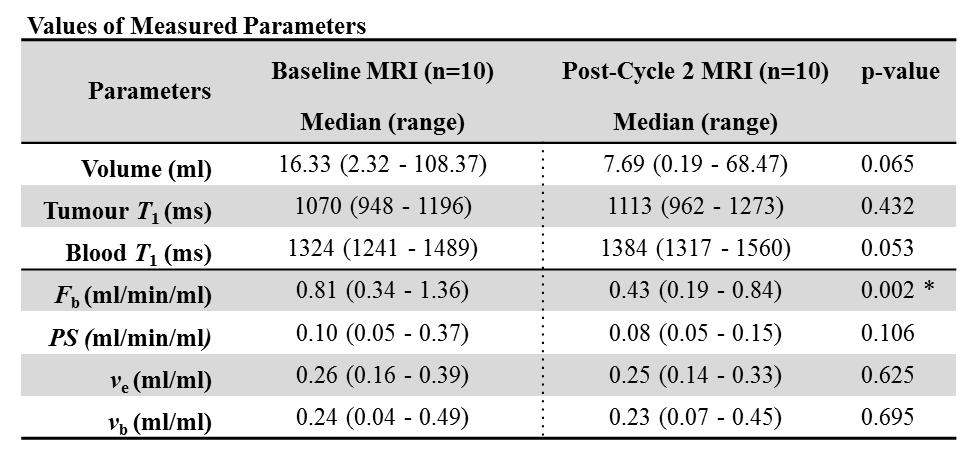
Example of HSR and HTR images acquired are shown in Figure 3 along with the corresponding signal-time curves. Example model fits for patients at baseline and post-cycle 2 are illustrated in Figure 3. Table 2 summarizes the resulting parameter estimates. There was a significant change between baseline and post-cycle 2 estimates of TBF. Tumor volume decreased by 53% but this change was not significant.
Discussion
The simulation studies demonstrated that the proposed acquisition scheme (SM2) was comparable to SM1 in most cases. The inability of SM3 to compete with SM1 and SM2 demonstrates the importance to fully acquire the early bolus passes. TBF was the most reliable estimate for all sampling strategies. Clinical application of the proposed techniques allowed quantification of TBF and PS while retaining HSR data necessary for clinical reporting.Conclusion
TBF can be measured reliably using the proposed interleaved strategy without compromising a standard clinical protocol. Furthermore, TBF is a more sensitive marker of NACT response than other DCE parameters.Acknowledgements
The study was funded, in part, by Breast Cancer Now (award 2014MayPR241). The authors wish to thank Trish Snowden for her hard work in patient recruitment and MRI scanning.References
1. Makris A, Powles TJ, Ashley SE, et al. Original article A reduction in the requirements for mastectomy in a randomized trial of neoadjuvant chemoendocrine therapy in primary breast cancer. Ann Oncol. 1998:1179-1184.
2. Eisenhauer EA, Therasse P, Bogaerts J, et al. New response evaluation criteria in solid tumours: Revised RECIST guideline (version 1.1). Eur J Cancer. 2009;45(2):228-247.
3. Wasser K, Klein SK, Fink C, et al. Evaluation of neoadjuvant chemotherapeutic response of breast cancer using dynamic MRI with high temporal resolution. Eur Radiol. 2003;13:80-87.
4. Song HK, Dougherty L, Schnall MD. Simultaneous acquisition of multiple resolution images for dynamic contrast enhanced imaging of the breast. Magn Reson Med. 2001;46(3):503-509.
5. Saranathan M, Rettmann DW, Hargreaves BA, et al. Variable spatiotemporal resolution three-dimensional dixon sequence for rapid dynamic contrast-enhanced breast MRI. J Magn Reson Imaging. 2013;1399:1-8.
6. Grøvik E, Bjørnerud A, Storås TH, et al. Split dynamic MRI: Single bolus high spatial-temporal resolution and multi contrast evaluation of breast lesions. J Magn Reson Imaging. 2014;39:673-682.
7. Parker GJM, Roberts C, Macdonald A, et al. Experimentally-derived functional form for a population-averaged high-temporal-resolution arterial input function for dynamic contrast-enhanced MRI. Magn Reson Med. 2006;56(5):993-1000.
8. Sourbron SP, Buckley DL. Tracer kinetic modelling in MRI: estimating perfusion and capillary permeability. Phys Med Biol. 2012;57(2):R1-33.
Figures
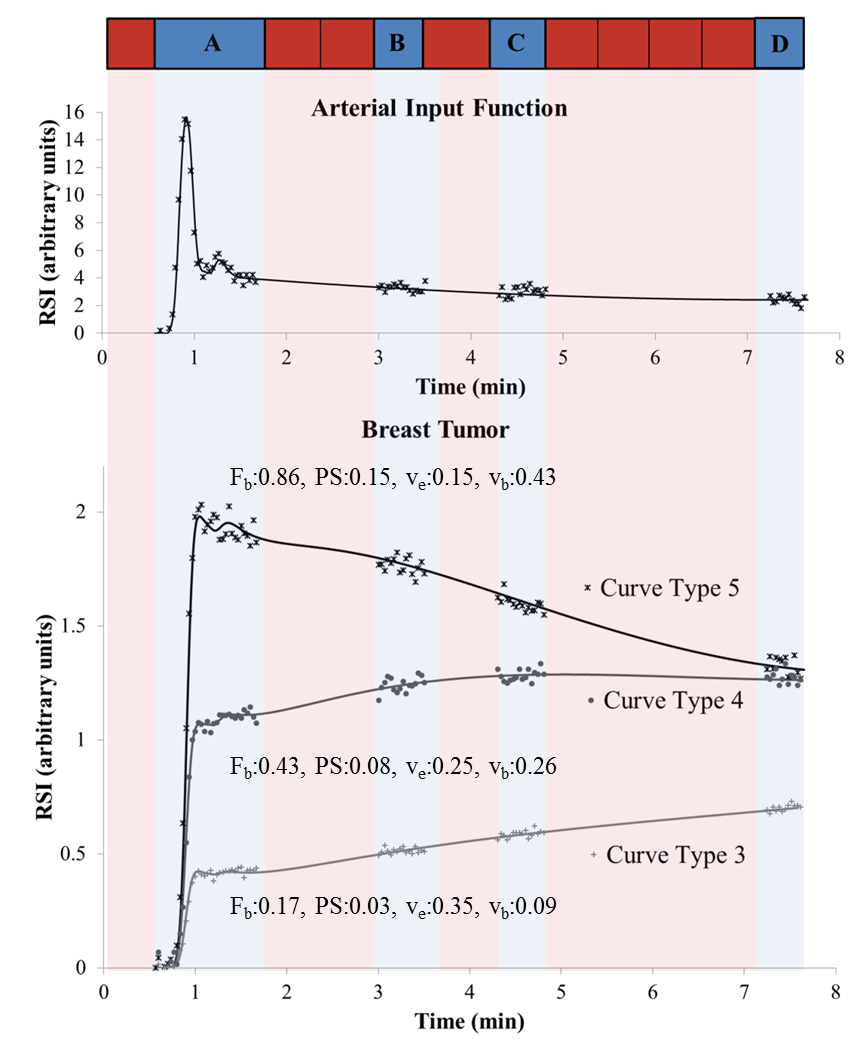
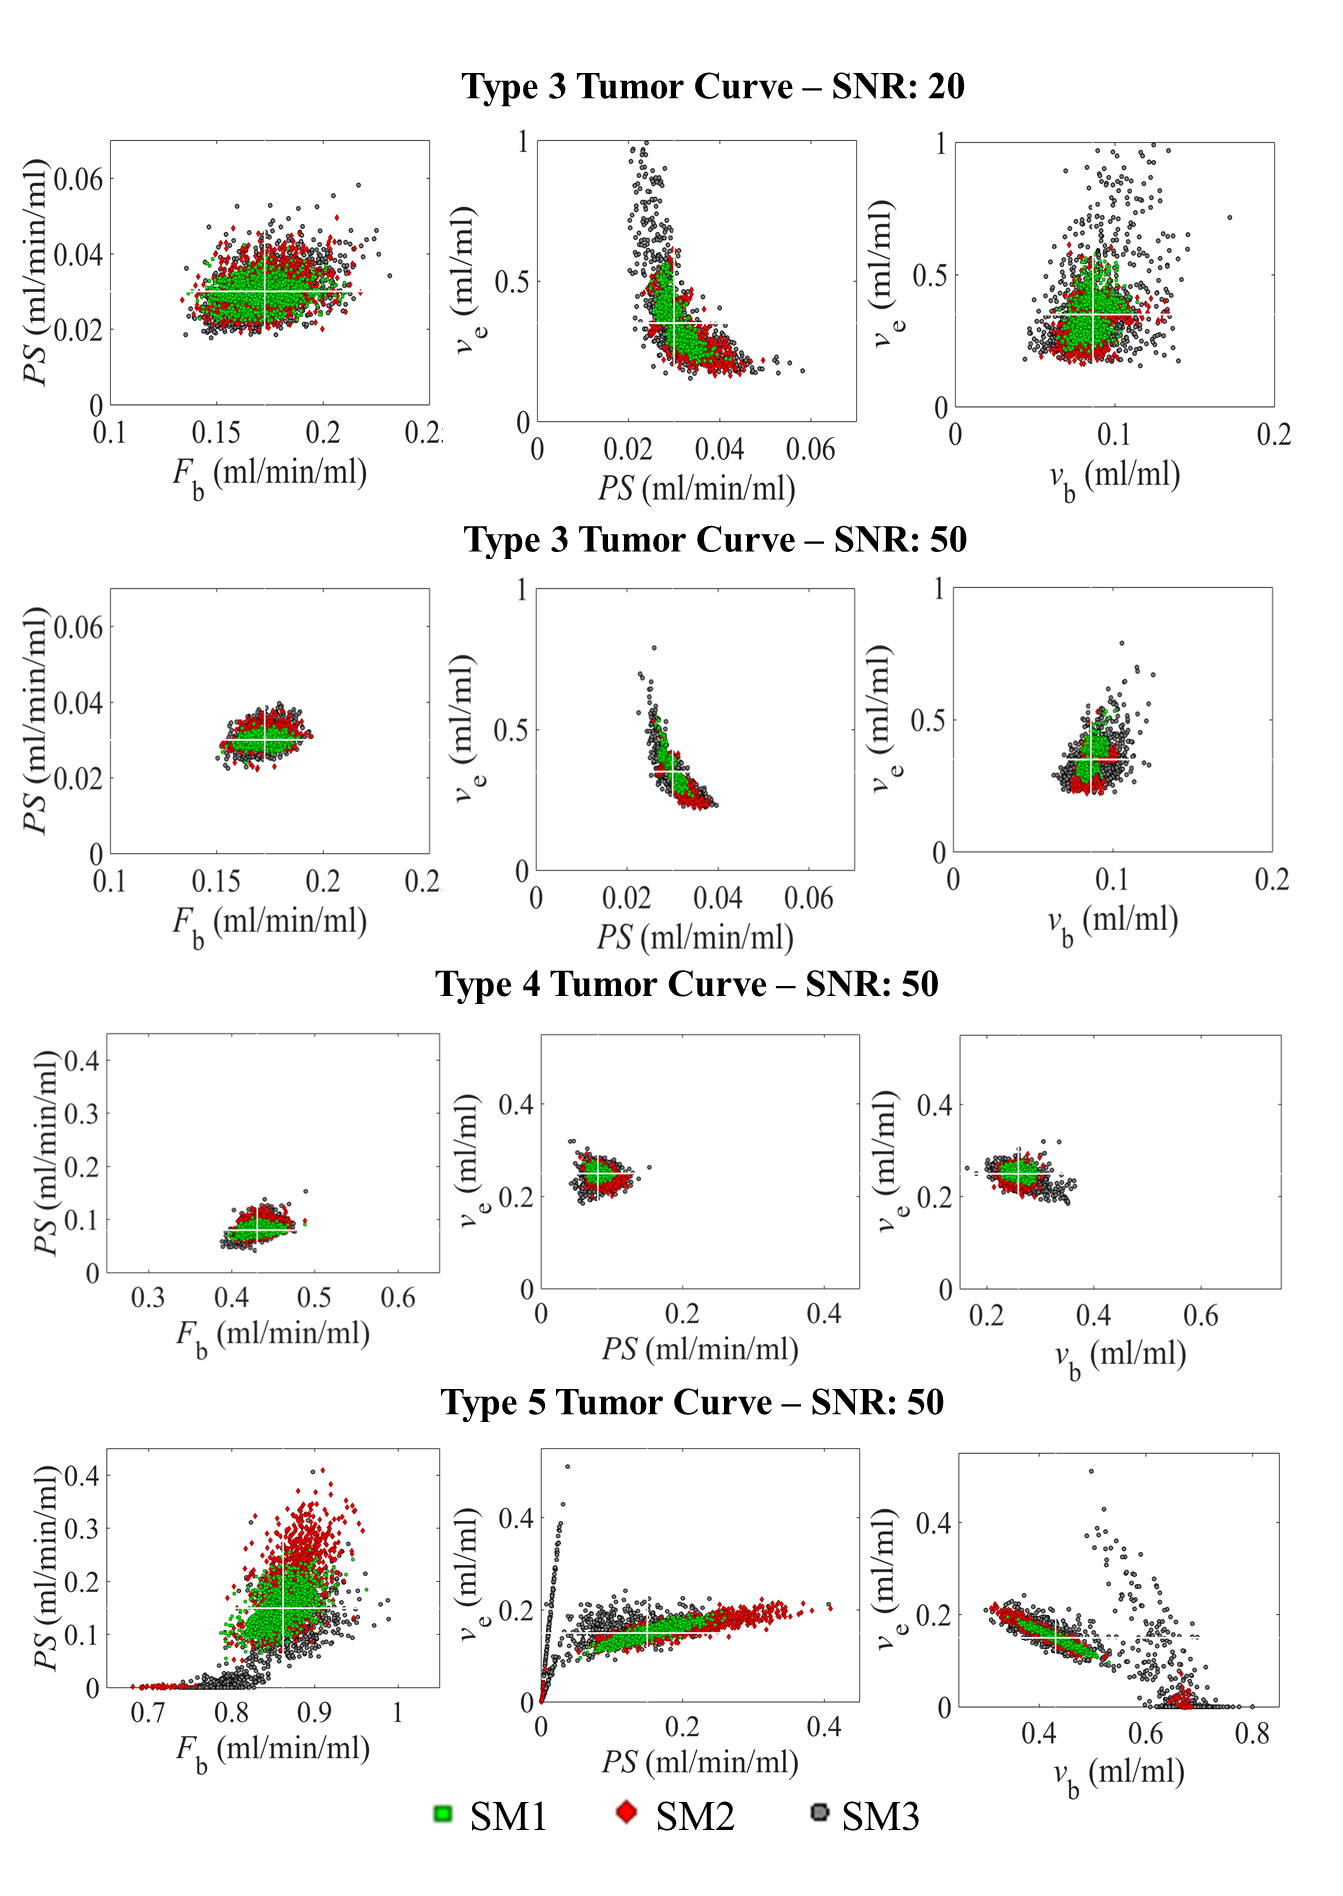
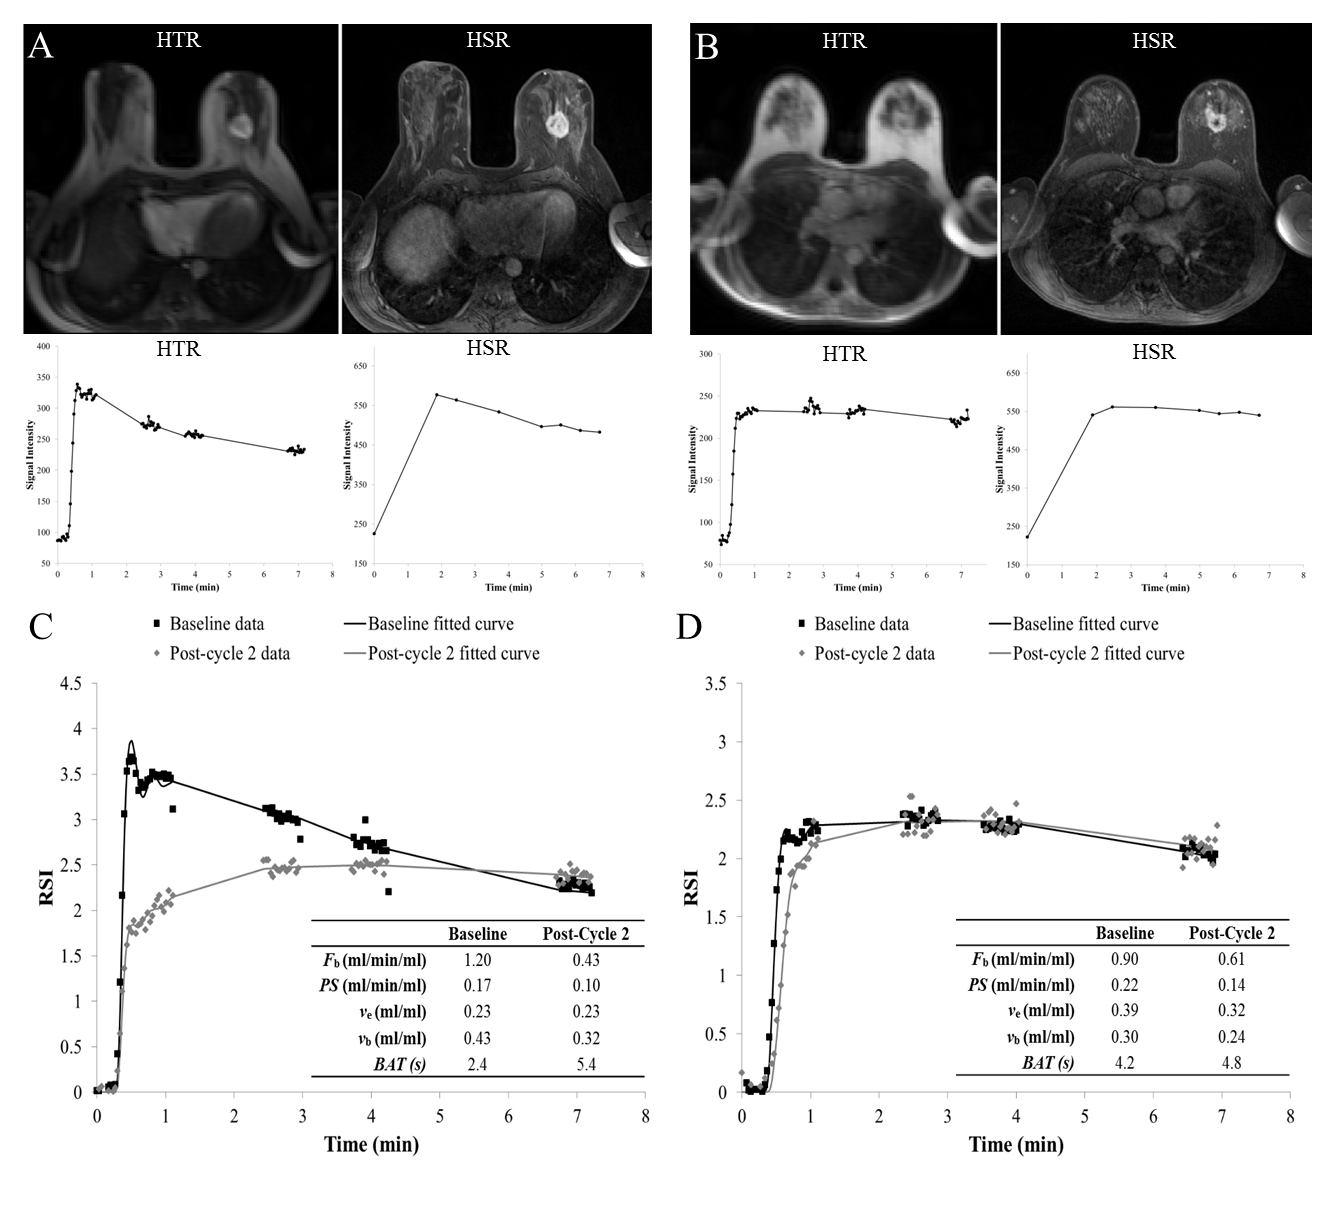
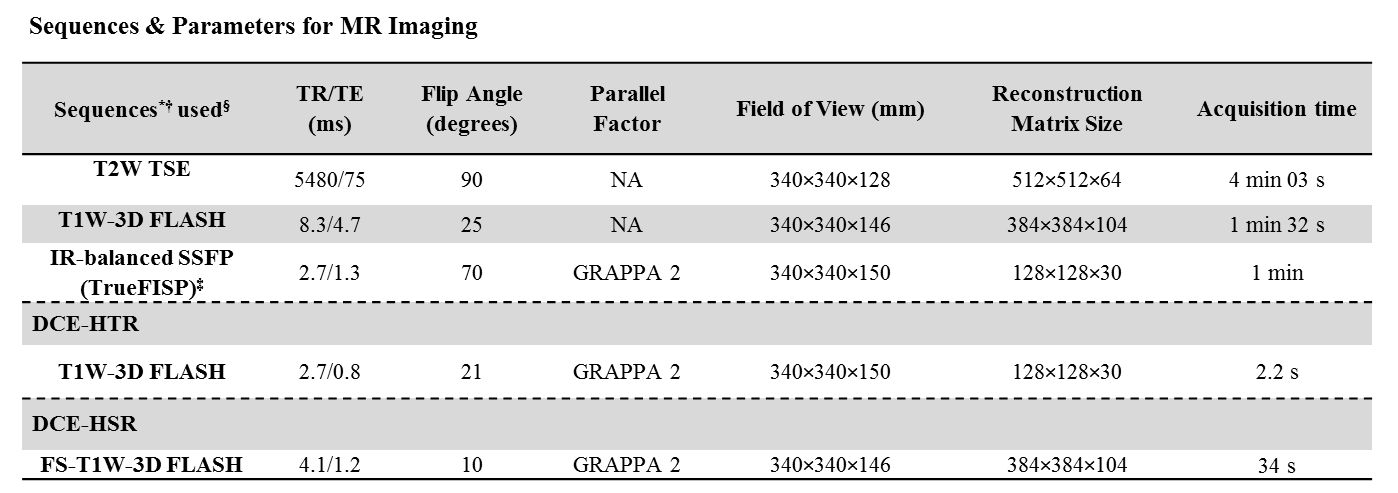
Table 1.*FLASH=fast low angle shot, FS=fat suppressed, GRAPPA=generalized auto-calibrating partially parallel acquisition, IR=inversion recovery, SSFP=steady-state free precession, T1W=T1-weighted, T2W= T2-weighted, TSE=turbo spin echo.
†All scans were performed in the transverse plane.
‡For the IR sequence an IR-TR of 3000ms was used at four inversion times; 400/680/1200/2000 ms.
§The protocol began with T2W TSE and T1W-3D FLASH sequences, followed by IR-balanced SSFP to measure the baseline T1,0 of tissues of interest. The DCE-HTR and DCE-HSR were acquired in an interleaved way as shown in Figure 1. The total dynamic scan was approximately 8 minutes (84 HTR and 8 HSR volumes).