2100
Dynamic contrast-enhanced MRI for uterine cervical cancer: correlations with clinical staging and pathologic types1Cancer Hospital, Chinese Academy of Medical Sciences, Beijing, People's Republic of China, 2GE Healthcare, MR Research China, Beijing
Synopsis
Tumor blood supply is closely related to the tumor occurrence, development, metastasis and prognosis. MRI is the optimal imaging method for investigating uterine cervical carcinoma, which provides excellent morphological information using conventional series. Additionally, the tumor perfusion information can be quantitatively assessed by dynamic contrast-enhanced MRI (DCE-MRI). DCE derived parameters include MaxSlop, CER, IAUGC, Ktrans, Kep and Ve. Our results showed mild negative correlation to clinical FIGO stage based on mean and maximum of Ktrans and Kep, increased minimum MaxSlop, and increased max- and mini-mum Ktrans in squamous cell carcinoma than those of adenocarcinoma. DCE-MRI is a significant supplement to provide valuable morphological information that contributes to clinical decision-making and prognosis prediction.
Purpose
To investigate the application of quantitative DCE-MRI in tumor pre-treatment staging, identification of pathological type and lymph node status in uterine cervical cancinoma.Methods
A total amount of 46 subjects were recruited , consisting of operation (n=19) and only biopsy (n=29) confirmed cervical cancer [FIGO stages: Ib in 18, IIa in 3, IIb in 16, IIIa in 1, IIIb in 8, IVa in 2; pathological types: squamous cell carcinoma in 41, adenocarcinoma in 5, adenosquamous carcinoma in 2; Lymph node status (N stage): positive in 7 and negative in 12. All the patients underwent DCE-MRI scanning before treatment on a 3.0T MR scanner (GE, Signa HDx, America) using LAVA-XV sequence. The mean, maximum and minimum values of the semi-quantitative and quantitative outputs of DCE-MRI were achieved, including MaxSlop, CER, IAUGC, Ktrans, Kep,Ve , generated by GenIQ software (GE). Spearman correlation analysis was performed to study the relationship between the parameters and FIGO stages. Independent t test was performed to investigate the pairwise differences in the parameters between the early and advanced stages, among different pathologic types and grades, and between N stages. ROC was explored to achieve the cutoff values of the parameters and to evaluate their roles in the diagnosis of advanced stages.Results
Mildly negative correlation was observed for tumor FIGO stages with mean and maximum Ktrans and Kep (r: -0.313 ~ -0.389, P: 0.006 ~ 0.030). Early stage (stage<IIb) exhibited increased values of in maximum Ktrans, mean and maximum Kep of tumor (P=0.007 ~ 0.037) than those of the advanced stages (stage≥IIb). ROC indicated that while setting threshold of maximum Kep less than 2.405min-1 for diagnosis of advanced stages, the specificity, sensitivity, positive predictive value (PPV), negative predictive value (NPV) and accuracy were 74.1%, 76.2%, 80.0%, 69.6% and 75.0% respectively, with an area under curve (AUC) of 0.721 (P=0.009). For tumors with different pathologic types, squamous cell carcinoma demonstrated increases of minimum MaxSlop, maximum and minimum Ktrans as compared to adenocarcinoma (P: 0.007 - 0.049). However, all the parameters displayed no correlation to tumor volume, and there was no observed statistical difference between those parameters in different pathological grades and N stages.Discussion and conclusion
The higher the tumor stage, the tumor is more prone to necrosis, cystic change and other secondary changes, which resulted in decreases of perfusion [1,2]. Higher DCE parameters indicated higher tumor perfusion, which was consistent to the knowledge that the cervical squamous cell carcinoma exhibited higher sensitivity to chemoradiotherapy and better prognosis compared to adenocarcinoma at the same tumor stage [3]. The results indicated that semi-quantitative and quantitative parameters from the pharmacokinetics model of DCE-MRI could contribute to the characterization of the stages and pathology in uterine cervical cancer.Acknowledgements
No acknowledgement found.References
1. Semple SI, et al. A combined pharmacokinetic and radiologic assessment of dynamic contrast-enhanced magnetic resonance imaging predicts response to chemoradiation in locally advanced cervical cancer. Int J Radiat Oncol Biol Phys 2009;75(2):611-7.
2. McVeigh PZ, et al. Diffusion-weighted MRI in cervical cancer, Eur Radiol, 2008, 18(5): 1058–1064.
3. Kaur H, Silverman PM, Iyer RB, Verschraegen CF, Eifel PJ, Charnsangavej C. Diagnosis, staging, and surveillance of cervical carcinoma. AJR Am J Roentgenol 2003;180(6):1621-31.
Figures
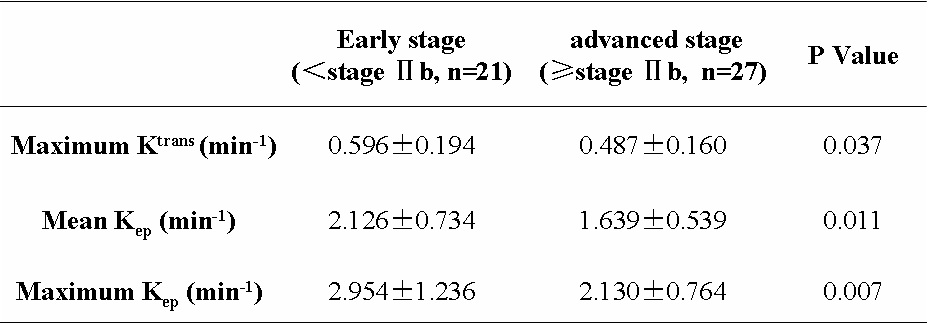
Comparisons of CE parameters between different stages of tumor.
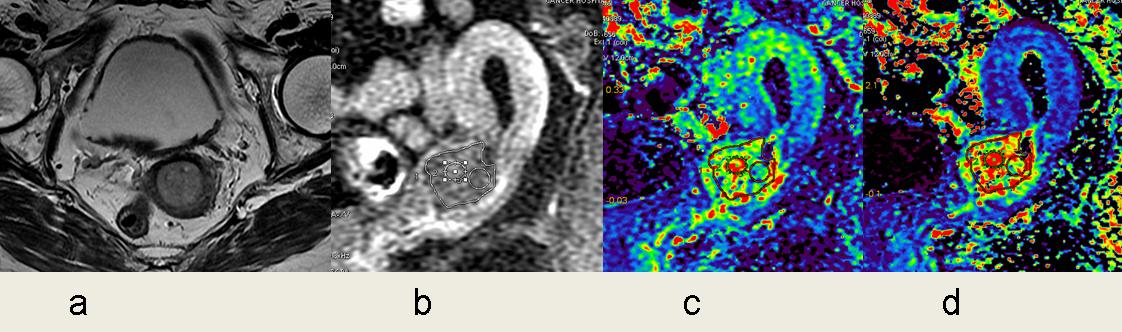
Uterine cervical carcinoma in stage Ib. Axial T2WI (a) showed the uterine mass with slightly higher signal intensity, while the entire stoma ring around the mass demonstrated lower signal intensity. Delayed phase on DCE (b) showed enhanced tumor and ROI depiction. The Ktrans map (c) and Kep map (d) acquired the maximum Ktrans of 0.583 min-1, mean Kep of 1.896 min-1, and maximum Kep of 2.710min-1, respectively.
Comparisons of DCE parameters between different stages of carcinoma.
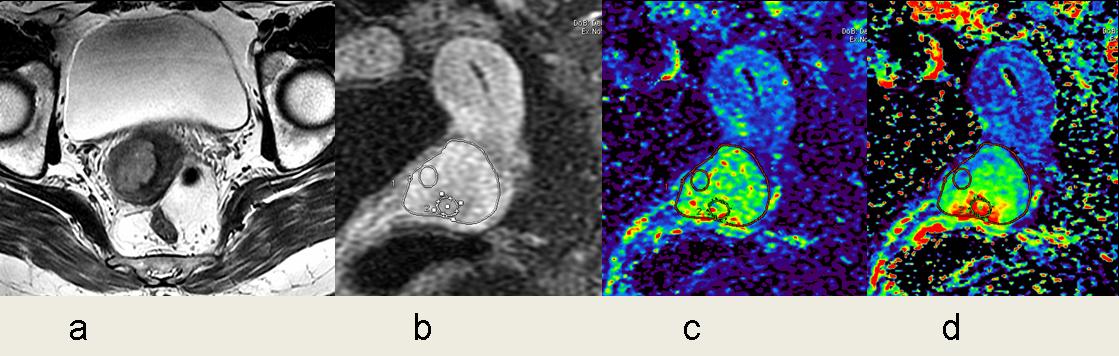
Uterine cervical carcinoma in stage IIb. Axial T2WI (a) displayed that the uterine mass had slightly high signal intensity, which invaded the right parametrium. Delayed phase on DCE (b) showed enhanced tumor and ROI depiction. The Ktrans map (c) and Kep map (d) acquired the maximum Ktrans of 0.429min-1, mean Kep of 1.029 min-1, and maximum Kep of 1.830 min-1, respectively.
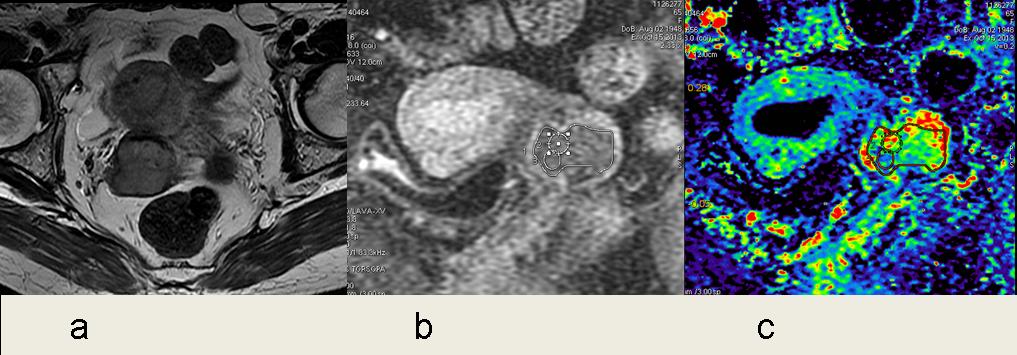
Comparison of DCE parameters between different pathological types.
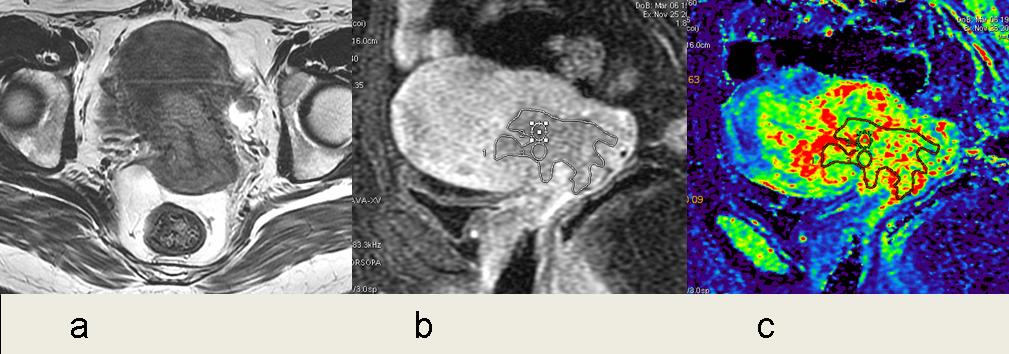
Uterine cervical squamous cell carcinoma in stage IIb. Axial T2WI (a) showed the uterine mass with slightly higher signal intensity in which invaded the bilateral parametrium. Delayed phase on DCE (b) showed enhanced tumor and the ROI depiction. The Ktrans map (c) acquired the maximum Ktrans of 0.551min-1, min Ktrans of 0.349min-1, respectively.
Comparisons of DCE parameters between different pathological type.
Uterine cervical adenocarcinoma in stage IIb. Axial T2WI (a) showed the uterine mass with slightly higher signal intensity in which invaded the bilateral parametrium. Delayed phase on DCE (b) showed enhanced tumor and the ROI depiction. The Ktrans map (c) acquired the Maximum Ktrans of 0.187min-1, min Ktrans of 0.081min-1, respectively.