2099
Usefulness of Subtracted Images from 4 Minutes to 1 Minute in Dynamic Contrast-enhanced (DCE) Magnetic Resonance (MR) Imaging for Prostate Cancer; Pilot Study1Radiology, Kyung Hee University Hospital, College of Medicine, Kyung Hee University, Seoul, Korea, Republic of, 2Department of Biomedical Engineering, College of Electronic Information Engineering, Kyung Hee University, Korea, Republic of
Synopsis
The purpose of our study is to assess the usefulness of subtracted images from 4-1 min in DCE MR imaging for the prostate cancer diagnosis. Subtracted images from 4-1 min were assessed for the visual washout scores of prostate cancer and normal PZ, and compared with the time-contrast media curve patterns in each patient. A subtraction image set of DCE MRI 4-1 min mirrored time - concentration curve patterns of DCE MR imaging in prostate cancer and normal PZ. This subtraction image set can be a more simple method to display the DCE characteristics without any additional post-processing.
Background
Dynamic contrast-enhanced MR imaging is one technique of multiparametric MRI for the prostate cancer evaluation. It usually evaluates tumor angiogenesis and estimates the treatment response. Quantitative analysis have been done by various pharmacokinetic models. It usually reflects the contrast concentration within the tissue. However, there are discrepancies in results because of various models and analysis techniques. Meanwhile, qualitative and visual assessment is usually done with subtraction images. These images are made by elimination of precontrast images from postcontrast images because of hemorrhage after prostate biopsy. However, scrolling up and down to assess all the subtraction images is not handy in daily practice. The hypothesis of this study is that a single image set of subtracted images from 4 min to 1min (not precontrast) can show the difference patterns of cancer enhancement and more handy in daily practice (Fig. 1).Purpose
The purpose of this study is to assess the usefulness of the subtracted image set from 4 minutes to 1 min in DCE MRI for the prostate cancer diagnosis.Materials and Methods
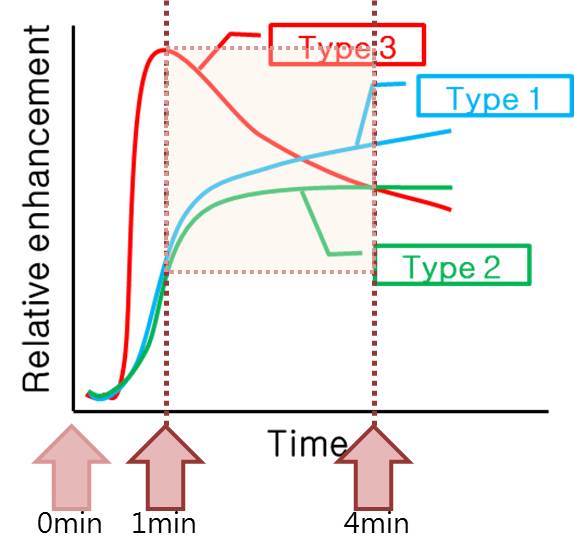
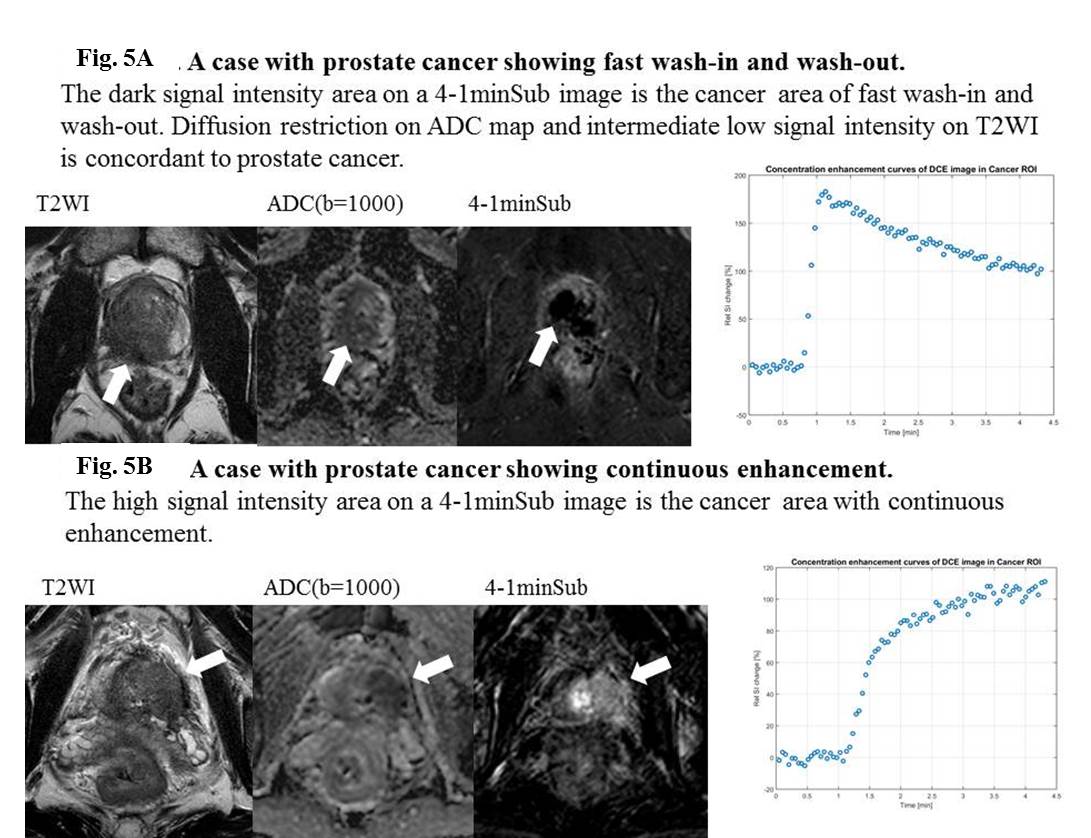
Thirty-nine consecutive patients who underwent MR imaging for the prostate from July in 2015 to February in 2016 were enrolled in this retrospective study. MR protocols included T2WI, DWI/ADC maps, DCE images (84 dynamics for 4 minutes), and a single set of subtracted images from 4 min to 1min (4-1minSUB images) instead of full sets of subtracted images of precontrast stage. Two radiologists assessed PI-RADS category of the prostate cancer based on the reference standard of T2WI, DWI/ADC maps, evaluated the washout degrees of the prostate cancer by using 4-1minSUB images and scored 0~3 points (0, invisible; 1, indistinct; 2, fair; 3, excellent) in consensus. One of reviewer drew region interest (ROI) in 4-1minSUB images on the area regarded as the cancer and normal peripheral zone (PZ) in each patient according to the pathology report as a reference standard. The time-concentration curves of ROI of cancer and normal PZ were made with full data sets of DCE images in each patient by using commercialized software (Nordic ICE). The curve pattern was divided into three groups; 1, continuous wash-in; 2, wash-in and plateau; and 3, fast wash-in and wash-out. Peak enhancement time, and slope of wash-in and wash-out were also assessed in each patient. The visual washout scores of the cancer and normal PZ were compared with curve patterns. One-way ANOVA test, Mann-Whitney U test and Spearman test were used for the comparison among the curve patterns and visual washout scores in prostate cancer and normal PZ by using IBM SPSS statistics ver. 21.Results
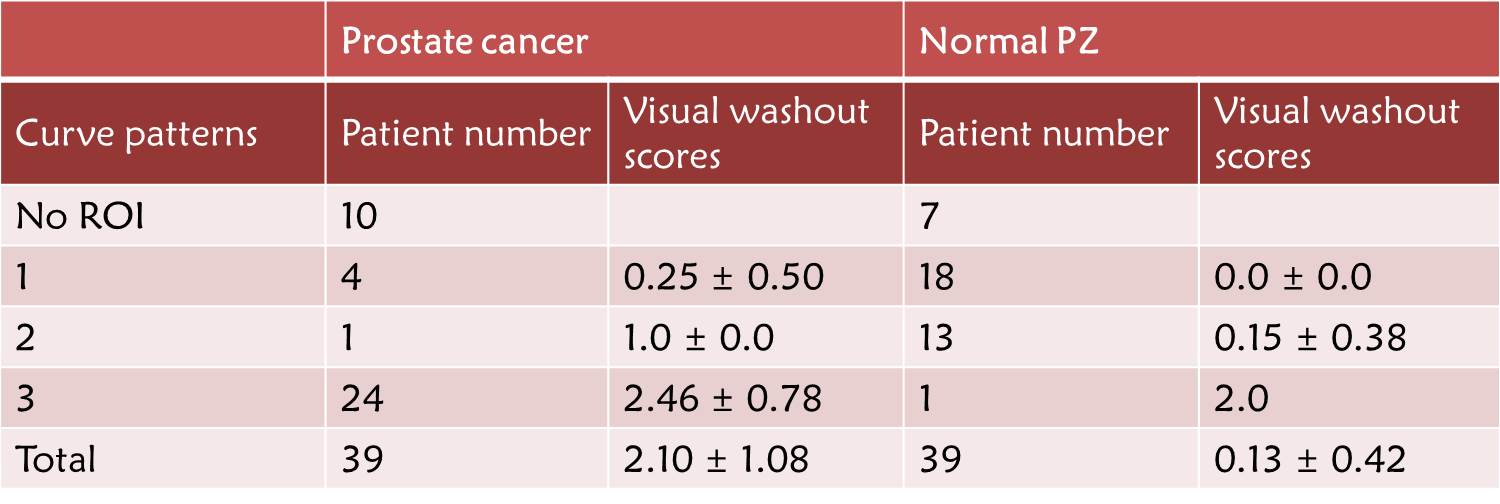
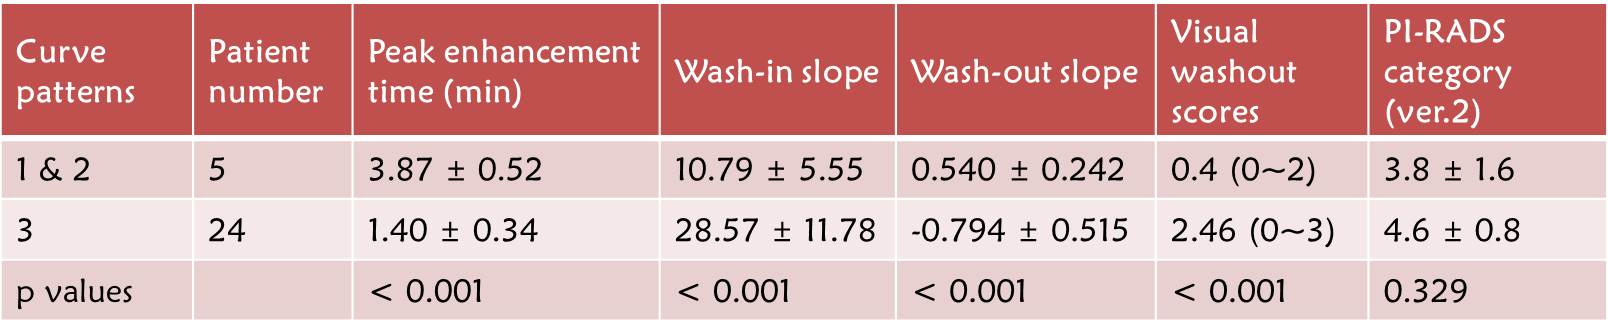
ROIs of prostate cancer and normal PZ were drawn in 30 and 32 patients, respectively. There was no visible cancer in 9 patients (PI-RADS category 1). Fig 2 shows the visual washout scores in prostate cancer and normal PZ. Three kinds of curve patterns in prostate cancer and normal PZ showed significantly different visual washout scores. In Fig 3, there was statistically significant difference of visual washout scores between benign curve patterns (curve pattern 1 and 2) and malignant curve pattern (curve pattern 3). There was a significant positive correlation between curve pattern and visual washout scores in prostate cancer (Spearman's rho, 0.654, p <0.001). Normal PZ also showed significant positive correlation between curve pattern and visual washout scores (Spearman's rho, 0.439, p = 0.012).
Conclusions
In conclusion, a subtraction image set of DCE MRI from 4 min to 1 min mirrored time - contrast media concentration curve patterns of DCE MR imaging in prostate cancer and normal PZ. This subtraction image set can be a more simple method to display the DCE characteristics without any additional post-processing. Therefore, this modified subtraction image set of DCE MRI may replace the curve pattern analysis.Acknowledgements
This research was supported by the National Research Foundation of Korea(NRF) grant funded by Ministry of Science, ICT, and Future planning (MSIP) of the Korea government ()(2016R1C1B1013368).
References
1. Ocak I, Bernardo M, Metzger G, Barrett T, Pinto P, Albert PS, Choyke PL., AJR Am J Roentgenol. 2007 Oct;189(4):849.
2. Franiel T, Hamm B, Hricak H., Eur Radiol. 2011 Mar;21(3):616-26.
3. Kim JK1, Hong SS, Choi YJ, Park SH, Ahn H, Kim CS, Cho KS., J Magn Reson Imaging. 2005 Nov;22(5):639-46.
4. Gemeinhardt O1, Lüdemann L, Prochnow D, Abramjuk C, Taupitz M, Hamm B, Beyersdorff D., Rofo. 2005 Jul;177(7):935-9.
5.Bonekamp D1, Macura KJ., Top Magn Reson Imaging. 2008 Dec;19(6):273-84.
Figures