2098
Differentiation of Fat-Poor Renal Angiomyolipoma from Other Renal Tumors with Low Signal Intensities on T2-weighted MR Image1Radiology, Anam Hospital, Korea University College of Medicine, Seoul, Korea, Republic of
Synopsis
A low T2 signal intensity is a well-known feature of fat-poor angiomyolipoma and papillary renal cell carcinoma. However, many other renal tumors showing low T2 signal intensity are encountered in daily practice. So, a low T2 signal intensity is not a pathognomonic finding for fat-poor angiomyolipoma and papillary RCC. Even though renal mass biopsy might be considered to establish a diagnosis for tumors without typical imaging features of renal cell carcinoma, the decision to biopsy or not sometimes seems to be difficult in small renal tumors. Accurate MR imaging characterization of renal masses is essential for ensuring appropriate management and avoiding unnecessary surgical procedure.
Purpose
The purpose of this study was to assess
whether MRI including diffusion-weighted imaging can differentiate fat-poor angiomyolipoma
(AML) form other renal tumors showing low signal intensity on T2-weighted MR image
(T2WI).Materials and Methods
We retrospectively evaluated 51 patients
with pathologically proven renal tumors showing low signal intensity on T2WI
(13 AMLs, 19 clear cell renal cell carcinomas [RCCs], 11 papillary RCCs, 7
oncocytomas). The signal intensity (SI) of each renal mass, normal renal cortex
and spleen on T2WI was used to calculate tumor-to-kidney SI ratio (SIR) and
tumor-to-spleen SIR. Mean ADC values from each tumor and normal renal cortex
were measured to calculate tumor-to-kidney ADC ratio (ADCR). Receiver operating
characteristic (ROC) curve analysis was used to evaluate the ability of SIR on
T2WI and ADCR in differentiating fat-poor AML from other renal tumors.
Results
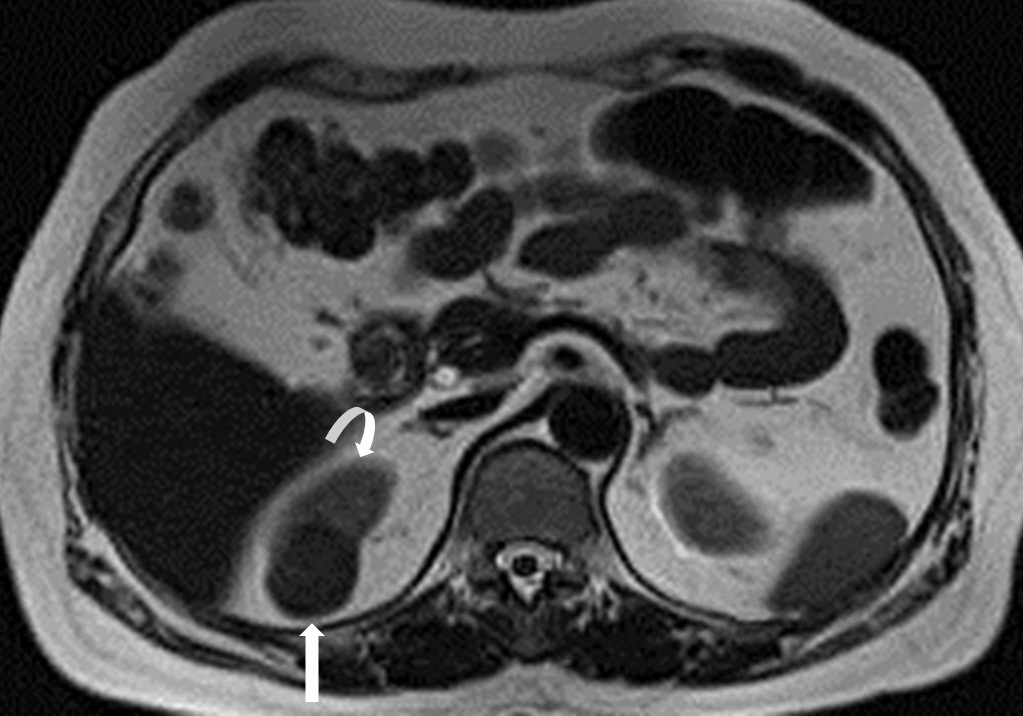
The tumor-to-kidney SIR and tumor-to-spleen
SIR were significantly lower in fat-poor AML (63±12% and 71±21%, respectively; p < 0.037) (Fig. 1) than in other renal tumors
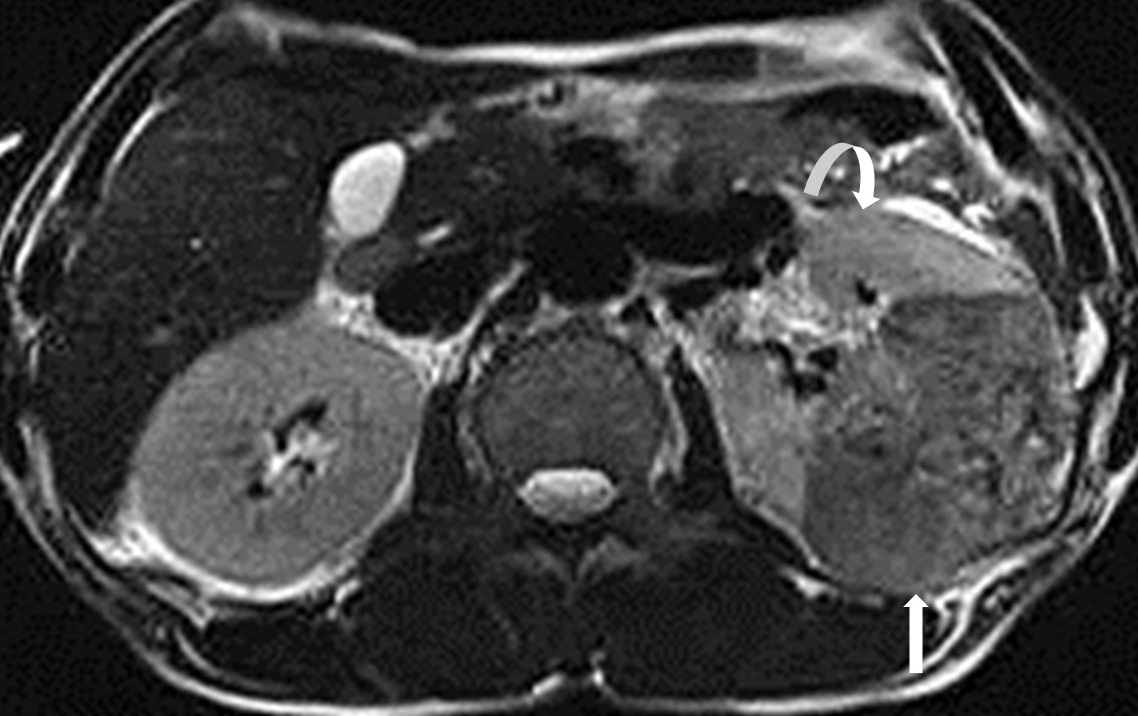
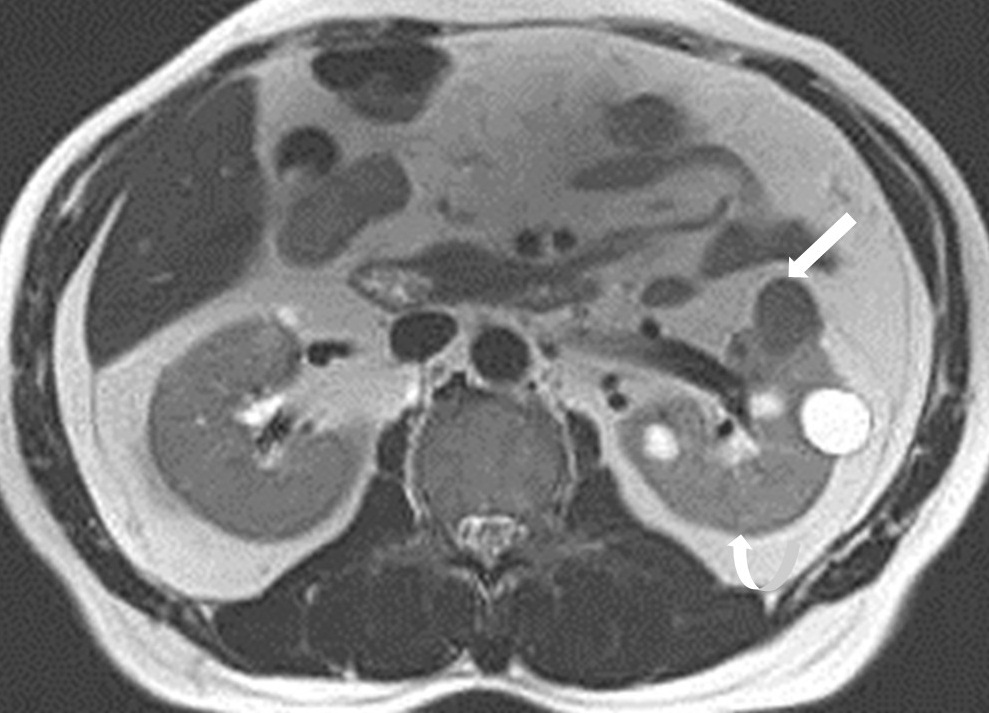
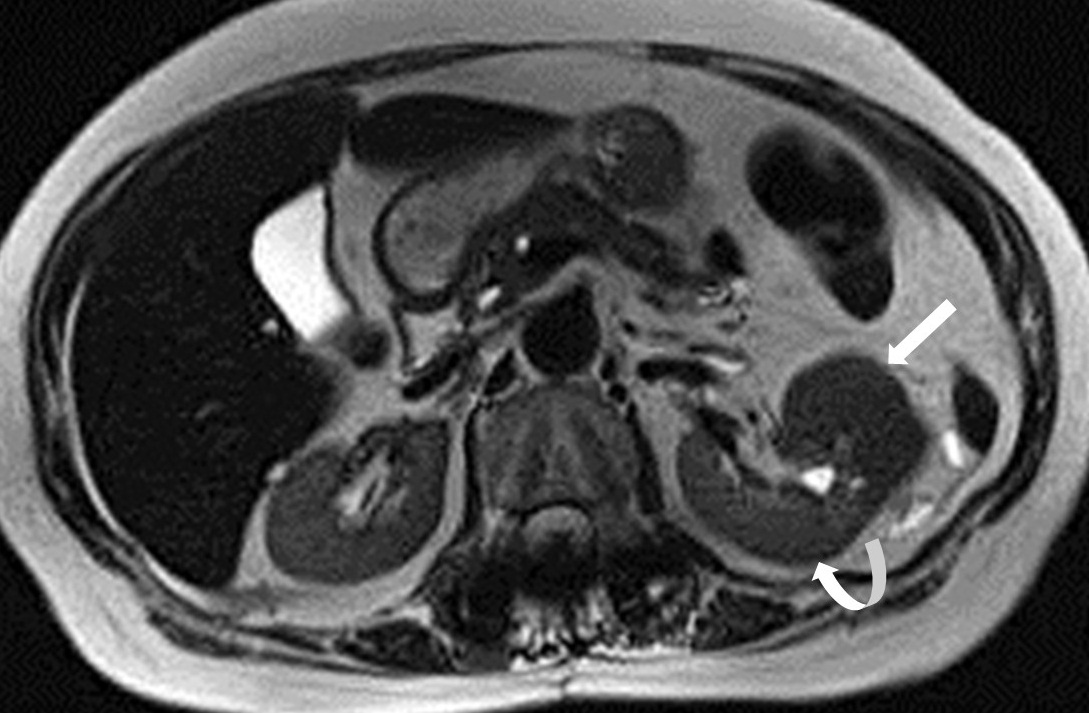
(clear cell RCC, 81±15% and 83±16%; papillar RCC, 73±12% and 79±20%; oncocytoma, 81± 16 % and 83±13 %, respectively)
(Figs. 2-4). There was no significant difference in the tumor-to-kidney ADCR
between fat-poor AML and other renal tumors (fat-poor AML, 62±15%; clear cell
RCC, 73±21%, papillary RCC, 67±17%, oncocytoma, 72±11%, p=0.27). For
differentiating fat-poor AML from other renal tumors, the areas under the ROC
curves of tumor-to-kidney SIR and tumor-to-spleen SIR were 0.836 and 0.797,
respectively (p = 0.041): a cutoff value of tumor-to-kidney SIR with 68.7% and tumor-to-spleen
SIR with 84% resulted in sensitivities and specificities of 87% and 72%, and
82% and 67%, respectively.Discussion
Because the intramuscular actin, myosin and
collagen with decreased extracellular fluid possess the T2-shortening effects,
fat-poor AMLs show low signal intensity on T2WI 1,2. But, several renal
masses may present low signal intensity on T2WI by the tumor itself including papillary
architecture, hypocellularity with abundant protein-containing tissue fluid, and
high nucleus-to-cytoplasm ratio or associated conditions such as hemorrhage,
necrosis or calcification 3-5. Chung et al reported that fifty-two
percent of hypointense renal masses (cutoff value of tumor-to-kidney SI ratio,
1) were non-AMLs, including papillary RCC, clear cell RCC, and other renal
tumors 2. We postulated that the condensed smooth muscle component in
fat-poor AML would give rise to more prominent. T2 shortening effect than tumoral
architecture, cellulariyy and other associated conditions. Conclusion
Tumor with much lower SI on T2WI relative
to renal parenchyma suggested fat-poor AML. Tumor-to-kidney SIR less than 68% may
obviate the need for either diagnostic biopsy or immediate surgical treatment
for the renal tumors with low signal intensities on T2WI.
Acknowledgements
No acknowledgement found.References
1. Misra LK, Kim EE, Hazlewood CF, Todd LE, Elizondo-Riojas G. Characterization of skeletal muscles by MR imaging and relaxation times. Physiol Chem Phys Med NMR. 1990;22(4):219-228.
2. Chung MS, Choi HJ, Kim MH, Cho KS. Comparison of T2-weighted MRI with and without fat suppression for differentiating renal angiomyolipomas without visible fat from other renal tumors. AJR Am J Roentgenol 2014;202(4):765-771.
3. Choi HJ, Kim JK, Ahn H, Kim CS, Kim MH, Cho KS. Value of T2-weighted MR imaging in differentiating low-fat renal angiomyolipomas from other renal tumors. Acta Radiol 2011;52(3):349-353.
4. Oliva MR, Glickman JN, Zou KH, Teo SY, Mortele KJ, Rocha MS, et al. Renal cell carcinoma: T1 and T2 signal intensity characteristics of papillary and clear cell types correlated with pathology. AJR Am J Roentgenol 2009;192(6):1524-1530.
5. Shinmoto H, Yuasa Y, Tanimoto A, Narimatsu Y, Jinzaki M, Hiramatsu K, et al. Small renal cell carcinoma: MRI with pathologic correlation. J Magn Reson Imaging 1998;8(3):690-694.
Figures