2094
Computer-Aided Diagnosis of Prostate Cancer on Multiparametric MRI: the Application for Cancer Localization1Peking University First Hospital, Beijing, People's Republic of China, 2Philips Healthcare, Suzhou, People's Republic of China
Synopsis
Multiparametric MRI (mpMRI), including T2WI, DWI/ADC and DCE, is becoming a promising noninvasive tool for prostate cancer (PCa) detection, localization and stage. Although PI-RADS has provides recommendations for image reading and reporting, the interpretation of mpMRI is still challenging for clinical work, for poor interobserver agreement and strong experience dependence. We therefore developed a machine learning model that combines features derived from mpMRI for PCa detection and localization. The model predicted the transition zone (TZ) and peripheral zones (PZ) separately and compared with whole-mount step-section slide. The computer-aided diagnosis (CAD) achieved excellent performance both in PZ and TZ.
Introduction
MRI has shown great potential in prostate cancer (PCa) localization and grading.1,2 But without standardized analytic tools, subjective interpretation of multiparametric MR (mpMRI) images depends on radiologists’ experience and expertise, thereby limiting the accuracy and reproducibility of PCa detection.3 In this study, we developed an applicable computer-aided diagnosis (CAD) system for prostate cancer localization that combines features derived from mpMRI, and evaluated the performance of this system.Materials and Methods
Study population:
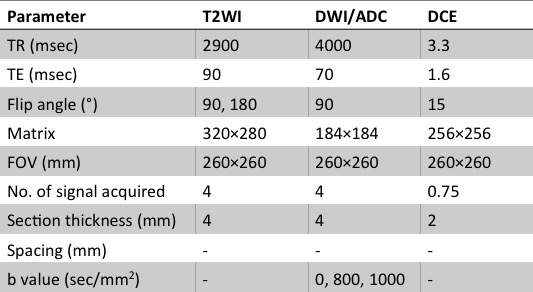
Our institution’s ethics review board approved this retrospective study. Between June 2012 and October 2015, 47 patients (mean age 66±7 years, range 49-76 years) were included. All enrolled patients had biopsy-proved PCa and underwent radical prostatectomy after prostate mpMRI. All the MR examinations were carried out on a 3.0 Tesla clinical MR scanner ( Achieva, Philips Medical System, Best, the Netherlands), using a abdominal phased-array coil. The imaging sequence parameters are summarized in Table 1.
Data Analysis:
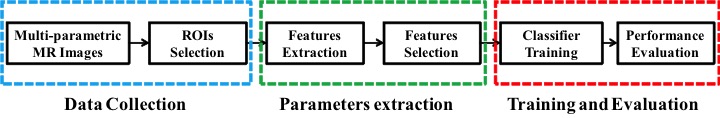
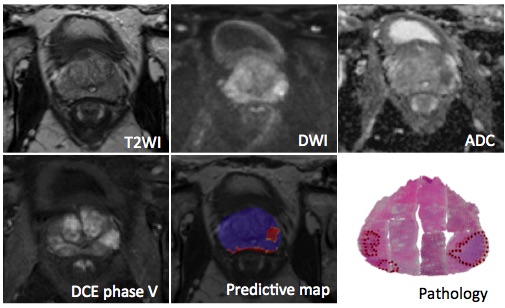
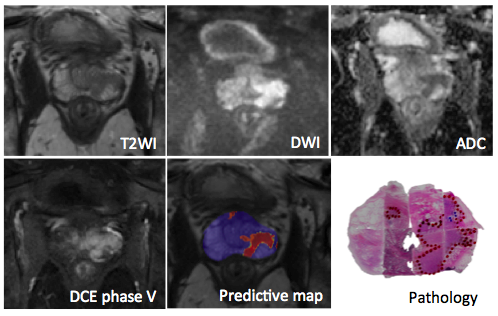
The general data flow diagram of this CAD system can be presented in Fig.1. In each case, the radiologist manually drew regions of interest (ROIs) of PZ and TZ tumor foci, as well as a normal focus. Before analysis, T2-weighted images were standardized to correct for background and nonlinearity of the MR image intensity scale. After that, modified T2 values and features derived from gray-level histogram and co-occurrence matrix (GLCM) were extracted from T2-weighted images. For the DW images, apparent diffusion coefficient (ADC) values were calculated using the b = 0 and 1000 s/mm2 images. And for the DCE images, semi-quantitative features were calculated from the DCE series. All of the features above were used to be the inputs of the artificial neural network (ANN) classifier. Subsequently a predictive map is generated on which the trained ANN classifier is performed.
Statistical Analysis:
We evaluated the effectiveness of this CAD system in differentiation of PCa foci from non-cancerous ROIs with the receiver operating characteristic (ROC) analysis. During the training and evaluation process, ROIs in the PZ and TZ were analyzed separately. Leave-one-patient-out cross-validation method was used to separate the dataset into a training set and a test set.
Results
532 ROIs were selected from the PZ (330 PCa and 202 non-PCa), and 410 ROIs were selected from the TZ (220 PCa and 190 non-PCa) were enrolled in this study. The proposed CAD system achieved high areas under ROC curve (AUC) of 0.929 ± 0.018 and 0.901 ± 0.027 for PZ and TZ, respectively. The accuracy was 0.911 for PZ and 0.883 for TZ.Discussion/Conclusion
This retrospective study suggests that this CAD based on multi-parametric MR images can be effective in localization of prostate cancer. On account of the accuracy of this system, it appears to be a promising method for identification of clinically relevant prostate cancer for either MR-guided biopsy or focal therapy.Acknowledgements
No acknowledgement found.References
1. Kitajima K, Kaji Y, Fukabori Y et al. Prostate cancer detection with 3 T MRI: comparison of diffusion-weighted imaging and dynamic contrast-enhanced MRI in combination with T2-weighted imaging. J Magn Reson Imaging, 2010, 31: 625-631
2. Tanimoto A, Nakashima J, Kohno H et al. Prostate cancer screening: the clinical value of diffusion-weighted imaging and dynamic MR imaging in combination with T2-weighted imaging. J Magn Reson Imaging, 2007, 25: 146-152
3. Peng Y, Jiang Y, Yang C et al. Quantitative analysis of multiparametric prostate MR images: differentiation between prostate cancer and normal tissue and correlation with Gleason score--a computer-aided diagnosis development study. Radiology, 2013, 267: 787-796
Figures