2090
The predictive value of preoperative examination in differenciating high and low Gleason score of radical prostatectomy specimens1Peking University First Hospital, Beijing, People's Republic of China
Synopsis
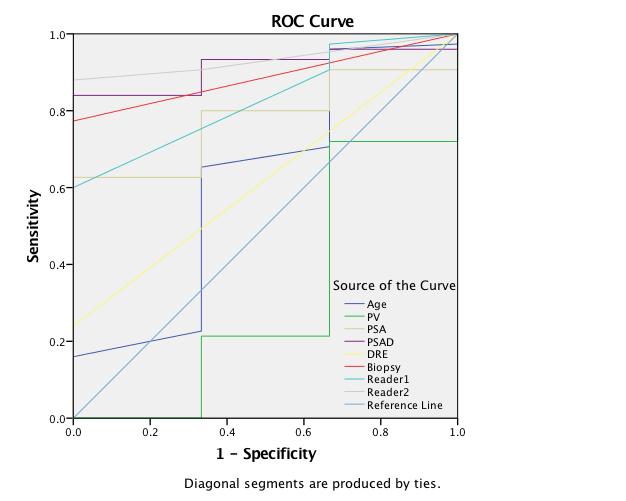
To evaluate the value of different preoperative examniations in differenciating high/low Gleason score, prostate volumev(PV), PSA, PSA density (PSAD), DRE, multiparametric MRI (mpMRI) and transrectal ultrasound guided biopsy were analyzed. The area under curve (AUC) of PSAD was 0.911 with the cut-off level of 0.25, which was even better than biopsy(AUC=0.887). MpMRI performed good diagnostic accuracy according to PI-RADS v2 by Reader 1(AUC=0.831) and 2(AUC=0.933).
Introduction
One condition of active sueveillance is Gleason score less than 6, and 20–60% of prostate cancer proven GS≤6 by biopsy are upgraded to GS≥7 postoperatively. So it is important to improve the accuracy of GS prediction. This study was to determine the performance of different preoperative examination values in distinguishing high and low GS, including age, prostate volumev(PV), PSA, PSA density (PSAD), DRE, multiparametric MRI (mpMRI) and transrectal ultrasound guided biopsy.
Materials and Methods
From 2014 to 2015, 78 men underwent 3 Tesla prostate magnetic resonance imaging (MRI) were enrolled in this retrospective study. Inclusion criteria were (a) the latest PSA level and DRE before prostate MRI; (b) systematic prostate biopsy-proven prostate cancer; (c) 3 TMRI within 6 months from biopsy and prostatectomy and (d) no any treatment including endocrine or radiotherapy. The MRI protocol included T1-weighted imaging (T1WI), T2-weighted imaging (T2WI), DWI (b-values 0 and 1000 s/mm2) and dynamic contrast–enhanced (DCE) imaging. DWI was acquired using a 2D singleshot EPI spin-echo DWI sequence. ADC maps were generated using linear reconstruction. Two readers with 5 and less than 1 years of experience in prostate MRI reviewed all scans on PACS using PI-RADS v2. Readers were blinded to any cilinical or histopathological data. PV was calculated by using the formula: 0.52 × transverse × anteroposterior × superoinferior diameter, which were measured on T2WI by Reader 1. PSAD was defined as the ratio of PSA to PV. The standard was according to radical prostatectomy pathology determined a high (≥7) or low (6) Gleason score. Receiver-operating characteristic (ROC) curve analyses were used to compare the ability of age, PV, PSA, PSAD, DRE, mpMRI and biopsy to predict high GS. Reader agreement concordance was analyzed by using Kappa test (the agreement considered kappa 0.4 was considered as bad, kappa 0.4-0.75 was moderate, kappa≥0.75 was good). A P value less than 0.05 was considered statistically significant.Result
The mean age was 65.9 years (range 43-80) and mean PSA was 18.9 ng/ml (range 1.57-111.0). The rate of abnormal DRE was 18/78 (23.1%). The mean volume of prostate gland was 38.1 cc (range 11.1-127.6), and the mean PSAD was 0.59 ng/ml/V (range 0.02-3.46). The biopsy needle cores were 6-16, and the positive cores were 1 to 14 (6.3%-100%). Gleason score of biopsy were as follows: 3+3 (n=20, 25.6%), 3+4 (n=25, 32.1% ), 4+3 (n=12, 15.4% ), 3+5 (n=1, 1.3%), 4+4 (n=9, 11.5% ), 4+5 (n=8, 10.3%), and 5+4 (n=2, 2.6% ), 5+5 (n=1, 1.3%). Seventy-eight prostatectomy specimens included 33 transition zone cancers and 44 peripheral zone cancers. Gleason score were as follows: 3+3 (n=3, 3.8%), 3+4 (n=40, 51.3% ), 4+3 (n=15, 19.2% ), 3+5 (n=1, 1.3%), 4+4 (n=4, 5.1% ), 5+3 (n=2, 2.6% ), 4+5 (n=9, 11.5%), and 5+4 (n=3, 3.8% ), 5+5 (n=1, 1.3%). Reader-1 detected 75 suspicious foci on MRI, PI-RADS score were as follows: 2(n=3, 3.8%), 3 (n=5, 6.4%), 4 (n=25, 32.1%), and 5 (n=45, 57.7%). Reader-2 detected 69 suspicious foci on MRI, PI-RADS score were as follows: 2 (n=9, 11.5%), 3 (n=3, 3.8%), 4 (n=24, 30.8%), and 5 (n=42, 53.8%). The diagnostic concordance of the two radiologists was moderate (kappa=0.561, p<0.001). The AUCs of Reader 1 and 2 for predicting high and low GS grade were 0.831 and 0.933. The AUCs of age, prostate volume, PSA, PSAD, DRE and biopsy were 0.613, 0.311, 0.778, 0.911, 0.620 and 0.887, respectively. The best cut-off value of PSAD was 0.25 ng/ml/V.Discussion and Conclusion
PSAD, biopsy and mpMRI were proved to be preferred among preoperative examniations. PSAD was the most effective means to predict high/low GS, with the cut-off level of 0.25 ng/ml/V. Seventeen of biopsy-proven low grade PCa (22.1%) was upgraded in prostatectomy. PI-RADS v2 showed better accuracy in the inexperienced reader and the inter-observer aggreement need to be improved. In the clinical process, PSAD may be an important factor in the consideration of management and should not be ignored. And further study also need to to test and verify the value of PSAD.Acknowledgements
No acknowledgement found.References
1. Park SY, Oh YT, Jung DC, et al. Diffusion-weighted Imaging (DWI) Predicts Upgrading of Gleason Score in Biopsy-proven Low-grade Prostate Cancers. BJU Int. 2016,28. doi: 10.1111/bju.13436. 2. Weinreb JC, Barentsz JO, Choyke PL, et al. PI-RADS Prostate Imaging-Reporting and Data System: 2015, Version 2. Eur Urol. 2016,69(1):16-40. doi: 10.1016/j.eururo.2015.08.052.Figures