2089
The Value of Apparent Diffusion Coefficient Map based on PI-RADS v2 in Predicting Clinically Significant Prostate cancer1Peking University First Hospital, Beijing, People's Republic of China
Synopsis
To determine the value of ADC map in identifying clinically significant prostate cancer, the ADC PI-RADS scores and mean ADC values of index lesion based on PI-RADS v2 were measured. ADC PI-RADS score may be good as overall PI-RADS v2 score in predicting clinically significant PCa. The clinically significant cancers had higher ADC scores and lower ADC values. An ADC value of 619-889×10-6 mm2/s may be useful in the identification of clinically significant cancers.
Purpose
The purpose of this study was to compare the PI-RADS v2 scores, ADC PI-RADS scores, and their combination for the diagnosis of clinically significant prostate cancer (CSPCa), and the relationship betweent ADC values and Gleason score.Materials and Methods
Thirty-six men with biopsy-proven prostate cancer were included in this retrospective study. All patients underwent multiparametric MRI, including T1-weighted imaging (T1WI), T2-weighted imaging (T2WI), DWI (b-values 0 and 1000 s/mm2) and dynamic contrast–enhanced (DCE) imaging. No patient received any treatment including endocrine or radiotherapy. One reader with 16 years of experience in prostate MRI evaluated all protocols according to PI-RADS v2. The reader was blinded to any cilinical information. Index lesion in each patient was identified and the ADC value was measured. The index lesion was defined as the the highest PI-RADS Assessment Category. If the highest PI-RADS Assessment Category is assigned to two or more lesions, the index lesion should be the one that showed EPE or the largest according to PI-RADS v2. The reference standard was whole-mount step-section slides. Receiver-operating characteristic (ROC) curve analyse was used to compare the ability of PI-RADS scores and ADC PI-RADS scores to predict CSPCa. Spearman’s correlation coefficient ADC values between the variable and the lesions’ Gleason score grade (Gleason scores were grouped according to 2015 Gleason Grade Groups).Results
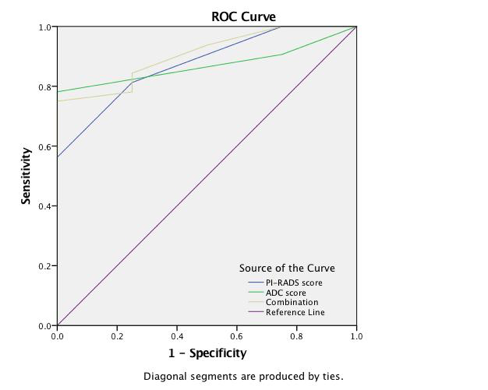
The reader detected 36 suspicious foci on MRI (including 14 in the transitional zone and 22 in the peripheral zone), PI-RADS score were as follows: 2 (n=1, 2.78%), 3 (n=7, 19.44%), 4 (n=10, 27.78%), and 5 (n=18, 50%) and the lesion scored 2 was proved to be no cancer. The AUC of ADC scores and PI-RADS scores for predict clinically significant cancer were 0.871(p=0.017, 95%CI 0.754-0.988) and 0.875(p=0.016, 95%CI 0.727-1.000), and there was no difference(Z=0.004, p=0.50). The AUC of two combination was 0.906 (p=0.009, 95%CI 0.790-1.000), and ADC PI-RADS scores did not increase diagnostic performance significantly(Z=0.032, p=0.49). The cut-off value of ADC PI-RADS scores was≥4 (the mean ADC value was (754±135)×10-6 mm2/s). The Gleason Grade Groups were as follows: 2 (n=1, 2.78%), 3 (n=7, 19.44%), 4 (n=10, 27.78%), and 5 (n=18, 50%). The mean ADC value of all lesions was 913×10-6 mm2/s (range 503-1712×10-6 mm2/s). A strong negative correlation was observed between the lesions’ mean ADC values and ADC PI-RADS scores (ρ=−0717, p<0.001). A moderate negative correlation was observed between the lesions’ mean ADC and Gleason score grade (ρ=−0.459, p<0.01).Discussion and Conclusion
Our results suggest the ADC PI-RADS scores may be of equal value to PI-RADS v2 Assessment Category to identify the index lesion with a volume equal to or greater than 0.5 cc and Gleason pattern 4 or 5. Furthermore, the addition of ADC scores did not seem to improve PI-RADS diagnostic ability. The CSPCa had higher ADC scores and lower ADC values. In our insititution, an ADC threshold of 619-889×10-6 mm2/s was suggested as an adjunct tool for the identification of clinically significant cancers.Acknowledgements
No acknowledgement found.References
1. Loeb S, Folkvaljon Y, Robinson D, et al. Evaluation of the 2015 Gleason Grade Groups in a Nationwide Population-based Cohort. Eur Urol. 2016,69(6):1135-41.
2. Lin WC, Westphalen AC, Silva GE, et al. Comparison of PI-RADS 2, ADC histogram-derived parameters, and their combination for the diagnosis of peripheral zone prostate cancer. Abdom Radiol (NY). 2016,41(11):2209-2217.
Figures