2088
On the influence of susceptibility-related field inhomogeneities caused by intestinal gases on the distortion in prostate and cervix1Medical Physics in Radiology, German Cancer Research Center (DKFZ), Heidelberg, Germany, 2Medical Faculty, University Hospital Ulm, Ulm, Germany, 3Medical Physics in Radiation Oncology, German Cancer Research Center (DKFZ), Heidelberg, Germany, 4Institute of Radiology, University Hospital Erlangen, Erlangen, Germany
Synopsis
Due to field inhomogeneities, MR-images suffer from image distortions in frequency-encoding direction. Using MRI as a tool for dose planning in MR-guided radiation therapy, image distortions play an important role in defining safety margins and the planning target volume (PTV). To investigate the influence of susceptibility-related field inhomogeneities on the distortion in prostate and cervix, distortions maps based on phase images were calculated for data acquired in a MR-guidance study. It was found that maximum distortions in prostate and rectum can be as large as 0.6 mm or 1.0 mm respectively, which should be considered when defining PTVs.
Purpose
Using magnetic resonance imaging (MRI) for dose planning in MR-guided radiation therapy, image distortions play an important role in defining safety margins and the planning target volume (PTV). To investigate the effect of susceptibility related distortions caused by intestinal gases in the rectum, image data of the whole patient collective of a MR-guidance study1 was analyzed for distortions.Methods
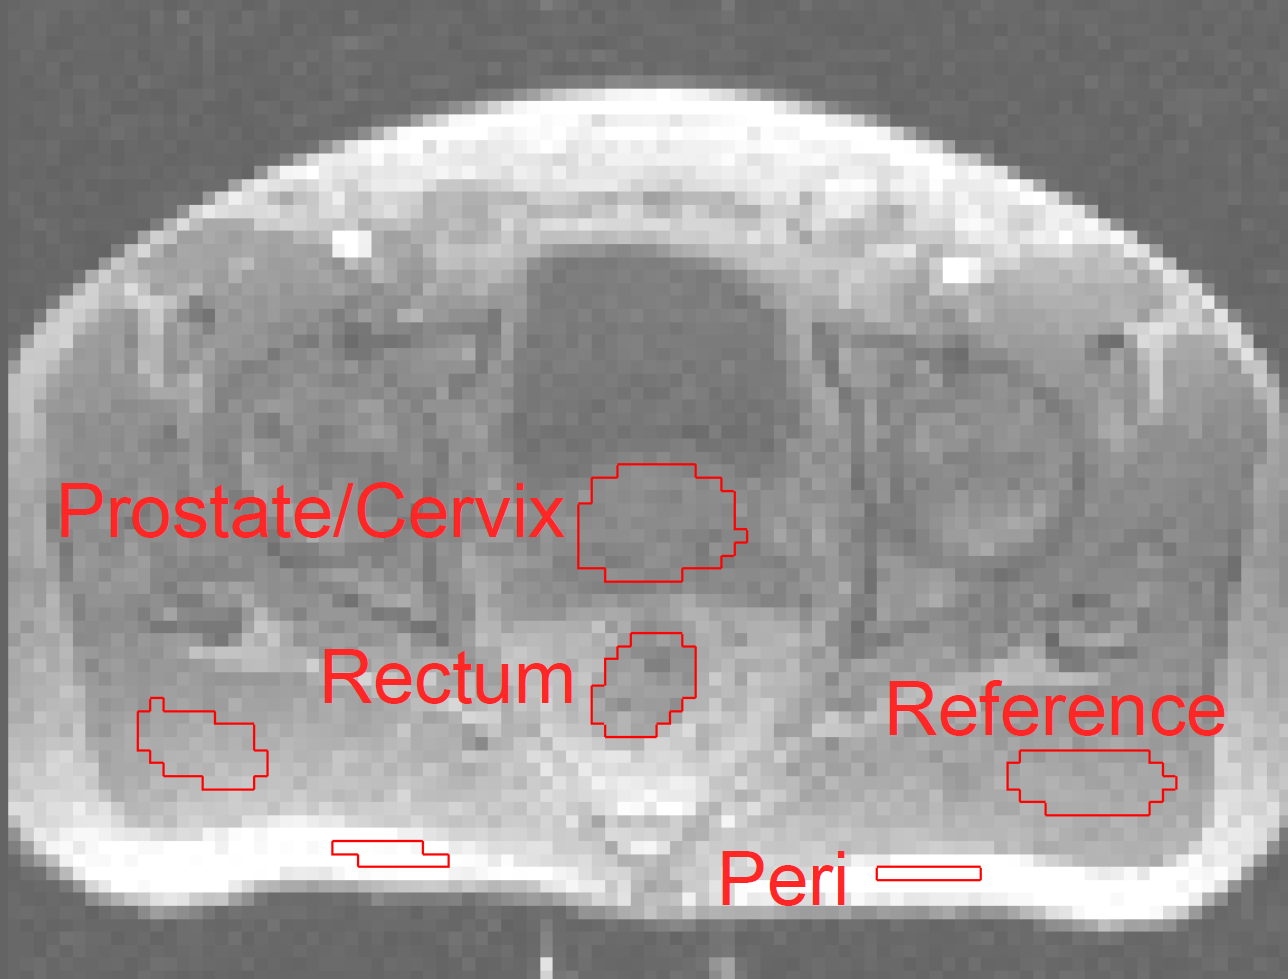
Due to field inhomogeneities $$$(\Delta B )$$$ caused by susceptibility $$$(\Delta B_X)$$$ , chemical shift $$$(\Delta B_{CS})$$$ and the inhomogeneities in $$$B_0$$$ , MR-images suffer from image distortions mainly in frequency-encoding direction2. To determine the inhomogeneities $$$\Delta B=\Delta B_0 + \Delta B_X + \Delta B_{CS}$$$ , a double echo gradient-echo sequence was used, with different echo times $$$TE_1$$$ and $$$TE_2$$$ to acquire phase images $$${\phi(x,y,z,TE)}$$$ . Using $$$\Delta TE = TE_2 - TE_1$$$ , the field inhomogeneities can be calculated as $$$\Delta B (x,y,z) = \frac{\phi(x,y,z,TE)}{\gamma \cdot \Delta TE}$$$ which result in a distortion $$$\Delta x = \frac{\Delta B}{G_{fe}}$$$ where $$$G_{fe}$$$ is the gradient strength in frequency encoding direction. To evaluate the distortion maps, ROIs according to Fig. 1 were drawn with the Medical Imaging Interaction Toolkit (MITK). For each ROI, mean value and standard deviation was calculated with Matlab (The MathWorks, Inc., Natick, MA, USA). Data was acquired with a SIEMENS Symphony fit at 1.5 T field strength (Siemens Healthineers, Erlangen, Germany), TR = 518 ms, TE = 4.76/9.52 ms, FoV = 250 mm x 329 mm, resolution 3.3 mm x 3.3 mm x 3.3 mm, acquisition bandwidth 1515 Hz/Px. The images of the pelvis and the abdomen were acquired in 176 cases (49 female and 127 male subjects). Phase images were unwrapped with an algorithm by Maier et al.3.Results
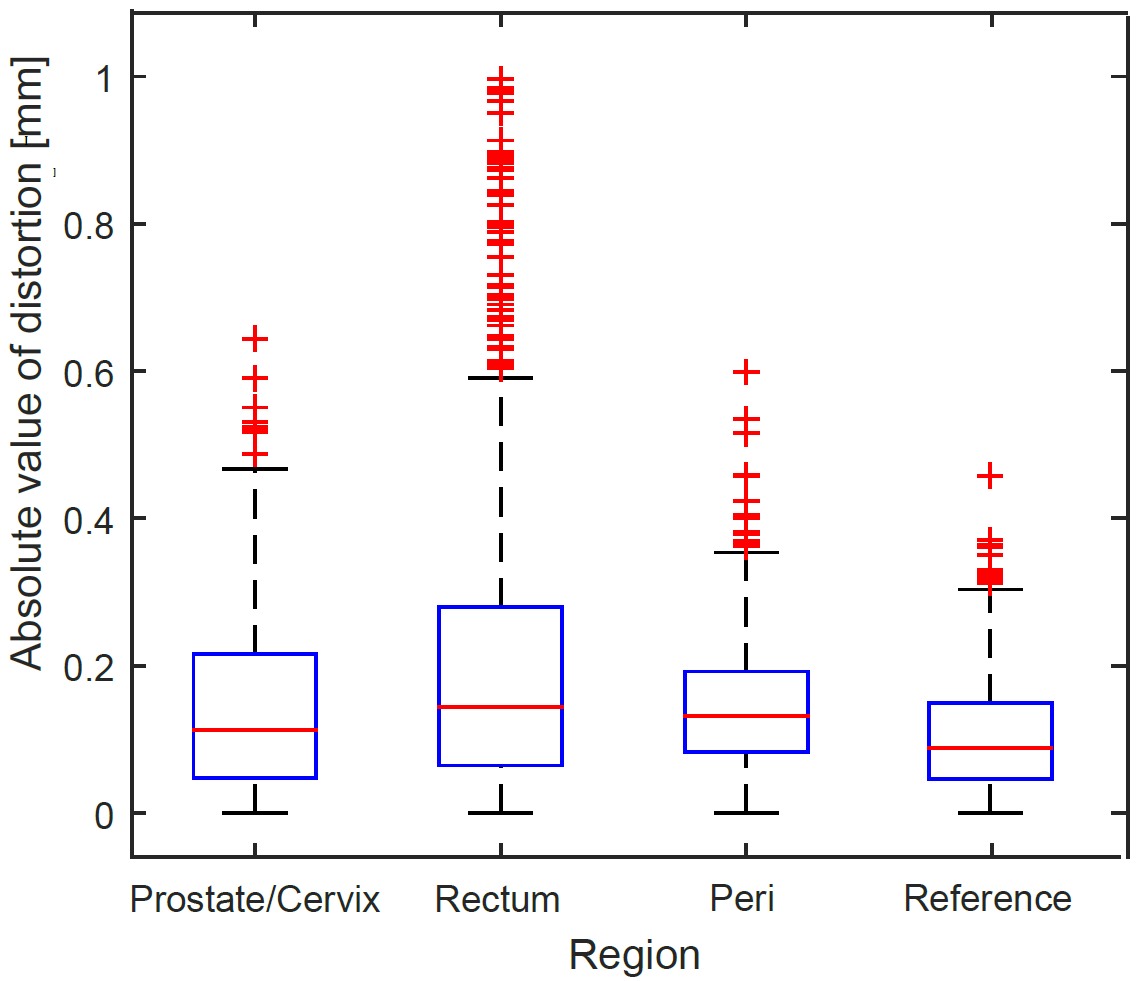
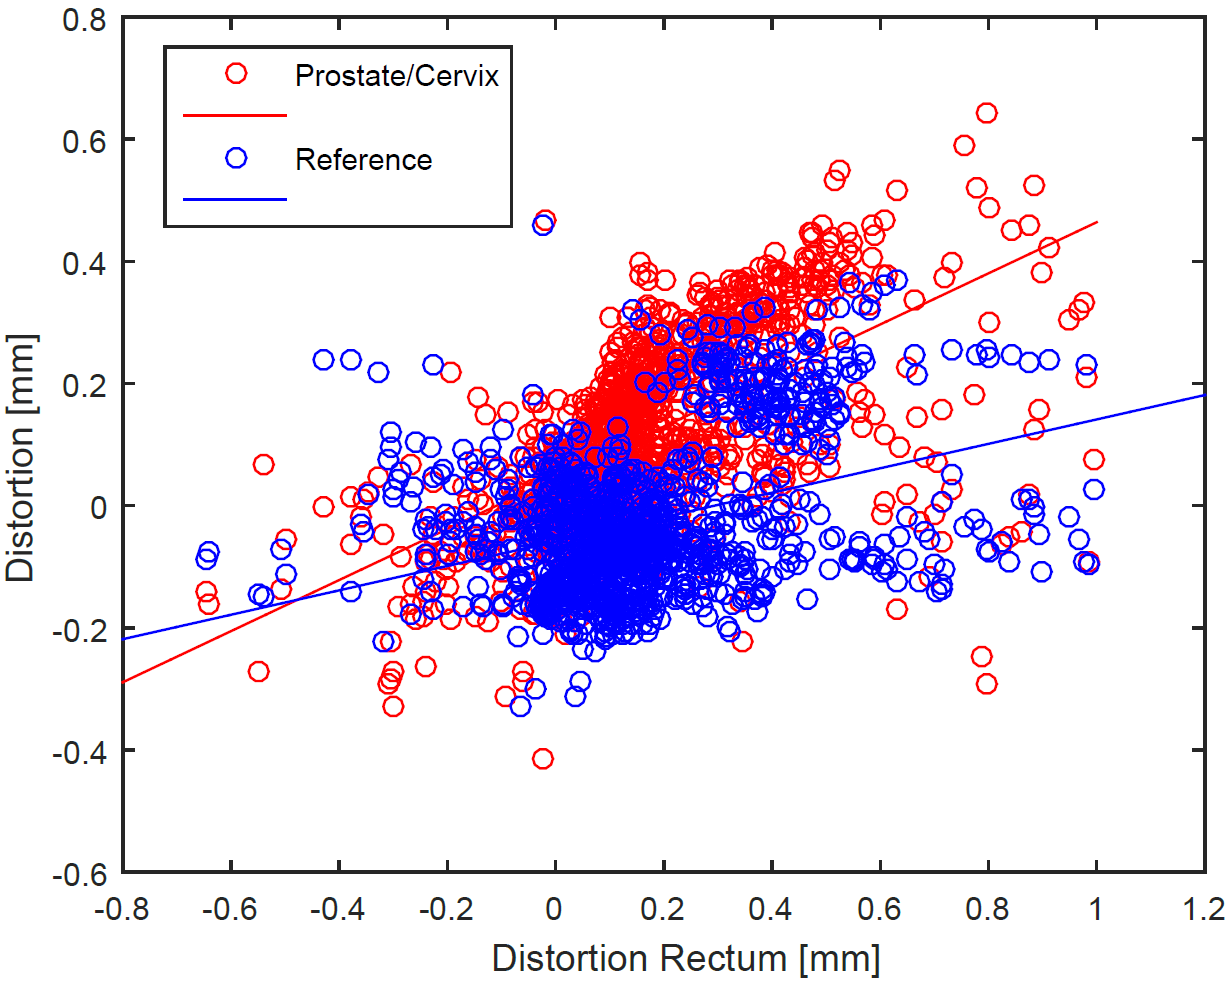
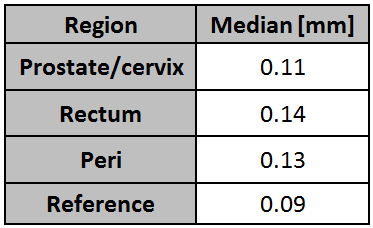
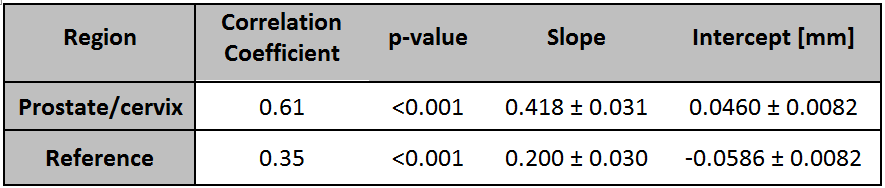
In Fig. 2, absolute mean values of distortions for all ROIs in all regions are presented as a box-plot. The medians of the mean distortions are in the range of 0.09 to 0.14 mm for all regions. In the rectum, maximum distortions are larger than 0.9 mm. In the nereby region ‘prostate/cervix’, maximum distortions range up to 0.6 mm. Detailed values are given in Tab. 1. In comparison, distortions are smaller in the regions ‘peri’ and ‘reference’ and have a smaller spread and less outliers than in the region ‘rectum’. To investigate the influence of the distortions in the rectum on the surrounding tissue, mean values of the region ‘prostate/cervix’ and of the reference region are plotted versus the mean distortion in the rectum (Fig. 3). Correlation coefficients and the results of a linear fit are listed in Tab. 2. There is a significant correlation between the mean distortion in the rectum and in ‘prostate/cervix’. The reference region shows a weak, but significant correlation with the region ‘rectum’.Discussion
Distortions caused by intestinal gases cause a non-negligible effect especially in the rectum and the sourrounding areas, prostate and cervix, even though the data was acquired with a rather high acquisition bandwidth at 1.5 T in order to minimize distortions. The weak correlation of the region ‘rectum’ with the reference region and the stronger correlation between the region ‘prostate/cervix’ and the rectum indicates a direct influence of susceptibility-related field inhomogeneities caused by intestinal gases on the distortion in prostate and cervix. Faraway regions like the reference region are almost unaffected by this effect.Conclusions
Maximum distortions in prostate and rectum can be as large as 1.0 mm, even when using a distortion-minimizing high acquistion bandwidth setting as in this study. Especially since the rectum is a high risk organ, for example in prostate cancer radiation therapy, these distortions should be considered in the determination of safety margins and PTV.Acknowledgements
No acknowledgement found.References
1. Bostel, T. et al., Radiation Oncology (London, England) 9 (2014): 12. PMC. Web. 6 Nov. 2016.
2. Baldwin, L. N. et al., Medical
Physics,
36(9):3917--3926, 2009.
3. Maier,
F. et al., Magnetic Resonance in Medicine, 73(4):1662--1668, 2015.
Figures