2086
Magnetic Resonance Imaging Studies of a Testosterone and Estrogen-supplemented Experimental Mouse Model of Lower Urinary Tract Symptoms1Radiology, The University of Chicago, Chicago, IL, United States, 2Surgery, The University of Chicago, Chicago, IL, United States
Synopsis
Lower urinary tract symptoms (LUTS) affect many elderly men and cause urinary obstruction and prostatic enlargement. The aim of this study was to use functional/anatomic MRI for serial imaging of LUTS development in a testosterone/estrogen-supplemented experimental mouse model. These mice exhibited a greater increase in prostate volume and decrease in urethra volume than control mice, and changes in urethral and prostatic volume were strongly inversely correlated. Results suggest that serial MRI could improve understanding of initiation and development of LUTS as well as the origin of clinical symptoms of benign prostatic hyperplasia, and evaluate effects of therapy in mouse models.
PURPOSE
Lower urinary tract symptoms (LUTS), associated with benign prostatic hyperplasia (BPH) affect many elderly men and causes urinary obstruction and prostatic enlargement.1 While these are not linked to cancer, the presence of BPH decreases the accuracy of prostate cancer detection, since it is difficult to distinguish malignant and benign lesions. Although Ultrasound is the current standard of care in imaging for patients with LUTS/BPH, magnetic resonance imaging (MRI) methods have seen increased use due to enhanced image resolution, soft tissue contrast, and functional information.2 The aim of this study was to use MRI to serially monitor anatomy and physiology of LUTS and BPH in a mouse model to improve understanding of the causes of clinical symptoms of these diseases.METHODS
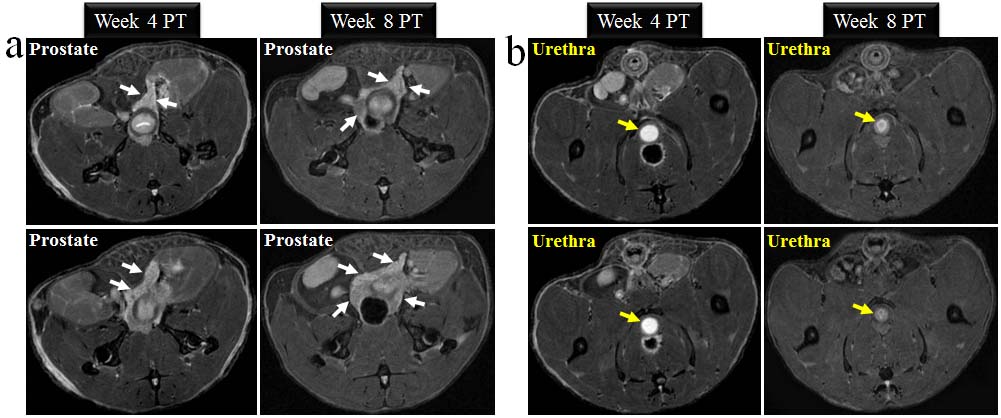
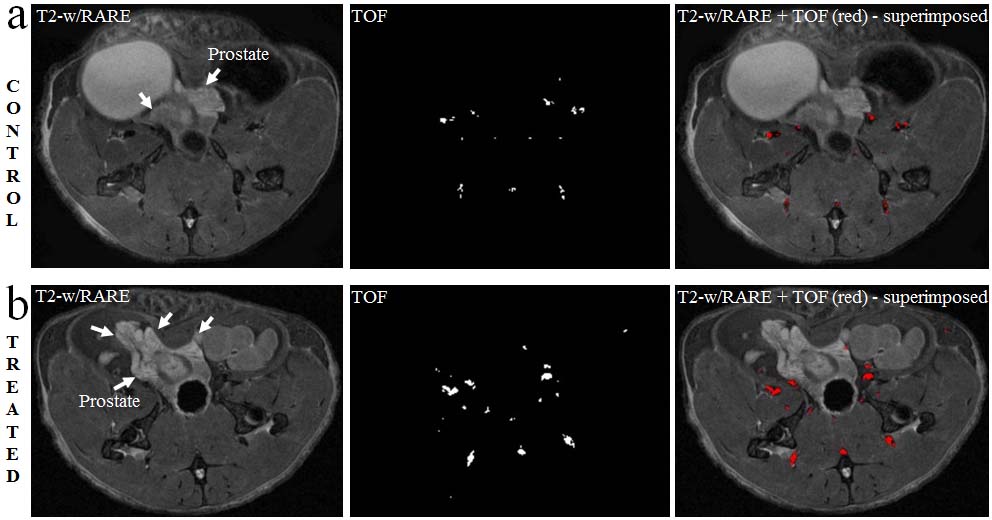
All animal work was approved by the University of Chicago Institutional Animal Care and Use Committee. Fifteen C57Bl/6 male mice (11 weeks of age) were castrated and received subcutaneous implants of silastic pellets in the back. The five control mice received pellets that contained 25 mg of testosterone in order to maintain normal prostate function. The other ten mice received pellets with a blend of 10:1 testosterone to estrogen in order to induce murine LUTS, including BPH. Serial MRI studies were performed at 4, 8, 10, 12, and 15 weeks post treatment (PT). Following in vivo MRI two testosterone and estrogen-supplemented, treated mice were sacrificed at week 8 and week 12 PT for histology and immunohistochemistry (IHC); at week 15 PT all mice were similarly sacrificed and the entire urogenital system from each mouse was excised for IHC. In vivo MR images were acquired with a 9.4 Tesla Bruker scanner with a fast spin echo acquisition (‘RARE’, TR/TE=8000/40 ms) with 100 micron in-plane resolution and 0.5 mm in slice thickness. Prostate and urethra volume were determined by manually tracing them on T2-weighted RARE images. For measuring arterial blood volume, a time-of-flight (TOF) angiography, flow compensated, T1-weighted sequence (TR/TE=10/3 ms) was used to maximize inflow effects and depict rapidly flowing blood as a bright signal. Other parameters for TOF were as in RARE sequence. Volumes were calculated for all mice for each week before the mouse was sacrificed. Mann Whitney U tests were performed for statistical analysis. A p-value <0.05 was considered significant. After in vivo MRI studies, urogenital tissue samples were excised from the mouse body for IHC, including H&E staining of slices. Several 5 microns-thick slices for the entire urogenital tissues were sectioned for H&E. Histological slides were then evaluated by an experienced prostate pathologist and tissue was classified as normal prostate or BPH.RESULTS and DISCUSSION
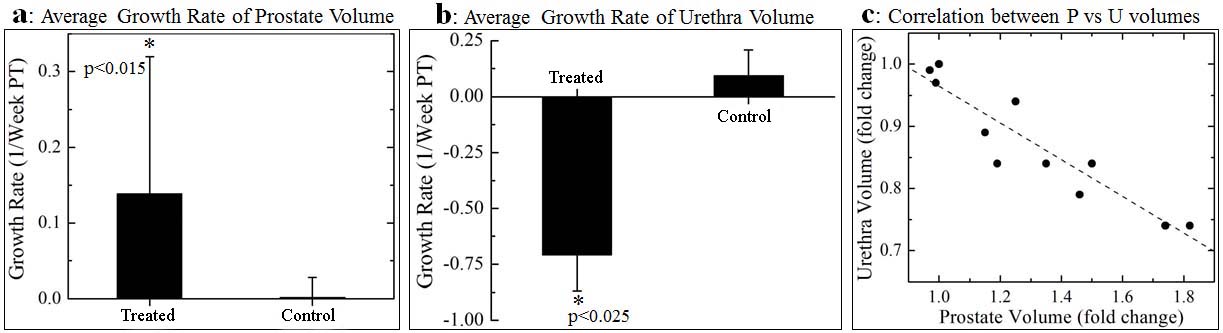
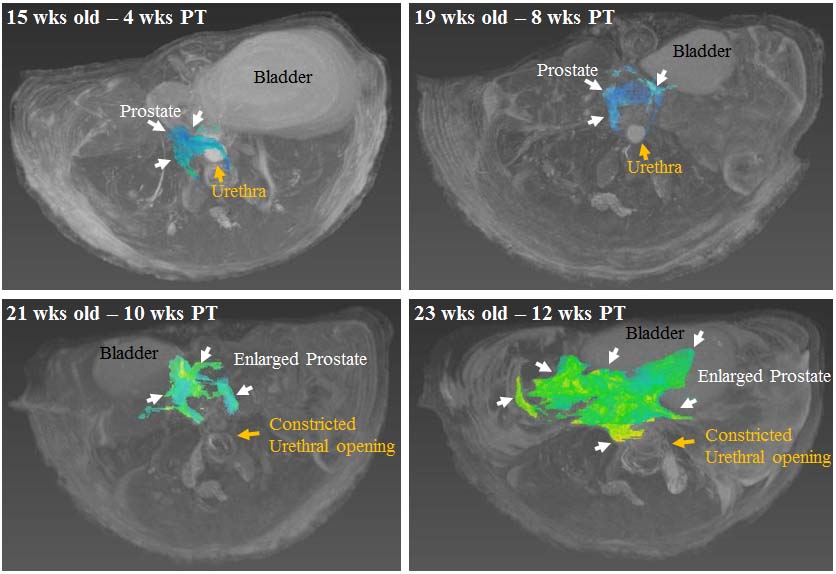
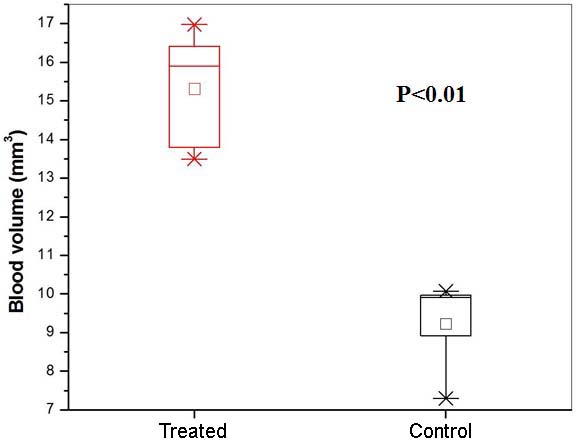
There was no significant change in the weights of the mice, and no significant difference in average body weights of treated and control mice. Testosterone and estrogen (T+E)-treated mice exhibited a significantly greater increase in prostate volume and decrease in urethra volume than control mice (p<0.03) as seen in Figures 1-3. Furthermore, there was a strong inverse correlation between prostate volume and urethral volume, as seen in Figure 2. In addition, MRI showed dilated blood vessels near the prostate and also in other regions in the T+E mice as illustrated in Figure 4. Higher overall arterial blood volume in the prostate region was found in T+E mice (15.3 mm3) compared to control mice (9.2 mm3) with p<0.01, as seen in Figure 5. However, blood volume appeared to increase in other regions as well in the T+E mice. Histologically, we observed mild epithelial hyperplasia in the dorsal prostate lobe as in benign prostatic hyperplasia, with a few areas containing multiple layers of cells and very minimal nuclear atypia. There were no significant changes in stromal hyperplasia or inflammation using immunohistochemical analyses of macrophage, B-cell, or T-cell markers.CONCLUSIONS
Serial MRI studies show that prostate volume increases significantly in a T+E experimental mouse model of LUTS compared to control mice and that this increase can be accurately and non-invasively measured with MRI. As prostate volume increases, urethra volume decreases likely due to abnormal growth of the prostate. Additionally, the blood volume increases in the region around the prostate, and possibly in other regions as well in treated mice. These observations demonstrate that MRI methods can quantitatively evaluate LUTS/BPH. The methods demonstrated here could be used for serial anatomic and functional imaging to improve understanding of LUTS/BPH, and to guide the development of new therapies. In addition, MRI studies of mouse models can guide the development of quantitative clinical MRI methods for evaluation of LUTS, associated with BPH.Acknowledgements
This research is supported by grants from the National Institutes of Health (R01-CA133490 and R01-CA167785), Florsheim foundation, Segal foundation, and VPH prism grant from the European Union. The Lynn S. Florsheim Magnetic Resonance Laboratory subcore of the Integrated Small Animal Imaging Research Resource is partially supported by funds from the University of Chicago Comprehensive Cancer Center from the National Cancer Institute Cancer Center Support Grant P30CA014599.References
1. Abrams, P. Nocturia: the major problem in patients with lower urinary tract symptoms suggestive of benign prostatic obstruction (LUTS/BPO). Eur Urol 2005;Suppl 3:8-16.
2. Guneyli S, Ward E, Thomas S, Yousuf AN, Trilisky I, Peng Y, Antic T, Oto A. Magnetic resonance imaging of benign prostatic hyperplasia. Diagnostic and Interventional Radiology 2016;22(3):215–219.
Figures