2085
Quantification of abdominal subcutaneous and visceral fat by magnetic resonance imaging of the proton at 3T: application to an overfeeding protocol.1Univ. Lyon, INSA‐Lyon, Université Claude Bernard Lyon 1, UJM-Saint Etienne, CNRS, Inserm, CREATIS UMR 5220, U1206, F69621, Lyon, France, 2Department of Physiology, Faculty of Biology and Medicine, University of Lausanne, Lausanne, Switzerland, 3Centre de Recherche en Nutrition Humaine Rhône-Alpes (CRNH-RA), Centre Hospitalier Lyon Sud, Pierre-Bénite, Lyon, France, 4Hospices Civils de Lyon, Département d'imagerie digestive, CHU Edouard Herriot, Lyon, France
Synopsis
Overweight and obesity are a major worldwide health problem increasing the risk to develop pathologies such as diabetes and cardiovascular disease. The metabolic risk is modulated by the adiposity distribution and the fatty acid composition. Quantitative MRI to assess the fat volumes and composition is still little used. This study shows, using a single 3D multiple gradient echo sequence, that overfeeding has a significant effect on fat storage in the body with an increase of visceral and subcutaneous abdominal adipose tissues volumes, fat storage in the liver and seems to have an effect on stored fat composition.
Introduction
Overweight and obesity are a major worldwide health problem increasing the risk to develop pathologies such as diabetes and cardiovascular disease. Obesity is a complex multifactorial disease combining genetic factors still misunderstood as well as environmental factors mainly related to diet and physical inactivity. Although obesity is defined as a body mass index (BMI) greater or equal to 30 kg/m², the spatial distribution of adipose tissue is decisive for the assessment of cardio metabolic risk factors. People with abdominal fat accumulation have commonly an altered metabolic profile. The increase of visceral adipose tissue1 (VAT) is associated with a higher risk to develop insulin resistance and type 2 diabetes unlike the expansion of subcutaneous adipose tissue (SAT). While 1H MRI is well suited to evaluate SAT and VAT volumes, Magnetic Resonance Spectroscopy (MRS) is able to provide saturated (SFA), monounsaturated (MUFA) or polyunsaturated (PUFA) fatty acids proportions. Recent studies demonstrated the feasibility of assessing the composition of fat based on multiple gradient echo imaging2. MRI methodology to assess the fatty acid composition is still little used but has a high potential in the study of overweight and obesity.Purpose
The purpose of this work was to monitor morphological and composition changes of abdominal and liver adiposity in particular in the weight gain phase, using a unique 3D multiple gradient echo imaging sequence.Subjects and method
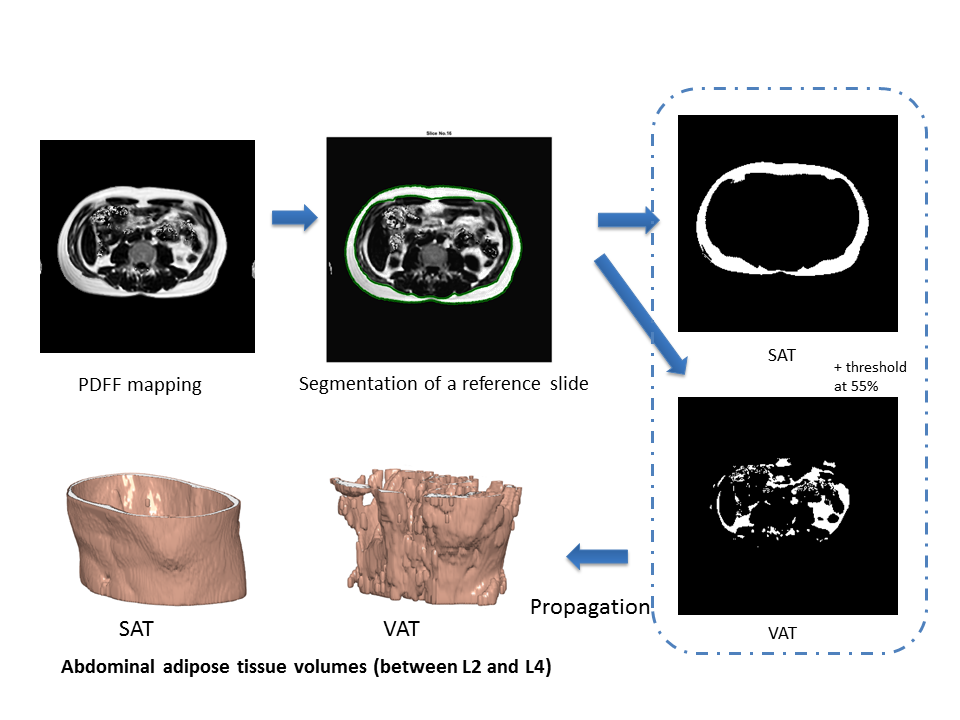
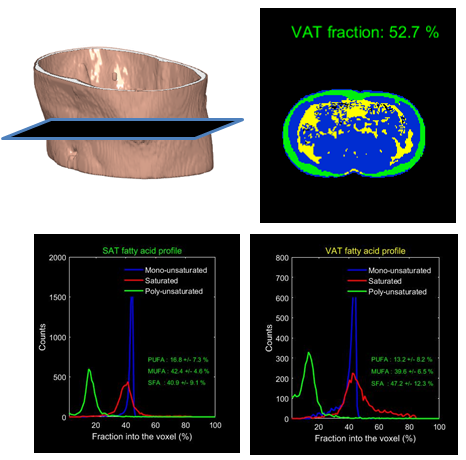
A total of 34 male volunteers aged between 18 and 55 years with a BMI between 23 and 27 kg / m² were enrolled after informed consent. Subjects underwent a high-carbohydrate and high-fat overfeeding protocol. During 31 days, they ate an extra 50% of energy requirements while pursuing eating and physical activity habits. Subjects underwent an MRI examination of the abdominal region (encompassing levels L1 to L5 and liver) before and after overfeeding on a Philips Ingenia 3T. 3D MRI acquisitions parameters were: 8 echoes (n x 1.15 ms TE with n=1, …,8), 10.3 ms TR, 384x320x420 mm3 FOV, 140x129x40 acquisition matrix size and 256x256x80 after interpolation The total MRI scan duration was 20.8 s. Fat and water only images, PDFF and fatty acid composition (i.e SFA, MUFA and PUFA fractions) parametric maps were obtained using the method described in (2). The PDFF maps were then used for the segmentation of subcutaneous and visceral fat volumes (between L2 and L4). Automatic segmentation was based on the method of Lankton3 (figure 1). Derived volumes were compared to fat mass measurements by DEXA (measured on the trunk). The PDFF map can also quantify the levels of fat in the liver. For the fatty acid composition, just one slice was studied just above the vertebrae L4 for each acquisition (figure 2). Paired t-test was used for statistical analysis.Results
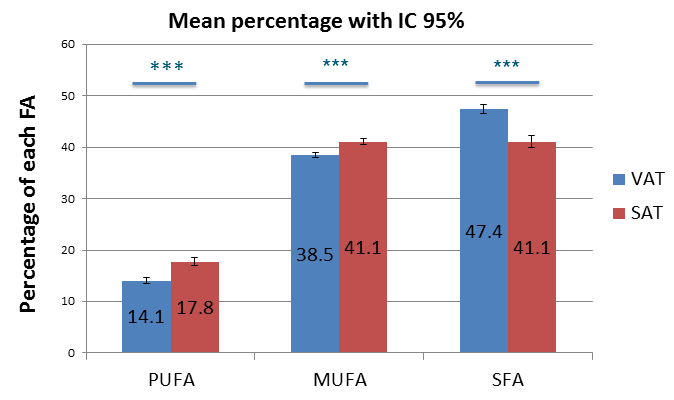
Significant increase in VAT volumes (+12% of the initial volume, p<0.001) and SAT (+11% of the initial volume, p<0.001) between the two MRI exam were found. The Pearson coefficient (r=0.90 before and 0.88 after overfeeding) shows a good correlation of VAT derived from MRI and DEXA. For the liver, two subjects, having a high level of fat in the liver (much higher than 5%) - which does not correspond to a normal fat level in healthy subjects - were excluded from the statistical analysis. Considering the 32 remaining subjects, a significant increase (p<0.001) of fats in the liver between MRI 1 (average PDFF of 2.32 ± 1.05 %) and MRI 2 (average PDFF of 3.42 ± 2.01 %) was found. In terms of fatty acid composition, there was a significant difference in the composition of VAT and SAT before and after the overfeeding protocol (MRI 1 (figure 3)). In addition, for the VAT, MUFA (p = 0.01) show a trend to increase and SFA (p = 0.04) a trend to decrease after overfeeding. No significant difference was observed in the composition of the SAT between the two MRI.Conclusion
To conclude, overfeeding has a significant effect on fat storage in the body with an increase of visceral and subcutaneous abdominal adipose tissues volumes and fat storage in the liver. Overfeeding also seems to have an effect on stored fat composition. All the results were assessed from a single imaging sequence and a suitable post processing. At the end of the study, analysis by gas chromatography will be made on biopsies of SAT to confirm the fatty acid composition results.Acknowledgements
LABEX PRIMES (ANR-11-LABX-0063), program "Investissements d'Avenir" (ANR-11-IDEX-0007), IHU Opera and PHRC-IR Visfatir.References
1Alligier M, Gabert L, Meugnier E, Lambert-Porcheron S, Chanseaume E, Pilleul F, Debard C, Sauvinet V, Morio B, Vidal-Puig A, Vidal H, Laville M. Visceral fat accumulation during lipid overfeeding is related to subcutaneous adipose tissue characteristics in healthy men. JCEM (2013). 98(2):802-10.
2Leporq B, Lambert SA, Ronot M, Vilgrain V, Van Beers BE. Quantification of the triglyceride fatty acid composition with 3.0 T MRI. NMR Biomed (2014). 27(10):1211-21.
3Lankton S, Tannenbaum A. Localizing region-based active contours. IEEE Trans Image Process (2008). 17:2029-2039.
Figures