2078
"Push-button" PET/MRI using a continuous scan 3D quantitative T2 MRI sequence1Biomedical Engineering, King's College London, London, United Kingdom, 2Siemens Healthcare Limited, Frimley, United Kingdom, 3Cancer Imaging, King's College London, London, United Kingdom
Synopsis
To avoid overtreatment and repeated use of invasive biopsies, there is a need for improved diagnostic tools for prostate cancer risk stratification. Simultaneous Positron Emission Tomography / Magnetic Resonance Imaging (PET/MRI) systems are promising, however, fundamental differences in PET and MR imaging methodology currently limit full integration and thus the true potential of simultaneous PET/MR: While PET is a rather straightforward, single 3D scan, the MRI exam is complex and current clinical practice consists of several 2D sequences with different image contrast weightings and spatial coverage, performed in a serial fashion. Here, we propose a single, 3D, quantitative T2-MRI sequence that parallels the continuous scan workflow of PET data acquisition.
Purpose
Current diagnostic techniques are not able to conclusively predict if prostate cancer is aggressive or not. Thus, many men undergo invasive biopsies and radical treatment, which may be unnecessary. Imaging-based high precision diagnostics may be realised with the recent development of simultaneous Positron Emission Tomography / Magnetic Resonance Imaging (PET/MRI) systems by combining molecular information provided by PET with anatomical and functional information provided by MRI. However, fundamental differences in PET and MR imaging methodology currently limit full integration and thus the true potential of simultaneous PET/MR: While PET is a rather straightforward, single 3D scan, the MRI exam is complex and current clinical practice consists of several 2D sequences with different image contrast weightings and spatial coverage, performed in a serial fashion. Here, we propose a single, 3D, quantitative T2-MRI sequence that parallels the continuous scan workflow of PET data acquisition.Methods
T2-mapping can be achieved using a segmented acquisition with T2-preparation modules, previously shown in cardiac 1,2 and prostate 3 applications. In this study, we implemented a continuous scanning, T2-prepared, segmented 3D acquisition. T2-preparation was achieved using an adiabatic T2-prep pulse module 4,5. Subsequent segments were acquired using is a golden-step Cartesian spiral profile order trajectory (G-CASPR6), which is centric in the phase encoding kykz-plane to ensure the T2-prepared contrast is encoded immediately after magnetisation preparation. A fully-balanced gradient echo readout (bSSFP) was used to achieve high SNR. This prototype sequence was implemented on the Siemens Biograph mMR (Siemens Healthcare Erlangen, Germany). Prostate imaging was performed in a healthy volunteer with the proposed MR sequence and in an oncological patient with MR and simultaneous 18F-FDG PET. MR measurements were performed in 3D (transversal acquisition, matrix size 352 x 352 x 20, resolution 0.85 x 0.85 x 3.00 mm3) with a TR/TE of 1000 ms / 2 ms, flip angle 49 deg, bandwidth/pixel 836 Hz, total acquisition time 4 min. The acquisition was repeated 3 times with T2-prep off, 45 ms and 90 ms. T2-mapping was performed using a simple exponential fit.Results and Discussion
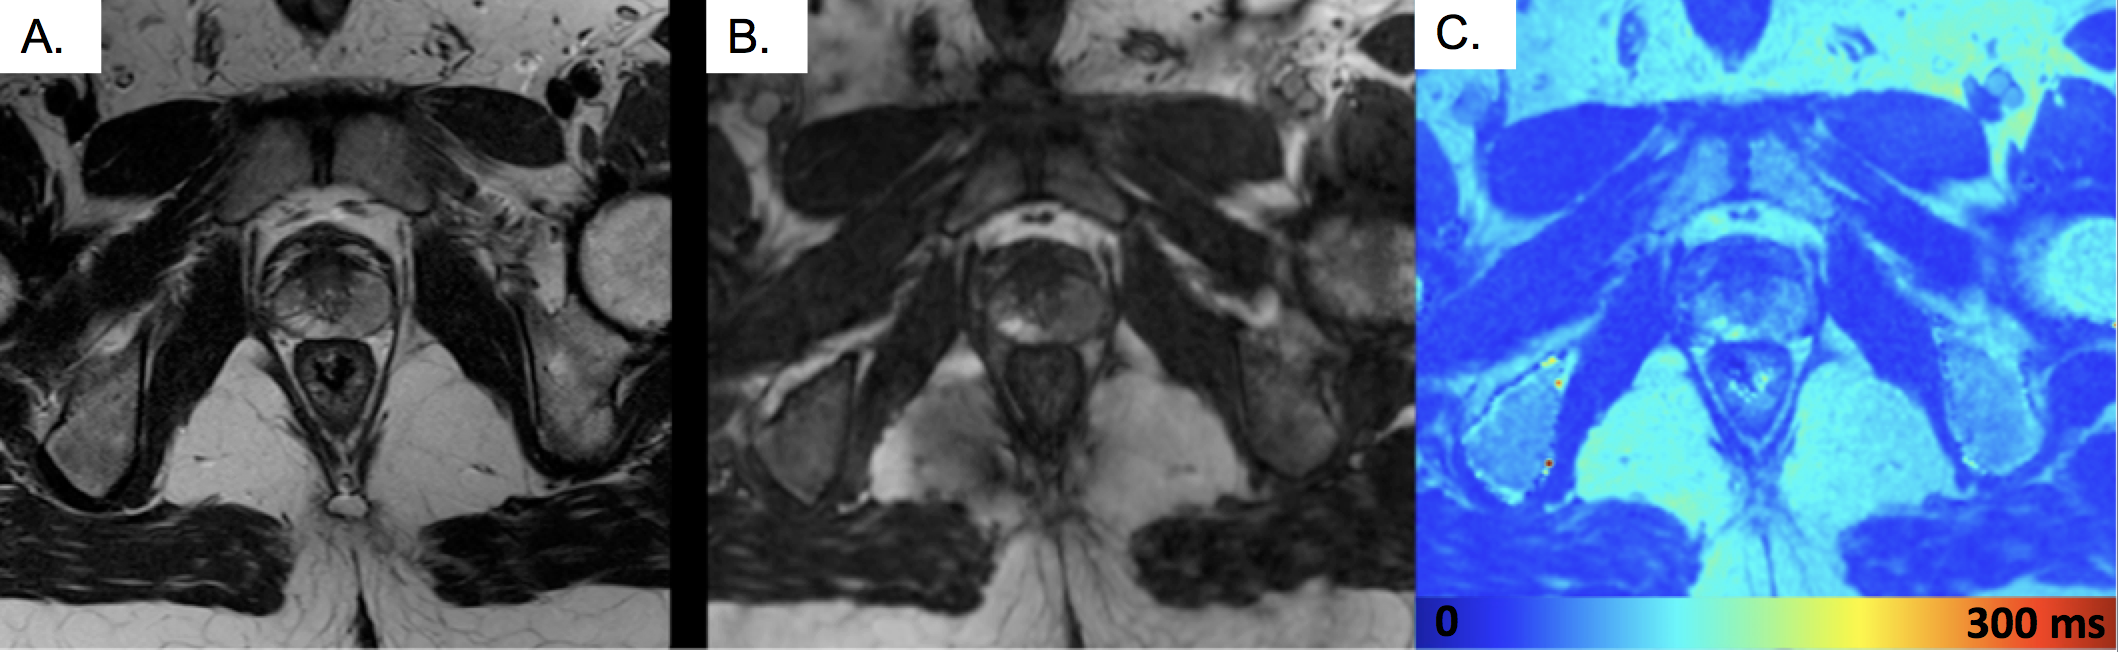
Preliminary results in a healthy volunteer using the proposed 3D MR sequence to generate a T2-map is shown in Figure 1C. Measured T2-values in the peripheral zone (T2=150 ms), transition zone (T2=85 ms), muscle (T2=65 ms) and fat (T2=150 ms) agree with literature. For comparison, a clinical T2-weighted (TSE) 2D acquisition (TE = 90 ms, resolution 0.31 x 0.31 mm2, slice thickness 3 mm) is shown in Figure 1A, which has similar contrast to the proposed 3D T2-w (T2-prep 100 ms) (B).
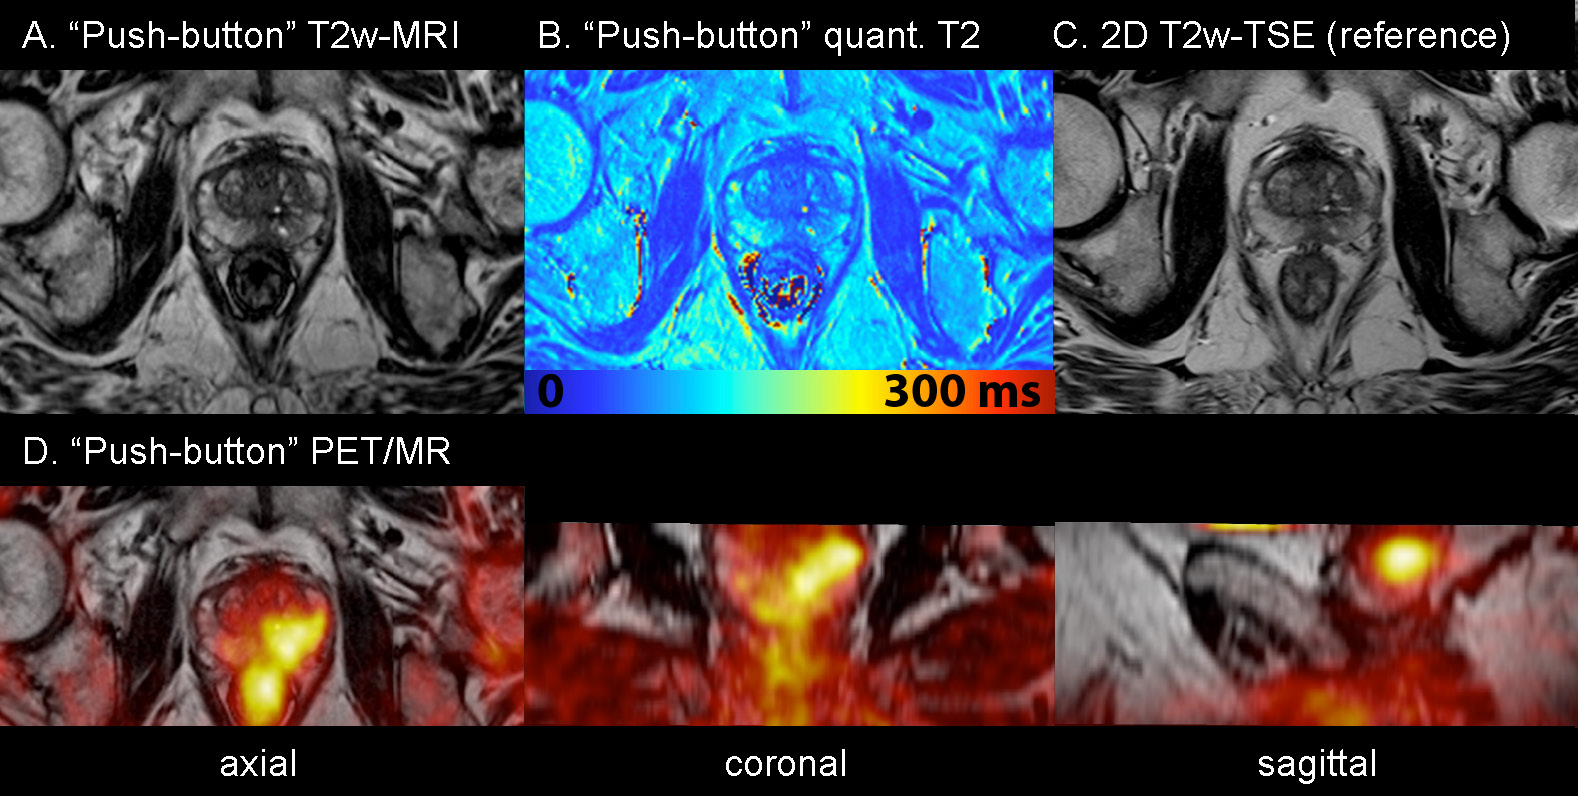
Preliminary results in a patient scan with simultaneous PET is shown in Figure 2. This patient was injected 18F-FDG for a lung cancer scan. We applied “push-button” MR to the prostate and observed an incidental finding of hypo-intense area in the left peripheral zone on “push-button” T2w-MRI (A), reduced quantitative T2 (left side ROI: T2=75 ms compared to right side ROI T2=110 ms) (B) and increased 18F-FDG uptake in simultaneous PET (D). T2w image contrast in 3D “Push-button” T2w-MRI (A) was very similar to clinical standard 2D T2w-TSE (C), however is superior because in addition it enables to generate quantitative T2 (B), and it is a 3D scan, inherently co-registered to simultaneous PET, enabling viewing in all 3 dimensions (axial, coronal and sagittal).
In simultaneous PET/MR, the approach will be extended to incorporate motion correction into the diagnostic MR, and joint reconstruction to thoroughly utilise the synergistic information in both MR and PET.
Conclusion
We have shown a simplified approach to prostate T2-MRI that allows acquiring 3D and quantitative T2-maps in a single, operator-independent scan that parallels the straightforward “push-button” acquisition of a 3D PET scan.Acknowledgements
We acknowledge funding from TOHETI, NIHR BRC, GSTT/KCL BRC, CRUK/EPSRC Cancer Centre and Siemens Healthcare.References
1. van Heeswijk, R.B., et al. Free-breathing 3 T magnetic resonance T2-mapping of the heart. JACC Cardiovasc Imaging 5, 1231-1239 (2012).
2. Huang, T.Y., Liu, Y.J., Stemmer, A. & Poncelet, B.P. T2 measurement of the human myocardium using a T2-prepared transient-state TrueFISP sequence. Magn Reson Med 57, 960-966 (2007).
3. Nguyen, C., et al. 3D high-resolution diffusion-weighted MRI at 3T: Preliminary application in prostate cancer patients undergoing active surveillance protocol for low-risk prostate cancer. Magn Reson Med 75, 616-626 (2016).
4. Botnar, R.M., Stuber, M., Danias, P.G., Kissinger, K.V. & Manning, W.J. Improved Coronary Artery Definition With T2-Weighted, Free-Breathing, Three-Dimensional Coronary MRA. Circulation 99, 3139-3148 (1999).
5. Brittain, J.H., et al. Coronary angiography with magnetization-prepared T2 contrast. Magn Reson Med 33, 689-696 (1995).
6. Prieto, C., et al. Highly efficient respiratory motion compensated free-breathing coronary MRA using golden-step Cartesian acquisition. J Magn Reson Imaging 41, 738-746 (2015).
Figures