2076
Prediction of low-risk breast cancer using quantitative DCE-MRI and its pathological basis1Department of Radiology, Tenth People’s Hospital,TongjiUniversity School of medicine, Shanghai, Shanghai, People's Republic of China
Synopsis
Purpose: This study aimed to evaluate the difference in dynamic contrast enhanced magnetic resonance imaging characteristics between low-risk and non-low-risk breast cancers and to explore the possible pathological basis.
Materials and methods: Approval from the institutional review board and informed consent were acquired for this study. The MR images of 104 lesions with pathologically proven breast cancer were retrospectively analyzed.
Result: Low-risk tumors showed significantly lower Ktrans and Kep values and higher ADC value than non-low-risk breast cancers.
Conclusion: The prediction parameter using Ktrans, Kep, and ADC obtained on DCE-MRI and diffusion-weighted imaging could facilitate the identification of low-risk breast cancers.
Abstract
Purpose: This study aimed to evaluate the difference in dynamic contrast enhanced magnetic resonance imaging (DCE-MRI) characteristics between low-risk and non-low-risk breast cancers and to explore the possible pathological basis.
Materials and methods:Approval from the institutional review board and informed consent were acquired for this study. The MR images of 104 patients with pathologically proven breast cancer (104 lesions) were retrospectively analyzed. Masses with estrogen receptor-positive, Ki-67 < 15%, low histologic grade, and negative lymph node metastasis were defined as low-risk or non-low-risk breast cancers. The DCE-MRI morphologic findings, apparent diffusion coefficient (ADC) values, quantitative DCE-MRI parameters, and pathological biomarkers between the two subtypes of breast cancer were compared. The quantitative DCE-MRI parameters and ADC values were added to the morphologic features in multivariate models to evaluate diagnostic performance in predicting low-risk breast cancer. The values were further subjected to the receiver operating characteristic (ROC) curve analysis.
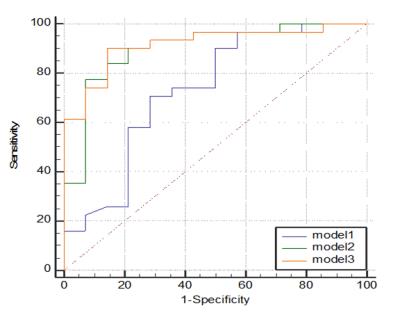
Result: Our results revealed no significant differences in clinic-pathological data and conventional imaging findings between the two breast cancer subtypes. Low-risk tumors showed significantly lower Ktrans and Kep values (t = 2.065, p = 0.043 and t = 3.548, p = 0.001, respectively) and higher ADC value (t = 4.713, p = 0.000) than non-low-risk breast cancers. Adding the quantitative DCE-MRI parameters and ADC values to conventional MRI improved the diagnostic performance of MRI: The area under the ROC improved from 0.73 to 0.91. Low-risk breast cancers showed significantly lower matrix metalloproteinase (MMP)-2 expression (p = 0.000), lower MMP-9 expression (p = 0.001), and lower microvessel density (MVD) values (p = 0.008) compared with non-low-risk breast cancers.
Conclusion:The prediction parameter using Ktrans, Kep, and ADC obtained on DCE-MRI and diffusion-weighted imaging could facilitate the identification of low-risk breast cancers. Decreased biological factors, including MVD, vascular endothelial growth factor, MMP-2, and MMP-9, may explain the possible pathological basis.
Key words: Dynamic contrast enhanced magnetic resonance imaging; Low-risk breast cancer;Apparent diffusion coefficient; Quantitative parameters; Pathological basis
Acknowledgements
This study was supported by grants from Shanghai Shen Kang Hospital Development Center(SHDC22015026)References
1. de Ronde JJ, Hannemann J, Halfwerk H, et al. Concordance of clinical and molecular breast cancer subtyping in the context of preoperative chemotherapy response. Breast Cancer Res Treat. 2010;119(1) :119-26.
2. Dialani V, Gaur S, Mehta TS, et al. Prediction of Low versus High Recurrence Scores in Estrogen Receptor-Positive, Lymph Node-Negative Invasive Breast Cancer on the Basis of Radiologic-Pathologic Features: Comparison with Oncotype DX Test Recurrence Scores. Radiology. 2016;280(2): 370-8.
3. Alramadhan M, Ryu JM, Rayzah M, et al. Goserelin plus tamoxifen compared to chemotherapy followed by tamoxifen in premenopausal patients with early stage-, lymph node-negative breast cancer of luminal A subtype. Breast. 2016;30:111-7.
4. Shin HJ, Kim HH, Shin KC, et al. Prediction of low-risk breast cancer using perfusion parameters and apparent diffusion coefficient. Magn Reson Imaging. 2016;34(2): 67-74.
5. Turnbull LW. Dynamic contrast-enhanced MRI in the diagnosis and management of breast cancer. NMR Biomed. 2009;22(1): 28-39.
Figures

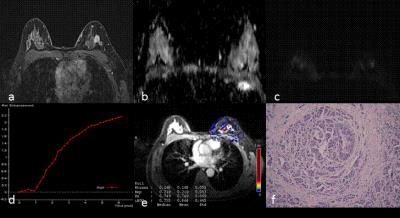
Fig.1.A 63-year-old woman with invasive ductal carcinoma in the right breast classified as a non-low-risk tumor. (a) Delayed contrast enhancement imageshows a tumor with rough margin, oval shape and homogeneous enhancement in the right breast. (b) ADC map and (c)DW image showing hyperintensity signal with mean ADC 0.90 × 10⁻³mm2/sec. (d)TIC showed a tumor with type3 curve (e)Quantitative DCE-MRI images with calculated perfusion parameters(Ktrans2.787, Kep 4.690 andVe 0.607). (f) Microscopic image demonstrating the diagnosis of IDC (H&E staining, original magnification ×100).

Fig.2. A 47-year-old woman with IDC in the left breast classified as low-risk breast cancer. (a) Delayed contrast enhanced image, shows a tumor with smooth margin, irregular shape and heterogeneous enhancement. (b) ADC map and (c)DW image showing isointensity signal with mean ADC 1.2 × 10⁻³mm2/sec on ADC map(d)TIC displaying a tumor with type 1 curve. (e)Quantitative DCE-MRI image with calculated perfusion parameters (Ktrans0.168, Kep 0.219, Ve 0.749). (f) Microscopic image demonstrating the diagnosis of IDC (H&E staining, original magnification ×100).

Fig.3.Graph shows comparison of ROC curves among three models. Model 3 resulted in significantly highest AUC, indicating adding quantitative DCE-MRI parameters to model 1 and model 2 significantly improved diagnostic performance.

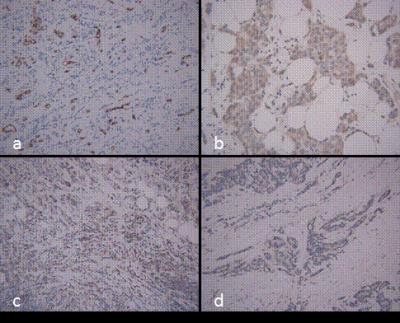
Fig.4.Microscopic manifestations of IHC in a patient with breast cancer same to Fig1. Expression of biological factors: (a) high MVD distribution (CD34-immunostaining, original magnification×200); (b) high VEGF expression (IHC, original magnification×200); (c) high MMP-9 expression (IHC, original magnification ×200); (d) high MMP-2 expression (IHC, original magnification ×200).

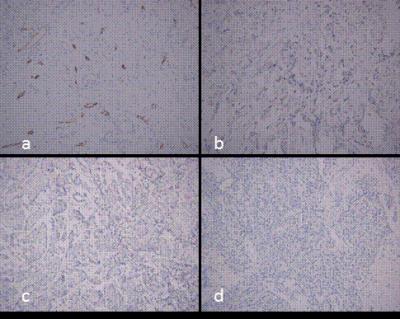
Fig.5.Microscopic manifestations of IHC in a patient with breast cancer same to Fig2. (a) low MVD distribution (CD34-immunostaining, original magnification ×200); (b) low VEGF expression (IHC, original magnification×200); (c) low MMP-9 expression (IHC, original magnification ×200); (d) low MMP-2expression (IHC, original magnification ×200).