2071
Evaluation of T1/T2 ratios in a pilot study as a potential biomarker of biopsy - proven benign and malignant breast lesions in correlation with histopathological disease stage.1Surgery, Boston University, Boston, MA, United States, 2Radiology, Boston Medical Center, Boston, MA, United States, 3Radiology, Beth Israel Deaconess Medical Center, Harvard Medical School, Boston, MA, United States, 4Biostatistics, Boston University, Boston, MA, United States
Synopsis
The T1/T2 ratios obtained by qMRI provide measures that strongly correlate with histopathological findings. This quantitative information of tissue properties can provide basis for improving the specificity of diagnostic breast imaging and serve as a tool to assess response to treatment and contralateral breast involvement.
Abstract
Background: Breast cancer is one of the most common cancers among women. 1, 2 Early detection is important for successful intervention and improved prognosis. 2,3 Advances in the treatment and outcome of patients with breast cancer require the development of diagnostic tools with high positive predictive value. Imaging modalities such as mammography, ultrasonography and magnetic resonance imaging are routinely used to identify and characterize breast lesions.1-7
Objective: To study the potential role of quantitative MRI (qMRI) using T1/T2 ratios to differentiate benign from malignant breast lesions.
Methods: A cross sectional study of 69 women with 69 known or suspicious breast lesions (Figure 1) were scanned with the mixed-TSE pulse sequence, which is multispectral in T1 and T2, therefore, affords maps of T1/T2 (Figure 2). Patients were grouped according to histopathological assessment of disease stage: untreated malignant tumor, treated malignancy and benign disease.
Results: Elevated T1/T2 means of 8.20 ± 1.05 (N=12) were observed for biopsy proven malignant lesions and 6.55 ± 0.63 (N=28) for malignant lesions that were treated prior to qMRI with chemotherapy and/or radiation as compared to 4.1 ± 0.43 (N=29) for benign lesions (Figure 3). The T1/T2 ratios obtained by qMRI strongly correlate with histopathological findings. The non-parametric analysis revealed correlation between elevated T1/T2 ratio and more advanced disease stage. The differences found among these three groups regarding T1/T2 ratio were statistically significant (p=0.0002) as shown on Figure. 4.
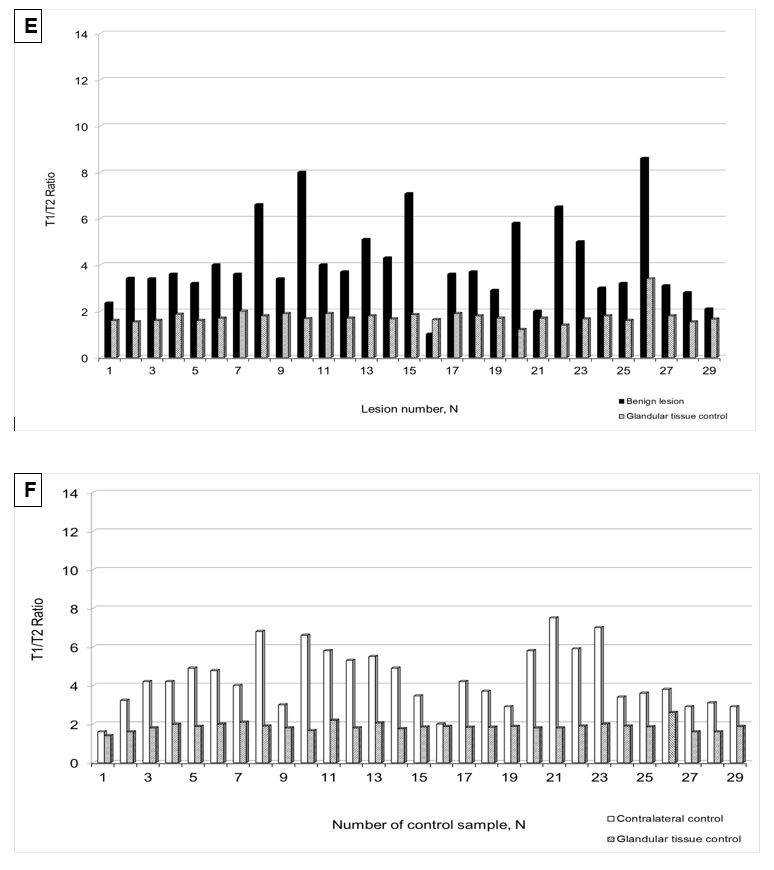
There were no statistically significant changes observed in T1/T2 ratio in the glandular tissue post-gadolinium administrtaion (p=0.0159), which serves as a control that observed elevated T1/T2 values can be attributed to properties of diseased tissues (i.e. ductal and lobular carcinomas) (Figure 5 A-F) . Also, 3 out of 33 examined subjects in post-treatment group had an elevated T1/T2 ratios detected in contralateral breast (Figure 5 C-D). Subsequent biopsy and histopathology analysis confirmed contralateral breast involvement. The higher stage of cancer determined by histopathology analysis was also strongly associated with higher T1/T2 ratio (p= 0.0198). Estrogen, progesterone and Her2/neu triple negative receptors status was strongly correlated with higher T1/T2 ratio (p=0.0019, p=0.0021, and p=0.0030; respectively for each receptor).
Conclusion: The T1/T2 ratios provide measures that strongly correlate with histopathological findings. This quantitative information of tissue properties can provide basis for improving the specificity of diagnostic breast imaging and serve as a tool to assess response to treatment and contralateral breast involvement.
Acknowledgements
Authors would like to thank MRI technologists Chris Cusak, John Caveney, David Carangelo for their help and support with research patients.References
1. The American Cancer Society All About Breast Cancer Overview. http://www.cancer.org/cancer/breastcancer/detailedguide/breast-cancer-key-statistics
2. Hooley RJ, Scoutt LM, Philpotts LE. Breast ultrasonography: State of the art. Radiology 268:642–659 (2013).
3. Berg WA, Zhang Z, Lehrer D, et al. Detection of breast cancer with addition of annual screening ultrasound or a single screening MRI to mammography in women with elevated breast cancer risk. JAMA 307:1394–1404 (2012).
4. Tabár L, Vitak B, Chen TH, et al. Swedish two-county trial: Impact of mammographic screening on breast cancer mortality during 3 decades. Radiology 260:658–663 (2011).
5. Kopans DB. Arguments against mammography screening continue to be based on faulty science. Oncologist 19:107–112 (2014).
6. Kuhl CK, Schrading S, Leutner CC, et al. Mammography, breast ultrasound, and magnetic resonance imaging for surveillance of women at high familial risk for breast cancer. J Clin Oncol 23:8469–8476(2005).
7. Morris EA. Diagnostic breast MR imaging: Current status and future directions. Magn Reson Imaging Clin N Am 18:57–74 (2010).
Figures
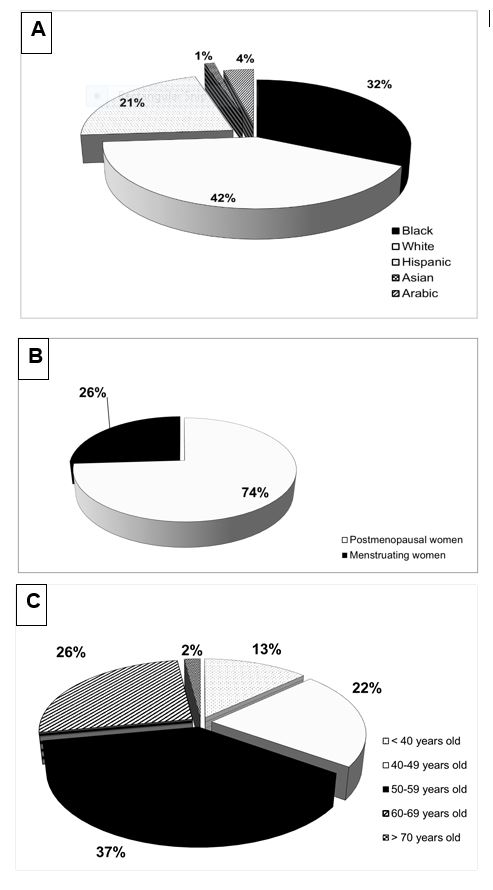
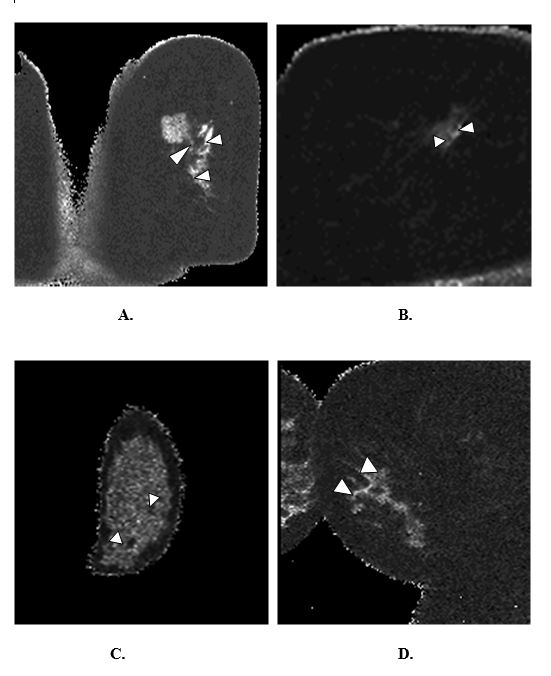
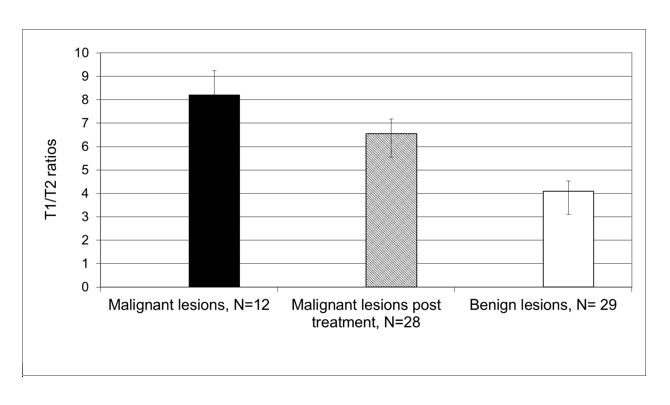

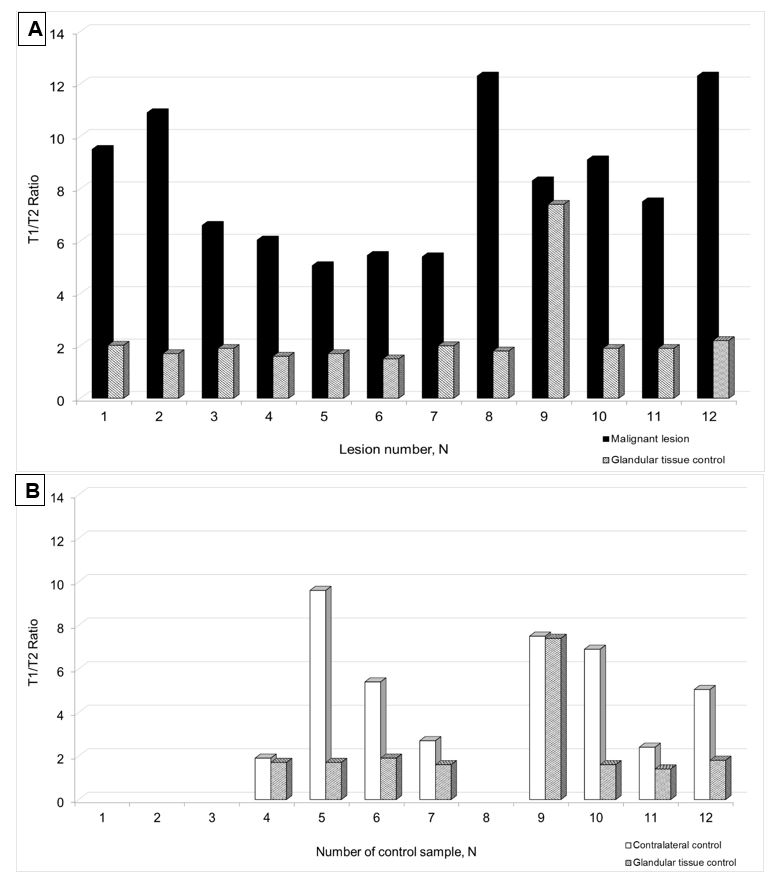

Figure 5 C-D.
Contralateral breast and glandular control tissue assessments in post treatment group (C, D) by qMRI. Elevated T1/T2 ratios were detected in three subjects (samples 3 - known bilateral malignancy, 6 and 23 - newly detected) of contralateral breast in post treatment group (Figure 5 D, labelled respectively by “*”, “?”), both were confirmed for malignancy by histopathology analysis.