2070
An mpMRI derived Logistic Regression Model for Gleason 4 Pattern Prediction in Peripheral Zone Prostate Cancer1Translational Imaging Group, CMIC, University College London, London, UK, London, United Kingdom, 2Centre for Medical Imaging, University College London, London, UK, London, United Kingdom, 3Dementia Research Centre, Department of Neurodegenerative Disease, UCL Institute of Neurology, London, UK, 4Academic Radiology, University College London Centre for Medical Imaging, London, UK
Synopsis
Gleason grade is the most important determinant of prognosis and survival in prostate cancer, and is determined using prostate biopsy. Here we investigate whether multi-parametric MRI can be used to classify Gleason grade non-invasively with logistic regression (LR) models, classifying tumours into 3+3 and those containing a 4 component. A selection of clinical and quantitative MRI metrics were used. The LR model was trained in ninety-nine patients and tested following a Leave-One-Out (LOO) analysis on a temporal separated cohort of nineteen patients. LR models were shown to predict the presence of Gleason 4 component in cancer lesions both before and after LOO analysis.
Introduction
Prostate cancer is a heterogeneous disease state, with a strong relationship between aggressiveness, characterised by Gleason grade, and survival1. Recently, the concept of Gleason 3+3 and Gleason 4 tumours representing distinct disease states has emerged2, due to the different signatures at a genomic level3 and the distinct survival rates encountered in large long-term follow up studies4. Multi-parametric (mp)MRI is commonly employed for the diagnosis and management of prostate cancer. Individual mpMRI sequences produce images weighted towards specific tissue properties and mpMRI intensities have demonstrated moderate correlation with Gleason grade5. There is little work regarding the prediction of aggressive prostate cancer for peripheral zone (PZ), and models incorporating clinical features together with mpMRI parameters have not been previously reported. In this study, we develop and test such models for classifying the grade of cancer into Gleason 4 or Gleason 3+3.Methods
This study uses mpMRI acquired at 3T. Two different cohorts were used, one for training and one for testing. The training set consisted of 99 patients, (72 Gleason 4 and 27 Gleason 3+3). The test set contained 19 patients, (10 Gleason 4 and 9 Gleason 3+3). A board certified radiologist manually contoured a volume of interest (VOI) for each lesion and recorded the mean intensity of each VOI on the axial T2-Weighted image (T2W), Apparent Diffusion Coefficient (ADC), and Dynamic Contrast Enhancement (DCE) images at all time points. To standardise inter-subject intensity, normalised T2 intensity metrics (T2nSI) were calculated by dividing the lesion intensity by that of the bladder. Logistic regression (LR) model is derived for classifying the cancer grade into Gleason 3+3 or Gleason 4. We consider serum prostate-specific antigen density (PSAd) and tumor volume (TV) as clinical features, and the grey level calculated on both the T2W and ADC map as image features. For functional features, we use two metrics extracted from the DCE signal enhancement time curve, namely the early enhanced (EE) and maximum enhancement (ME). These are defined as the first strongly enhancing post-contrast intensity divided by the first pre-contrast intensity, and the difference between the peak enhancement and the baseline intensity divided by the baseline intensity, respectively. Since the cohort used as training is imbalanced (72 Gleason 4 against 27 Gleason 3+3), the generated LR model is biased towards the recognition of the majority class making the minority class poorly recognised. To solve this problem we applied a Synthetic Minority Over-sampling technique (SMOTE)6. Here, the minority class is oversampled by considering each minority class sample and introducing synthetic examples along the line segments joining any of the minority class nearest neighbours. To select the mpMRI parameters most likely contribute to the model, a log-likelihood test of the odds ratio was used (p<0.05). Univariate analyses were constructed for each parameter, followed by multivariate analysis for the best performing parameters.Results
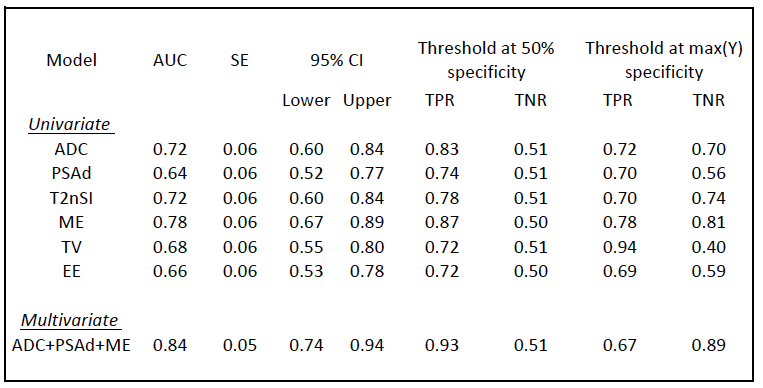
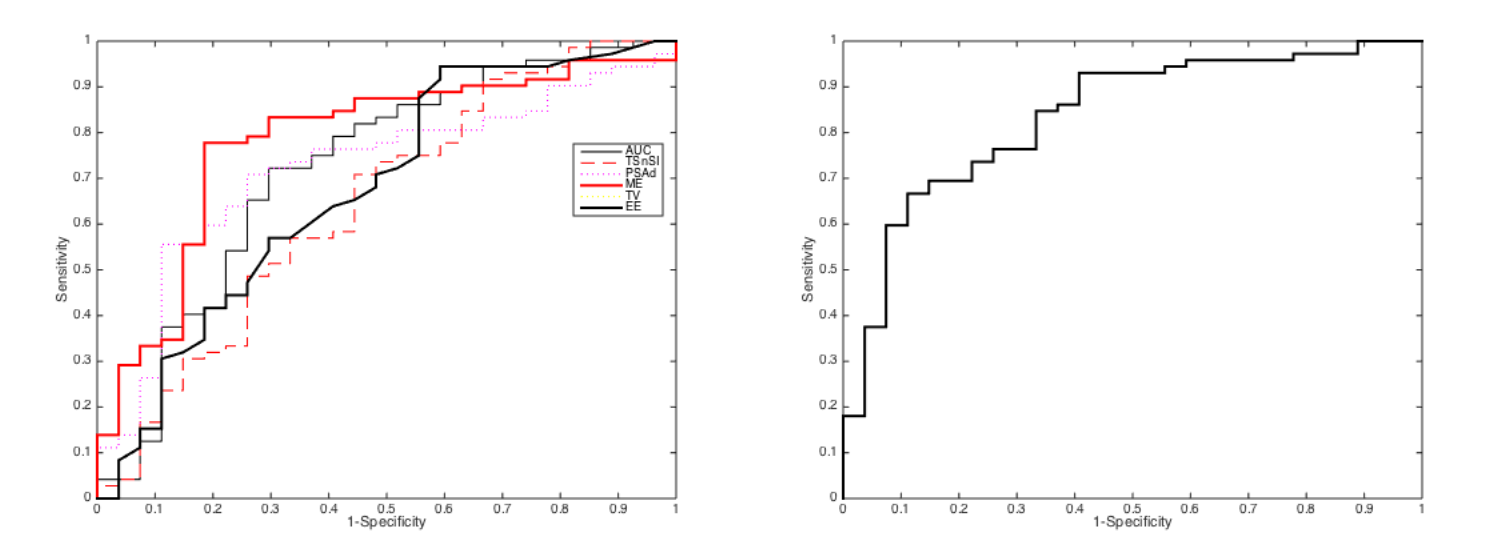
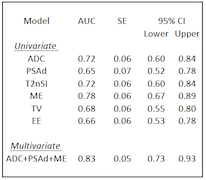
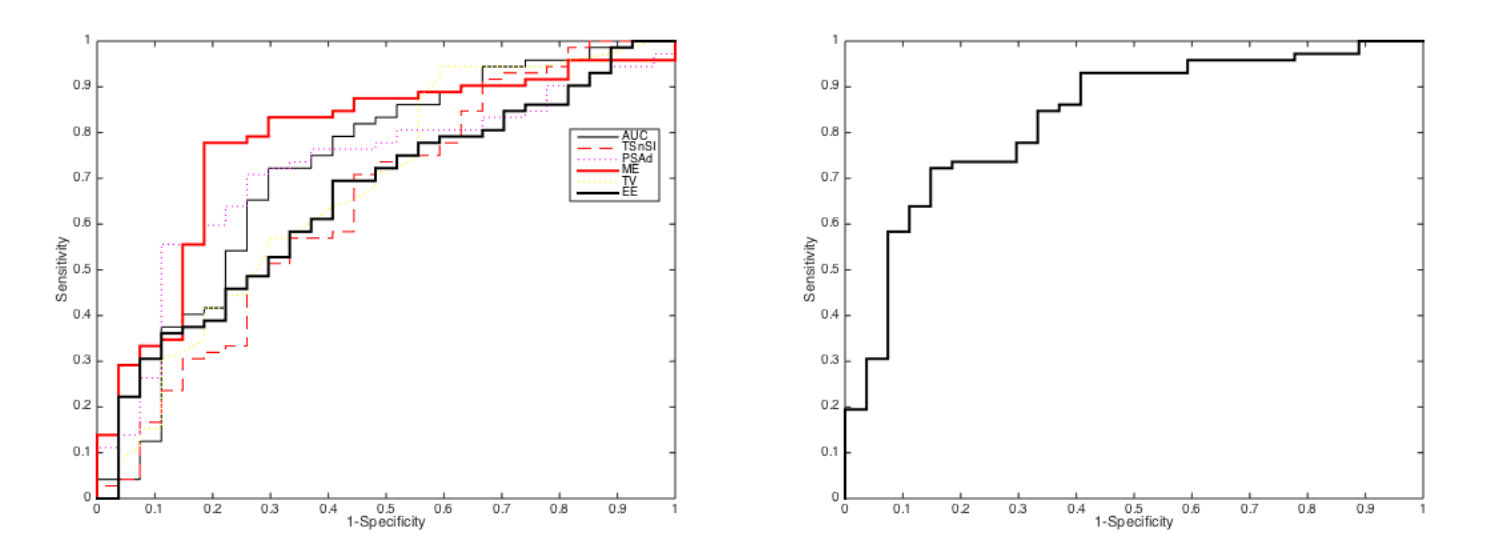
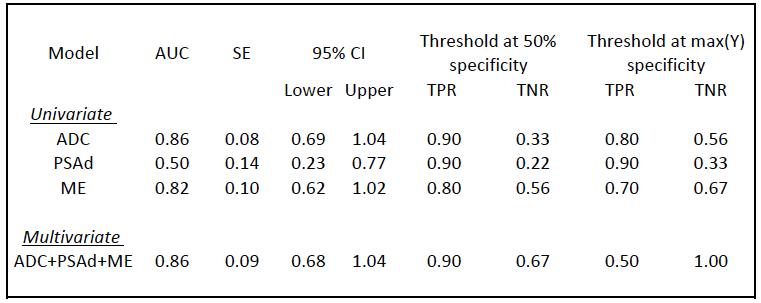
The LR model was derived using a log-likelihood score test of the odds ratio to select the mpMRI parameters most likely to contribute significantly (p<0.05) to the model. ADC, PSAd and ME were selected as the most significant ones; the regression function obtained on the training set is Logit(Pi)=-1.268-3.391*ADC+6.509*PSAd+3.536*ME. Tab. 1 and Fig. 2 show the results on the training set and the corresponding ROC curve, respectively, for both the univariate and multivariate models. While Tab. 2 and Fig. 3 show the same for the Leave-one-out (LOO) analysis. Finally Tab. 3 shows the performance obtained on the test set. To provide a tool that maximises sensitivity at a clinically acceptable false positive rate, we chose two probability thresholds for calculating sensitivity and specificity of the model: one derived at 50% specificity (allowing for 1 in 2 patients being over called for a Gleason 4 component) and the other derived at the maximum value of the Youden index7.Conclusion and discussion
Our study demonstrates that the derived LR model can predict the presence of Gleason 4 component. Indeed, at a 50% specificity we obtain a sensitivity of 93% in the training set and of 90% on the test set. Models which can predict Gleason grade would be useful for mpMRI active surveillance of patients with known cancer. Our study highlights ADC, PSAd, and ME as parameters of importance when assessing the presence of a Gleason 4 component in PZ lesions. Our model maintained its predictive capabilities in a different temporal cohort , despite the fact that tumors in the temporal validation cohort were larger with higher serum PSA levels than in the development cohort. This means the LR model is likely to be sufficiently robust to use in other patient populations.Acknowledgements
Funding for this work was received from the EPSRC, the National Institute for Health Research University College London Hospitals Biomedical Research Centre (BRC) and by the Comprehensive Cancer Imaging Centre (CCIC).References
1. 1. Albertsen PC, Hanley JA, Fine J. 20-year outcomes following conservative management of clinically localized prostate cancer. American Medical Association. 2005;293:2095–2101.
2. Lavery HJ, Droller MJ. Do gleason patterns 3 and 4 prostate cancer represent separate disease states? J Urol. Elsevier Inc.; 2012;188:1667–1675http://dx.doi.org/10.1016/j.juro.2012.07.055.
3. Tomlins SA, Mehra R, Rhodes DR, et al. Integrative molecular concept modeling of prostate cancer progression. Nat Genet. 2007;39:41–51http://www.nature.com/doifinder/10.1038/ng1935.
4. Eggener SE, Scardino PT, Walsh PC, et al. Predicting 15-year prostate cancer specific mortality after radical prostatectomy. J Urol. 2011;185:869–875
5. Wang L, Mazaheri Y, Zhang J, Ishill NM, Kuroiwa K, Hricak H. Assessment of biologic aggressiveness of prostate cancer: correlation of MR signal intensity with Gleason grade after radical prostatectomy. Radiology. 2008;246:168–176.
6. Chawla NV, Bowyer Kevin W, Hall LO, Kegelmeyer WP. SMOTE: Synthetic Minority Over-sampling Technique. Journal of Artificial Intelligence Research. 2002;16:321-357. 7. Youden WJ Index for rating diagnostic tests. Cancer. 1950;3:pp. 32–35.
Figures