2068
Diagnostic Value of Calculated High B Value DWI for Prostate Cancer Detection1Translational and Molecular Imaging Institute, Icahn School of Medicine at Mount Sinai, New York, NY, United States, 2Department of Urology, Icahn School of Medicine at Mount Sinai, New York, NY, United States, 3Olea Medical
Synopsis
We compared image quality, lesion conspicuity and diagnostic performance of calculated and acquired b1600 DW images for prostate cancer (PCa) detection and assessed the added value of calculated b2000 images for PCa detection. We showed that calculated b1600 had equivalent image quality and diagnostic performance for PCa detection compared to acquired b1600 images with improved tumor-to-PZ contrast ratio, which suggests that calculated b1600 could be an alternative to acquired b1600 to decrease acquisition time. We also showed that calculated b2000 had better tumor conspicuity than b1600.
Purpose
To compare image quality, lesion conspicuity and diagnostic performance of acquired b1600 (a_b1600) and calculated (c_b1600) DW images for prostate cancer (PCa) detection and to assess the added value of c_b2000) images for PCa detection.Methods
Patients: 33 men with 54 pathologically proven PCa and 7 patients without PCa (mean age 61 y) were included in this IRB approved retrospective study.
MRI acquisition: All patients underwent prostate MRI performed without endorectal coil at 3T. The imaging protocol included axial, sagittal and coronal TSE T2WI, axial TSE T1WI, axial DWI with 3 b values (50, 1000 and 1600 s/mm2), and DCE-MRI using axial TWIST VIBE sequence before and after contrast injection.
Image processing: Using the Olea Sphere software (Olea, La Ciotat, France) and a mono-exponential Bayesian approach, the following images were computed: c_b1600 and ADC map (ADC2b) with b50 and b1000 acquired data; and c_b2000 and ADC map (ADC3b) with b50, b1000 and b1600 acquired data.
Qualitative image analysis: 3 image sets were assessed by 2 independent observers in separate reading sessions: set1 (a_b1600/ADC3b), set2 (set1 + c_b2000) and set3 (c_b1600/ADC2b) to assess the added value of calculated b value images. T2, T1, DWI (b50/b1000) and DCE-MR images were included in each image set. The observers assessed image quality of a_b1600 images, c_b1600 images and c_b2000 images, based on 5 quality parameters using a 5-point scale and the quality of the 2 ADC maps using the same scale. For each lesion, the lesion conspicuity (on a 5-point scale), DWI PI-RADS v2 score and global PI-RADS v2 score were assessed.
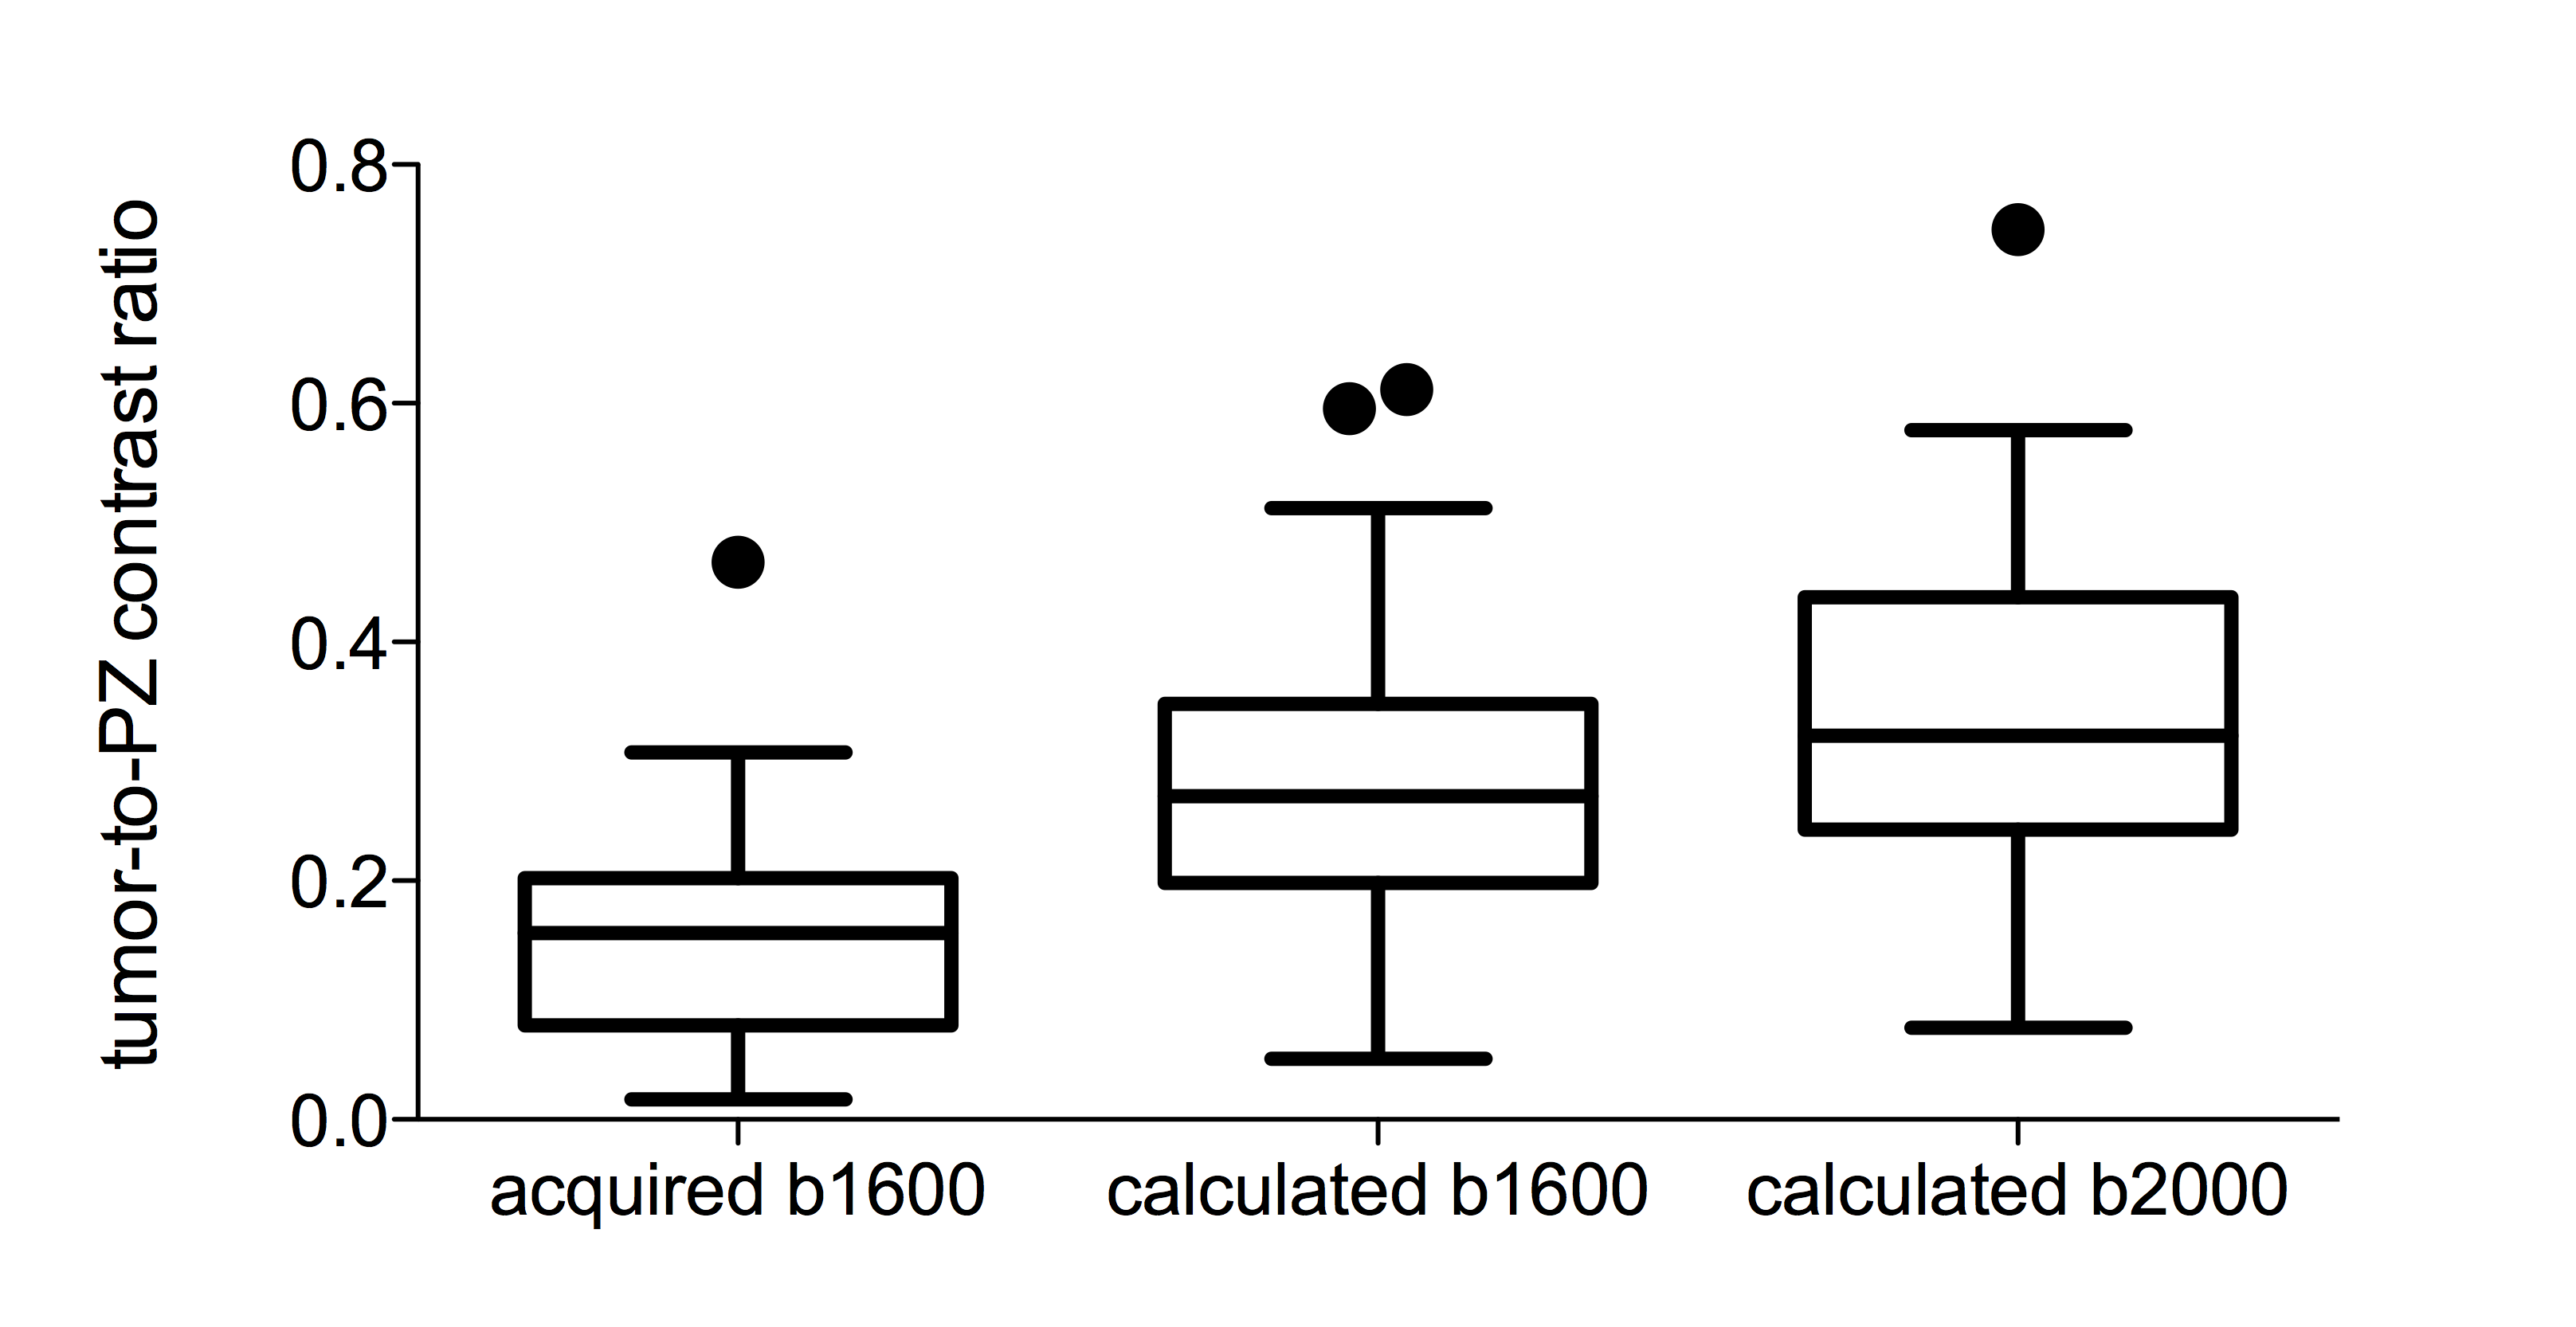
Quantitative analysis: A 3rd observer measured tumor-to-PZ contrast ratio using the flowing formula: |(SIPZ – SIlesion)/ (SIPZ + SIlesion)|, (SIPZ: signal intensity in the peripheral zone and SIlesion: signal intensity in the PCa).
Reference standard: Reference standard was established by integration of all MRI findings and pathological data. Statistical analysis: Image quality, lesion conspicuity, tumor-to-peripheral zone (PZ) contrast ratios and PIRADS classification were compared using Wilcoxon signed rank test between datasets.
Results
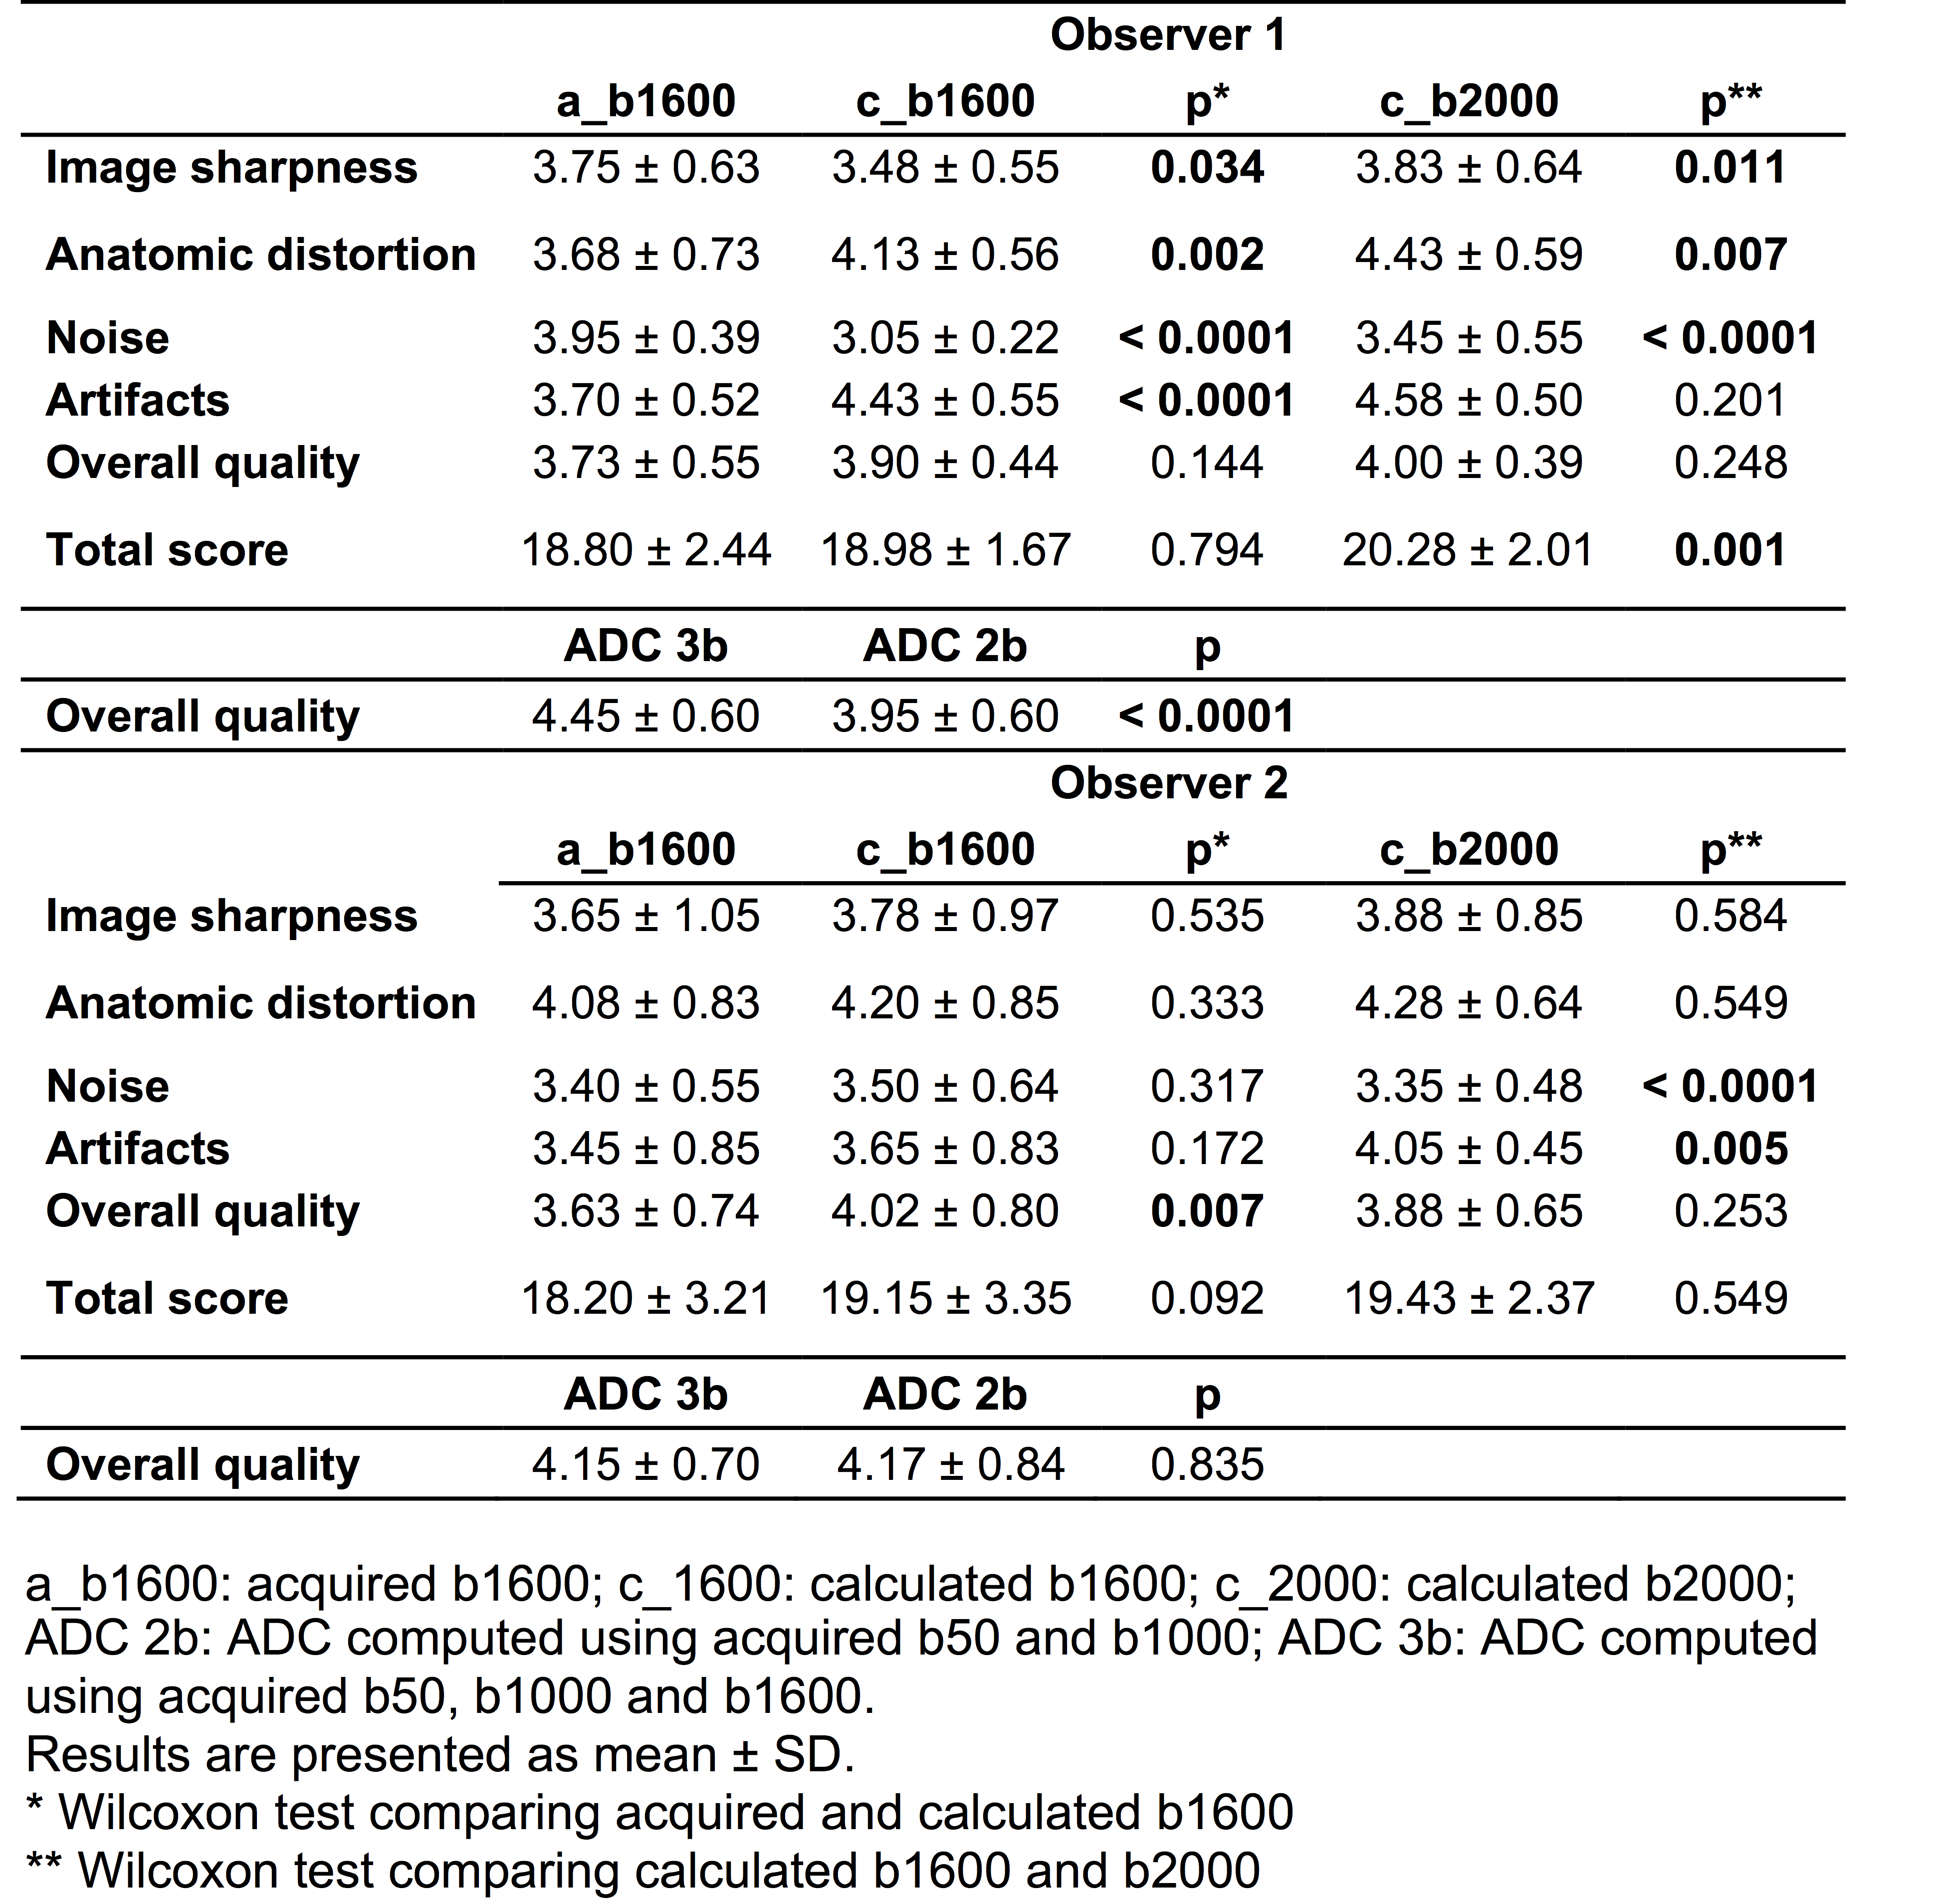
There was no difference in image quality between a_b1600 and c_b1600 (p >0.092). Image quality scores of c_b2000 were significantly higher than c_b1600 for one observer (p=0.001 for observer 1 and p=0.549 for observer 2), as well as the ADC3b quality compared to ADC2b (p <0.0001 for observer 1 and p=0.835 for observer 2) (Table 1).
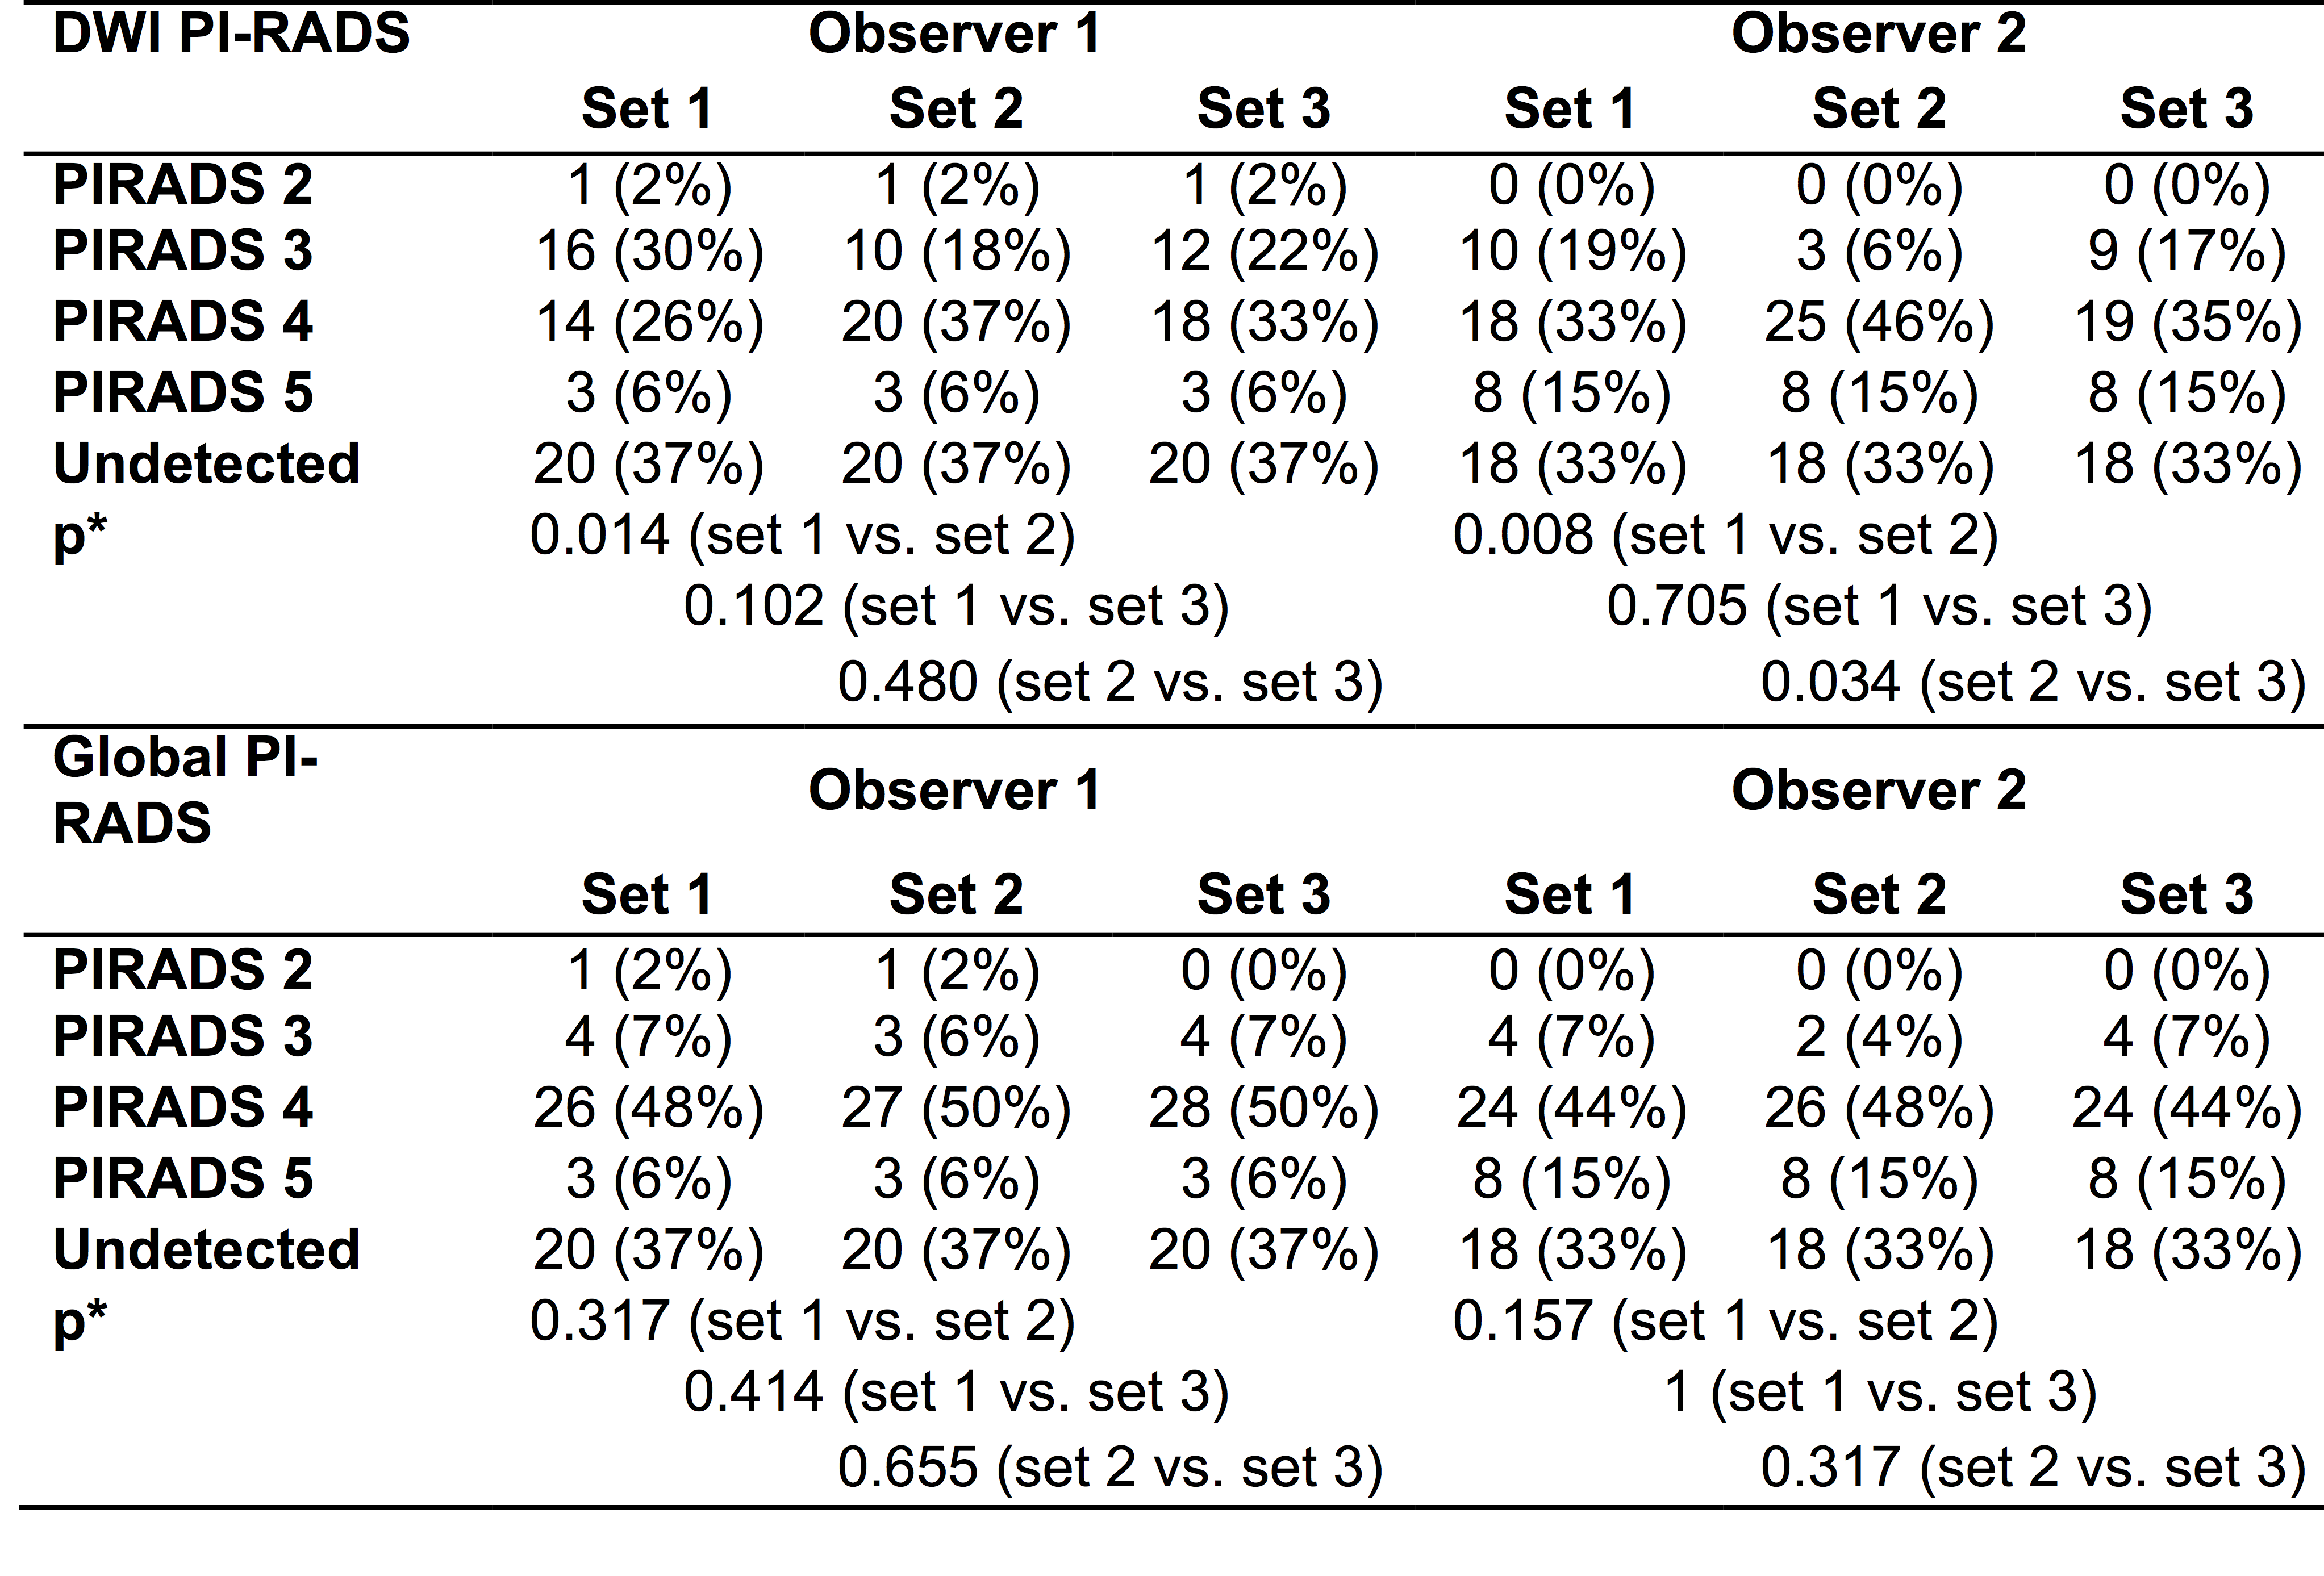
Observer 1 detected 34/54 (63%) and observer 2 detected 36/54 (67%) of tumors using T2WI, DCE-MRI and with the 3 sets of DW images. There was no difference in lesion classification according to global PIRADSv2 score between the 3 image sets. For DWI PI-RADS score, set2 had a significant larger number of PI-RADS 4 lesions compared to set1 for both observers (p=0.014/0.008) and compared to set3 for observer 2 (p=0.034) (Table 2).
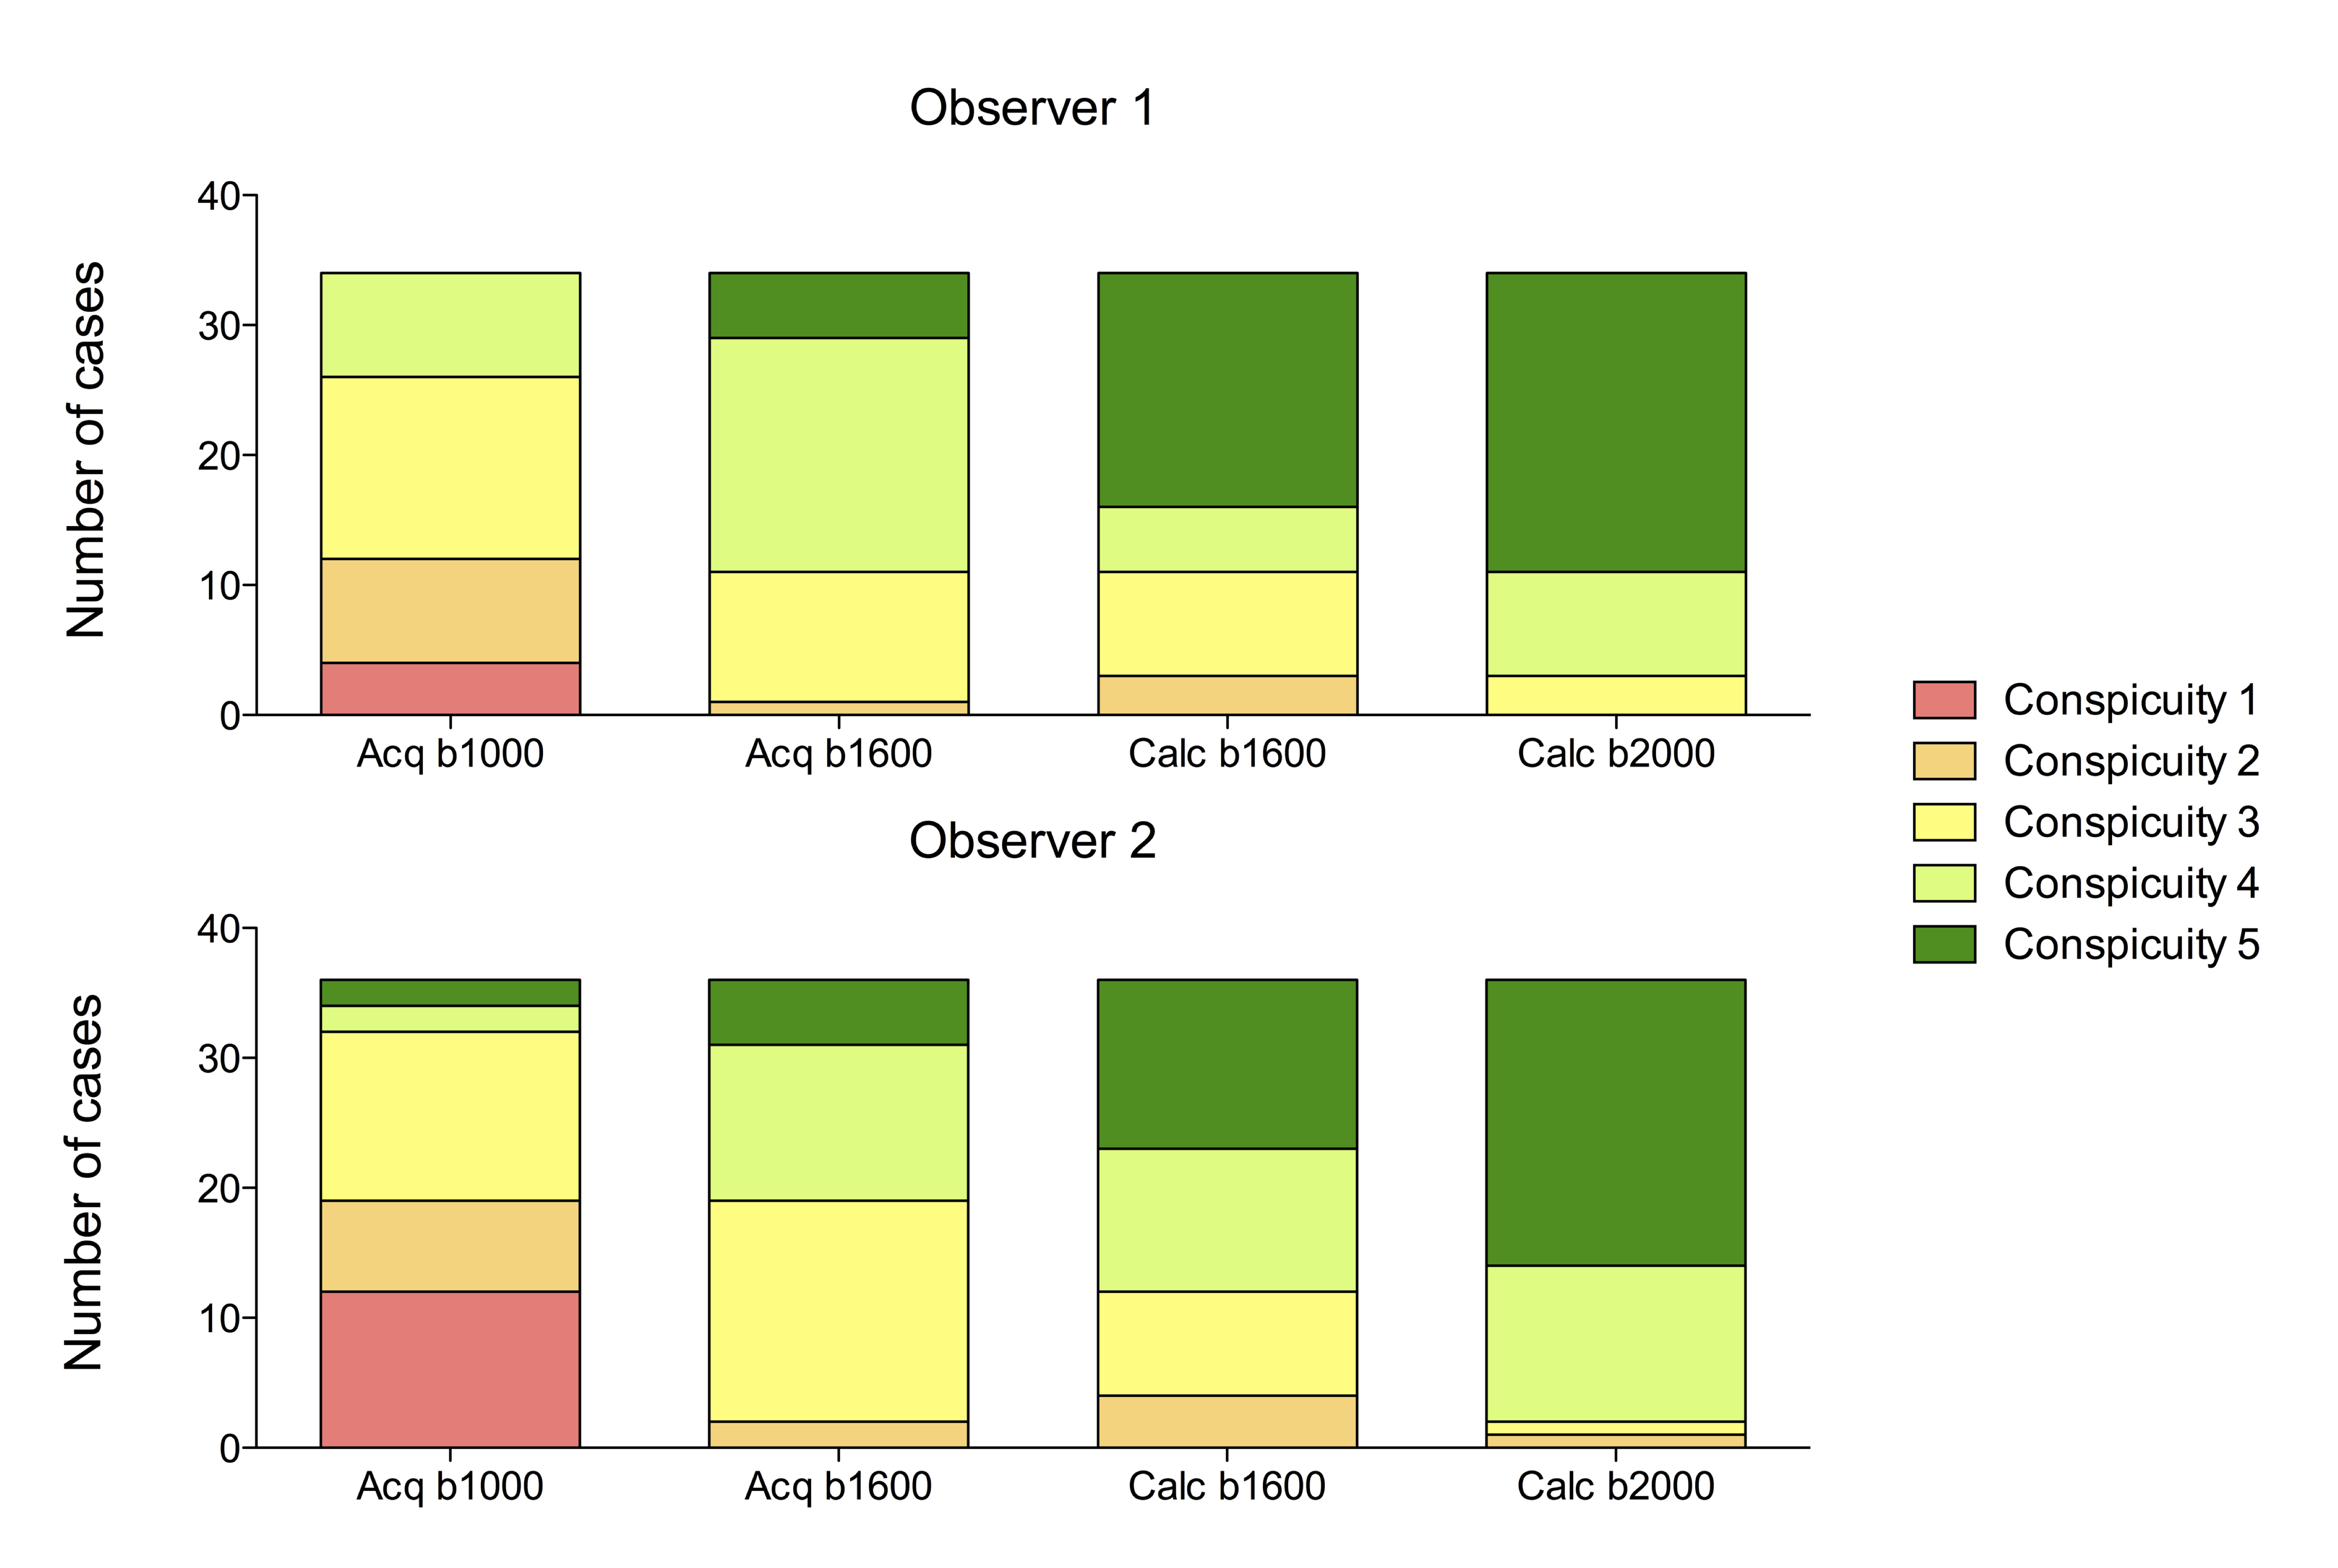
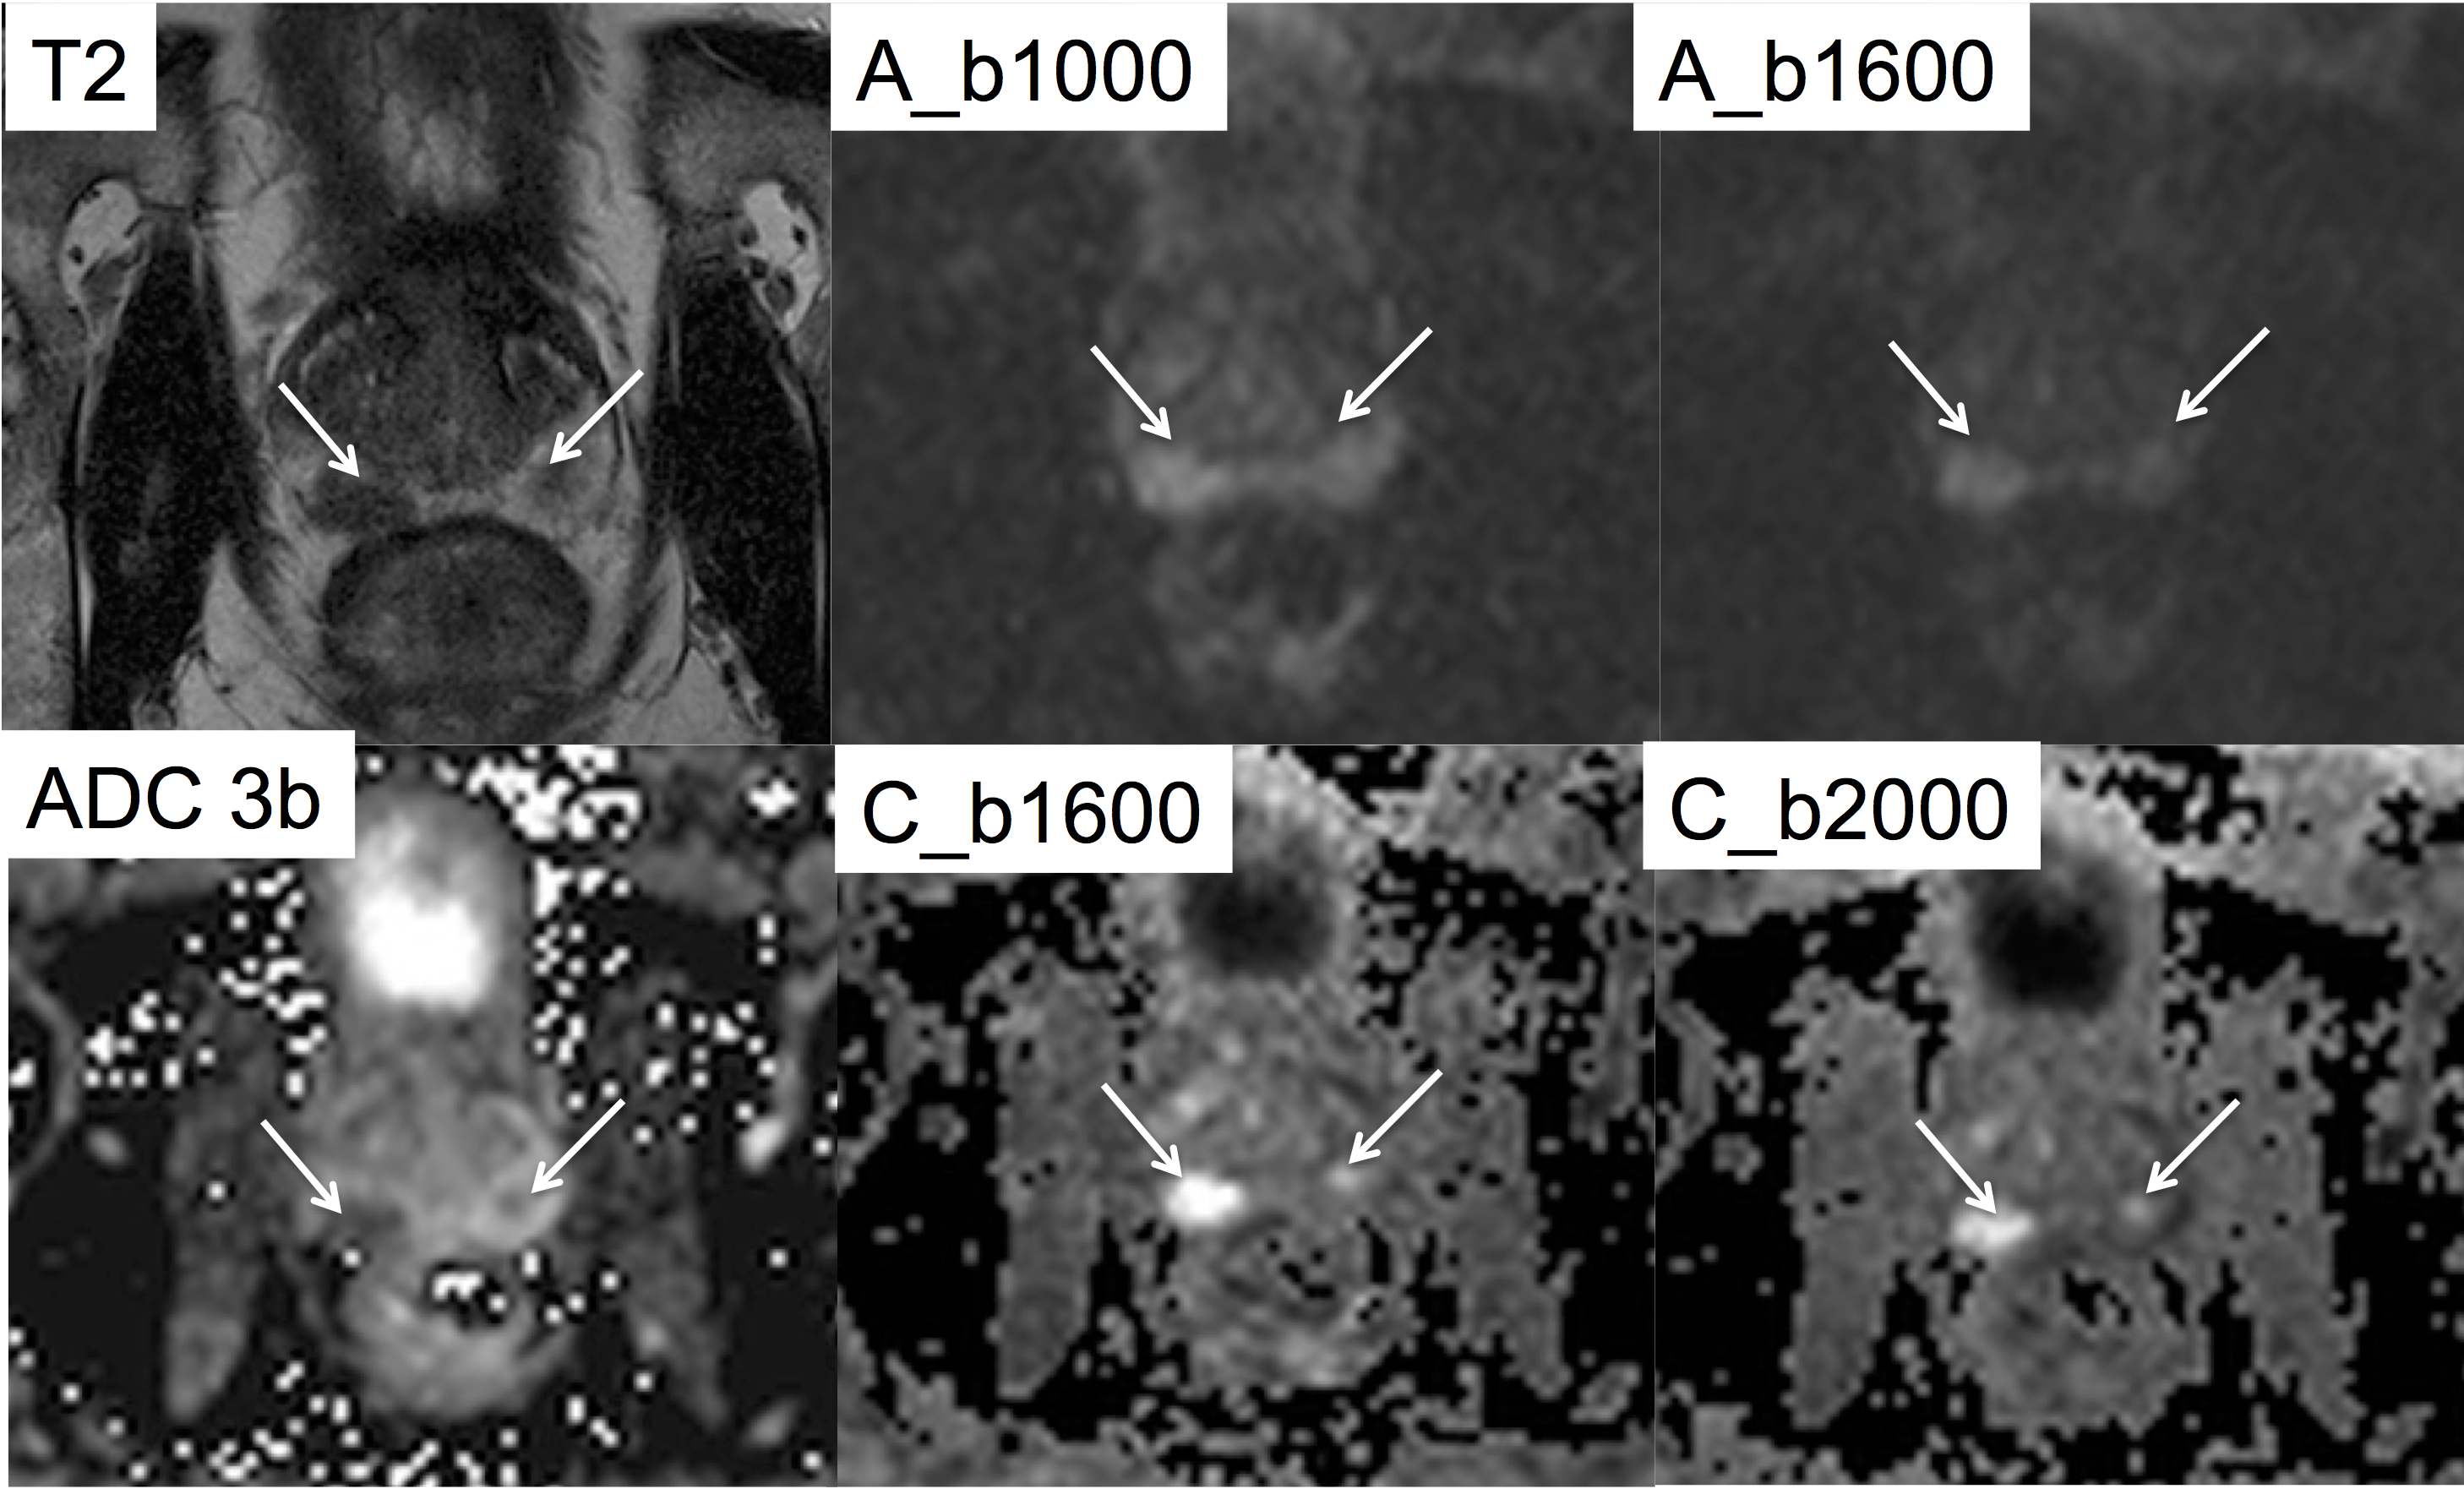
Lesion conspicuity of c_b2000 images was significantly higher than that of c_b1600 and a_b1600 (p <0.019) for both observers. Lesion conspicuity for c_b1600 images was significantly higher than that of a_b1600 for observer 2 (p=0.009) (Figures 1-2). Tumor-to-PZ contrast ratio was significantly higher with c_b2000 compared to both a_b1600 and c_b1600 (p <0.0001) (Figures 2-3).
Discussion
In this study, we demonstrated that c_b1600 images had equivalent image quality and diagnostic performance for PCa detection compared to a_b1600 images with improved tumor-to-PZ contrast ratio. Even if the diagnostic performance of c_b2000 DW images was equivalent compared to b1600, there was better lesion conspicuity using c_b2000 images and a trend towards improved sequence performance with the upgrade of several lesions from PIRADS 3 to PIRADS 4.Conclusion
Calculated high b-value DWI with values ≥ b1600 could be a reasonable alternative to acquired high b-value DWI.Acknowledgements
No acknowledgement found.References
Weinreb JC, Barentsz JO, Choyke PL, et al. PI-RADS Prostate Imaging - Reporting and Data System: 2015, Version 2. Eur Urol. 2016;69(1):16-40.
Padhani AR, Liu G, Koh DM, et al. Diffusion-weighted magnetic resonance imaging as a cancer biomarker: consensus and recommendations. Neoplasia. 2009;11(2):102-25.
Blackledge MD, Leach MO, Collins DJ, et al. Computed diffusion-weighted MR imaging may improve tumor detection. Radiology. 2011;261(2):573-81.
Rosenkrantz AB, Parikh N, Kierans AS, et al. Prostate Cancer Detection Using Computed Very High b-value Diffusion-weighted Imaging: How High Should We Go? Acad Radiol. 2016.
Figures