2060
Renal perfusion is decreased in kidneys with multiple renal arteries as demonstrated by renal DCE MRI1Center for Image Sciences, University Medical Center Utrecht, Utrecht, Netherlands, 2Nephrology, University Medical Center Utrecht, Utrecht, Netherlands, 3Radiology, University Medical Center Utrecht, Utrecht, Netherlands
Synopsis
The presence of multiple renal arteries per kidney is associated with hypertension. The smaller vessel diameter is thought to lead to decreased renal perfusion, which activates the renin-angiotensin-aldosterone system (RAAS), resulting in increased systemic blood pressure. We measured renal blood flow (RBF) using dynamic contrast enhanced (DCE) MRI to investigate the relation between number of renal arteries, RAAS activity and RBF. The number of renal arteries was associated with reduced RBF and increased RAAS activity. In all patients, we observed that reduced RBF was associated with increased RAAS activity.
Background
Hypertension is a major health issue, estimated to account for about half of all strokes and ischemic heart disease events globally.1 In most patients, no underlying cause for hypertension is identified.2 The presence of multiple renal arteries per kidney is known to be associated with hypertension.3 A possible explanation for this finding is that in accordance with Poiseuille’s law,3 the smaller vessel diameter in accessory arteries leads to increased flow resistance and, subsequently, increased activity of the renin-angiotensin-aldosterone system (RAAS). Ultimately, this results in increased systemic blood pressure. In this work we aimed to use dynamic contrast-enhanced (DCE) MRI to measure renal blood flow (RBF) and investigate the relation between the number of renal arteries, RAAS activity and RBF.Methods
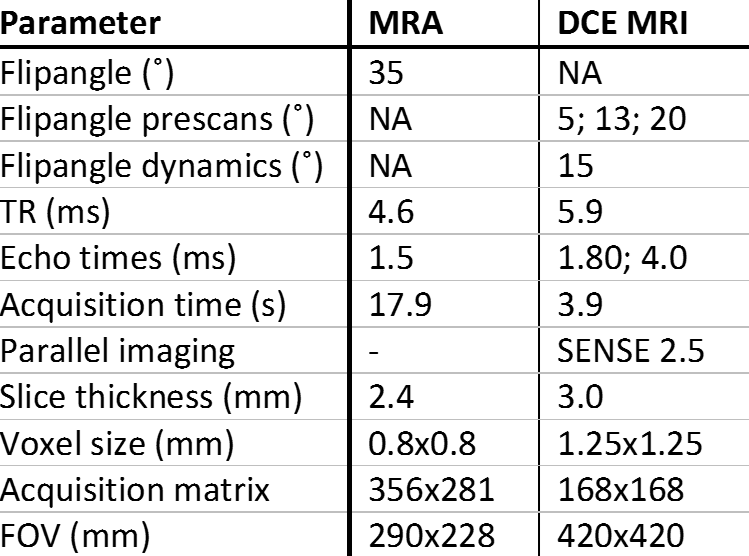
Data of a larger study on renal denervation in difficult-to-control hypertension were used. Patients with primary hypertension of whom DCE imaging was available were included in the present study. Detailed information on inclusion criteria, clinical measurements and procedures were published earlier.4 All measurements were performed after withdrawal of medication likely to influence renal hemodynamics. In all patients, plasma creatinine, plasma renin activity (PRA) and plasma aldosterone concentrations (PAC) were measured. To estimate glomerular filtration rate (eGFR), the CKD-EPI formula was used.5 MR examinations were performed on a 1.5T MR system (Ingenia, software release 5.1, Philips Healthcare, Best, the Netherlands). MRA and DCE MRI were performed in a single session. Imaging parameters for both MRA and DCE MRI are provided in table 1. MRA was performed using a T1 weighted contrast enhanced gradient echo sequence. For DCE MRI a 3D dual-echo gradient-echo protocol with Dixon reconstruction was used.6 Three pre contrast acquisitions (prescans) were acquired for determination of pre-contrast R1. Subsequently, a dynamic series consisting of 25 scans was acquired. During the dynamic series, 0.15mmol/kg of gadobutrol (Gadovist, Bayer Healthcare, Berlin, Germany) was infused, followed by a 25mL saline flush. Dixon water-only and fat-only images were generated. The kidney and an arterial ROI were delineated on the water images. Fat images were used for image registration to correct for respiratory motion, which was performed separately for both kidneys. To obtain quantitative information on renal perfusion, time intensity curves obtained from the water dynamics were fitted to Tofts’ renal specific two-compartment model.7 RBF was calculated per 100mL of renal tissue. Statistical analysis was performed in SPSS, version 21.0 (IBM Corp., Armonk, NY, USA). A p-value less than 0.05 was considered statistically significant. Non normally distributed variables underwent logarithmic transformation if necessary. Either the unpaired Student’s t-test or linear regression analysis was used, when applicable.Results
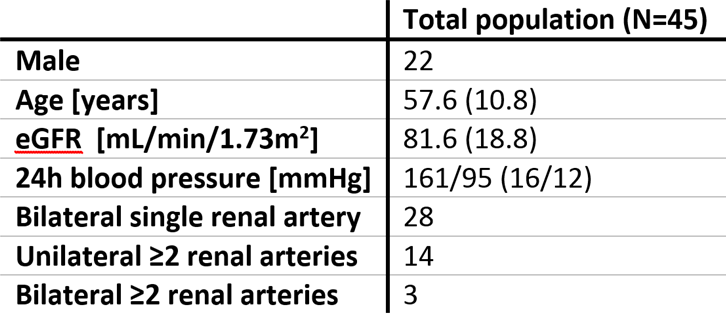
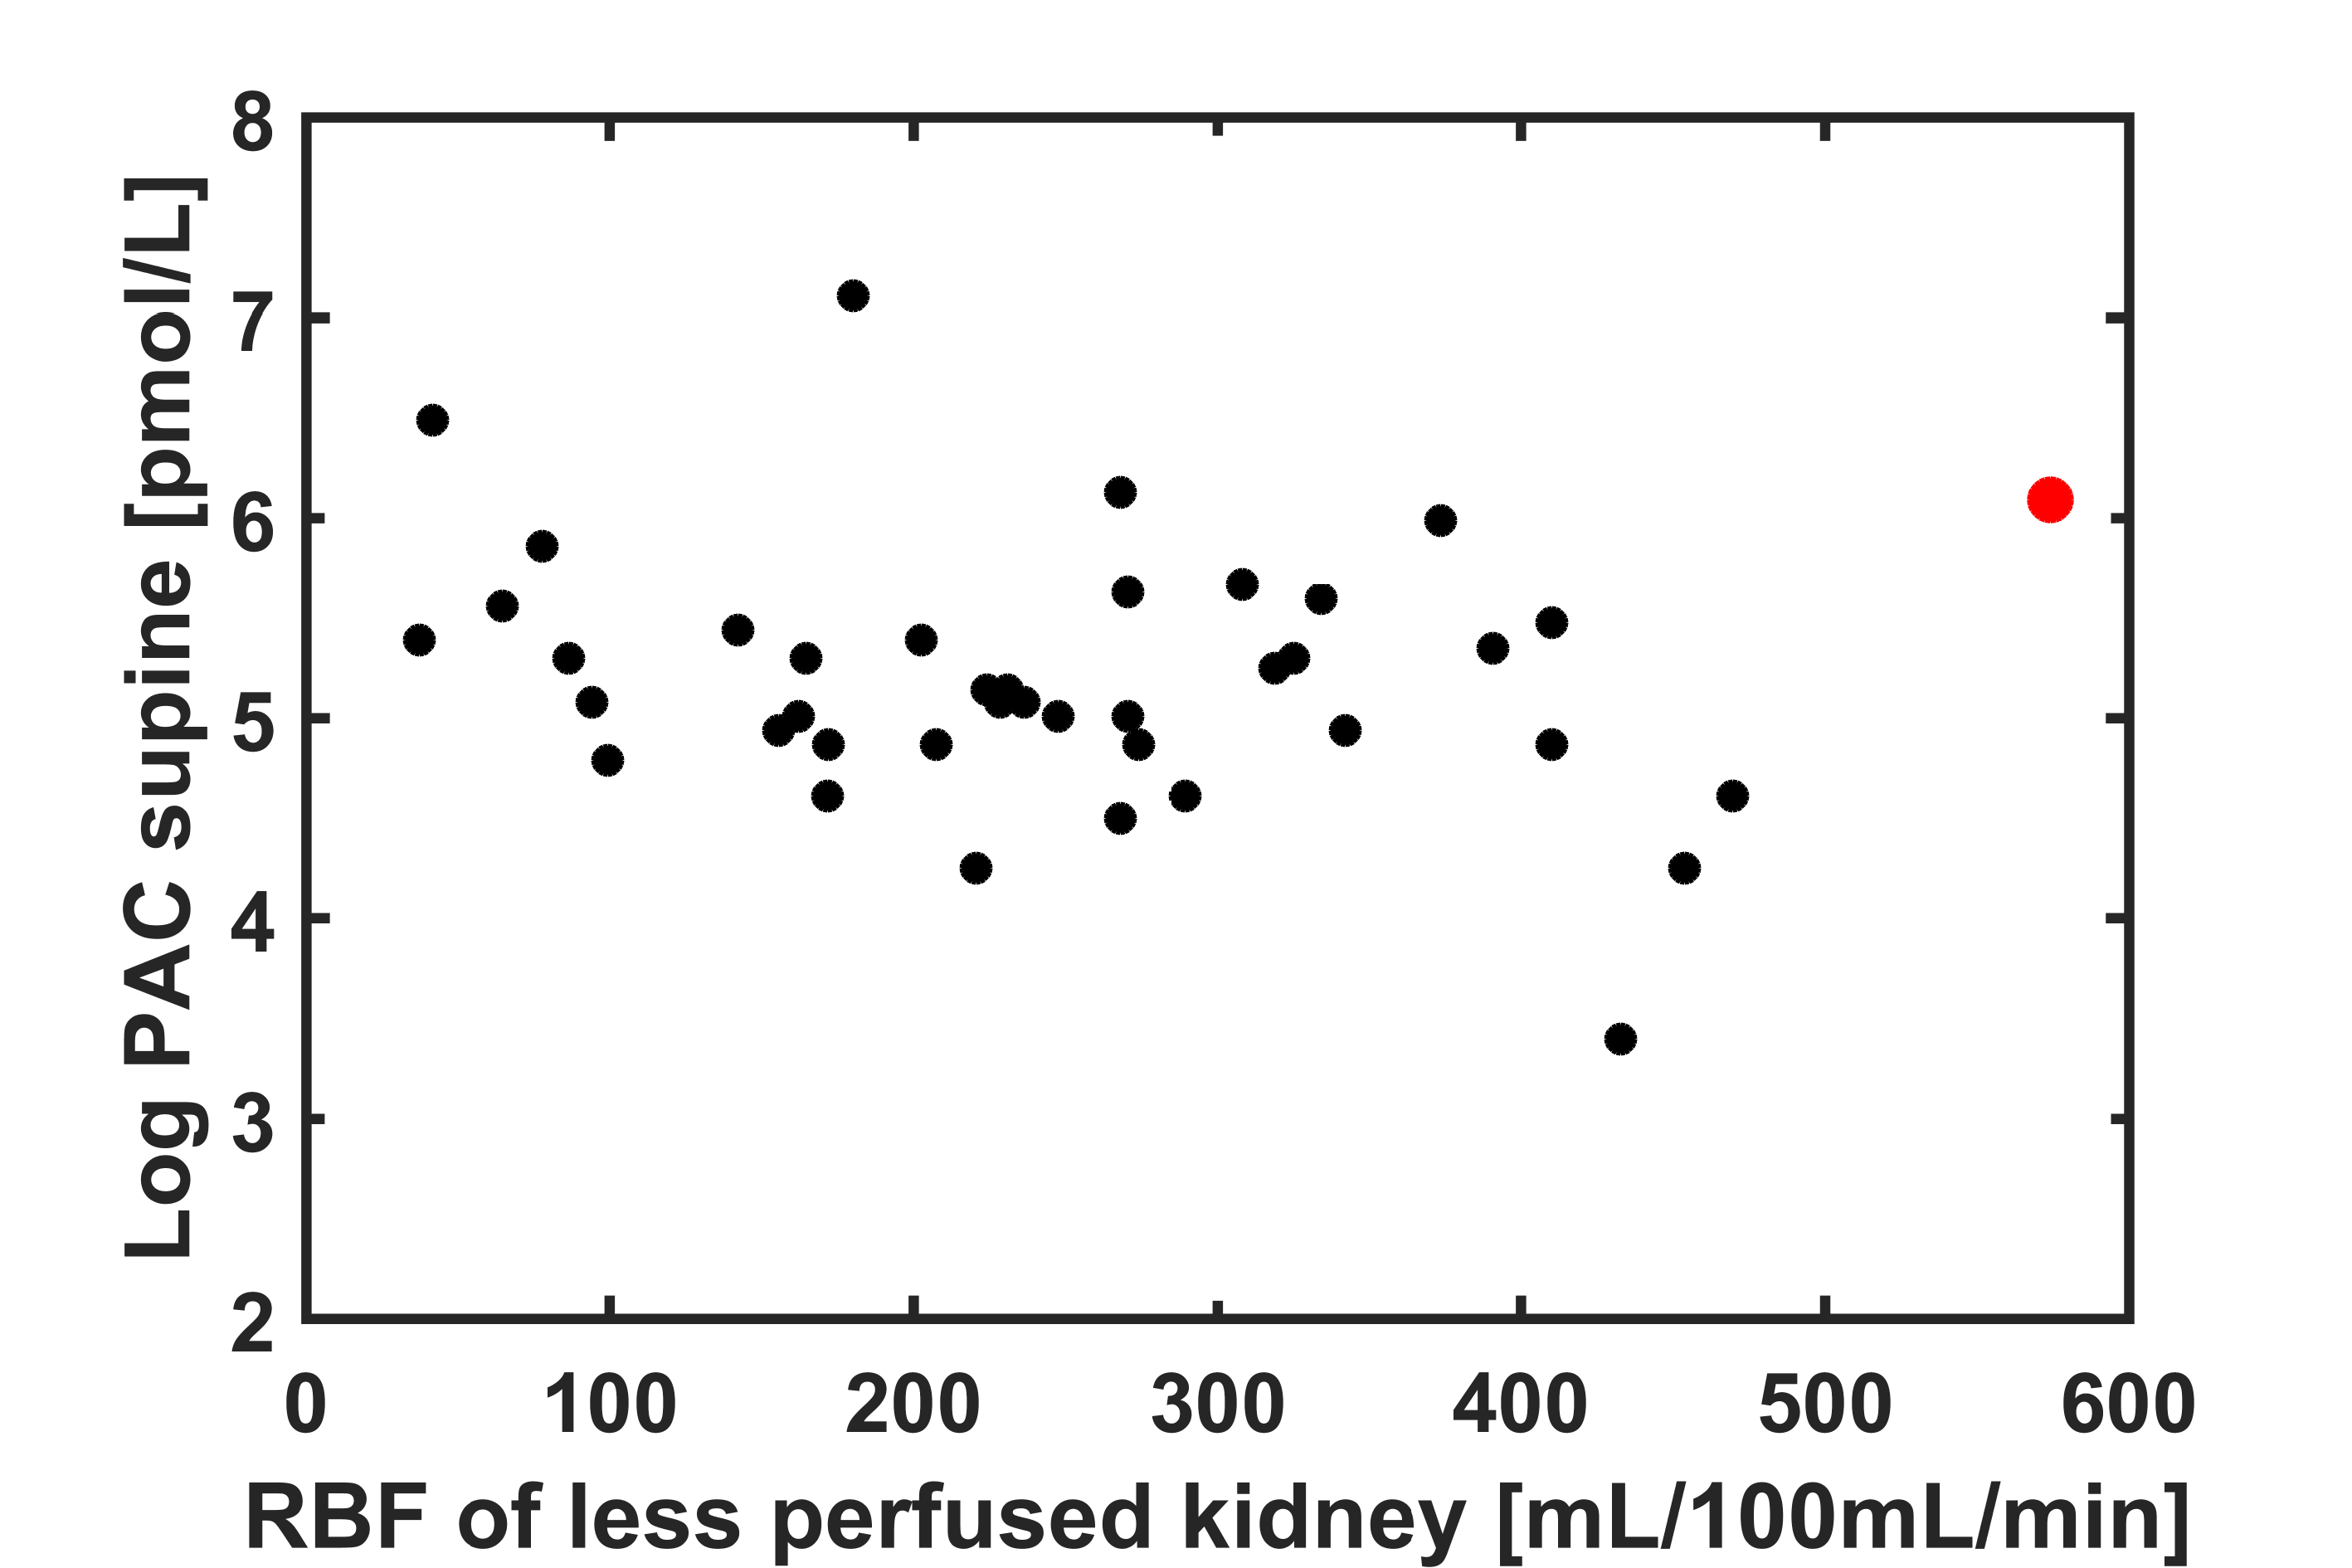
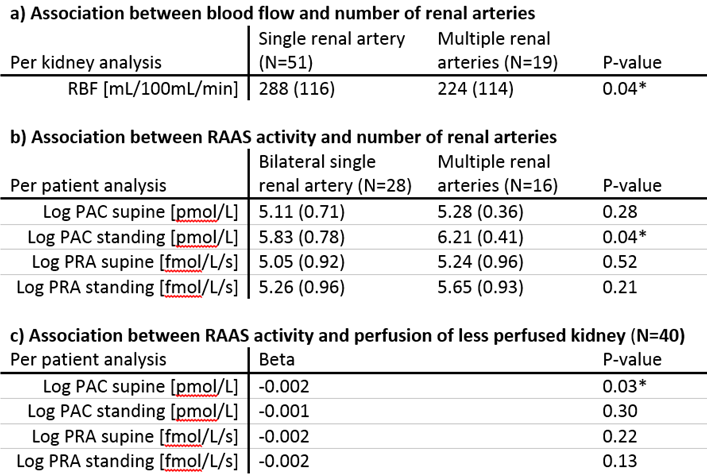
Complete MR data was available in 48 patients. In three patients, medication withdrawal was not achievable. The remaining 45 patients were included in the present analysis. In four patients, DCE data of either the right or left kidney was excluded because of residual respiratory motion after image registration. Baseline characteristics are depicted in table 2. After inspection of the data, one outlier with bilateral extremely high RBF was excluded (figure 1). The presence of multiple renal arteries was significantly associated with elevated PAC measured in standing position (6.21±0.41 vs 5.83±0.78pmol/L, P=0.04). RBF was significantly reduced in kidneys with multiple renal arteries (224±114 vs 288±116mL/100mL/min, P=0.04). Furthermore, we observed that RBF of the less perfused kidney, assumed to drive RAAS activation, was inversely associated with elevated PAC in supine position (β -0.002, P=0.03, figure 1). The same analyses were performed for PRA, but associations with PRA were not significant. Results are summarized in table 3.Discussion
We aimed to investigate the relation between the presence of multiple renal arteries, renal perfusion and RAAS activity. As we expected, the presence of multiple renal arteries was consistently associated with reduced RBF and increased RAAS activity. Furthermore, reduced RBF was associated with increased RAAS activity. Our data support the hypothesis of RAAS activation due to decreased renal perfusion in patients with multiple renal arteries.Acknowledgements
No acknowledgement found.References
1. Lawes CM, Vander Hoorn S, Rodgers A. Global burden of blood-pressure-related disease, 2001. Lancet 2008;371(9623):1513-1518.
2. Staessen JA, Wang J, Bianchi G et al. Essential hypertension. Lancet 2003;361(9369):1629-1641.
3. Glodny B, Cromme S, Wörtler K et al. A possible explanation for the frequent concomitance of arterial hypertension and multiple renal arteries. Med Hypotheses 2001;56(2):129-33.
4. Vink EE, de Boer A, Hoogduin HJ et al. Renal BOLD-MRI relates to kidney function and activity of the renin-angiotensin-aldosterone system in hypertensive patients. J Hypertens 2015;33(3):597-603
5. Levey AS, Stevens LA, Schmid CH et al. A new equation to estimate glomerular filtration rate. Ann Intern Med. 2009;150(9):604-12.
6. Eggers H, Brendel B, Duijndam A et al. Dual-echo Dixon imaging with flexible choice of echo times. Magn Reson Med. 2011;65(1):96-107.
7. Tofts PS, Cutajar M, Mendichovszky IA et al. Precise measurement of renal filtration and vascular parameters using a two-compartment model for dynamic contrast-enhanced MRI of the kidney gives realistic normal values. Eur radiol. 2012;22(6):1320-1330.
Figures