2059
Phosphorus MRSI reveals subtle changes in metabolic profile of hepatic tissue in insulin resistant population.1Endocrinology & Metabolism, Internal Medicine III, Medical University of Vienna, Wien, Austria, 2High-field MR Centre, Department of Biomedical Imaging and Image-guided Therapy, Medical University of Vienna, Wien, Austria, 3Clinical Molecular Imaging, Karl Landsteiner Institute, Wien, Austria
Synopsis
This study employed ultra-high field (7T) 1H and 31P MRS for the characterization of subtle hepatic tissue changes in insulin sensitive and insulin resistant group of healthy volunteers. Hepatic lipids, the forward rate of ATP synthesis and profile of metabolites containing 31P were assessed. Decreased inorganic phosphate was found in the subgroup of volunteers with increased hepatic fat accumulation and increased phosphocholine was found in the insulin sensitive subgroup. Concentration of 31P containing metabolites found here are well within the range of previous publications and subtle differences point towards their role in pathophysiology of metabolic syndrome and/or hepatic steatosis.
Introduction
Increased lipid accumulation, decreased elasticity of glucose handling and decreased steady state energy metabolism are present in type 2 diabetes mellitus and non-alcoholic fatty liver disease 1-3. Assessment of absolute concentrations of 31P containing metabolites, ATP-ase forward flux and its links to hepatocellular lipid content could improve understanding liver conditions on a molecular basis already in pre-diabetic insulin resistant state. Ultra-high field MR spectroscopy yields additional improvement in spectral resolution and SNR per time unit4 . The aim of this study was employ the strategy for absolute quantification 31P metabolites5 to compare metabolic status in hepatic tissue of healthy volunteers with broad range of insulin sensitivity.Methods
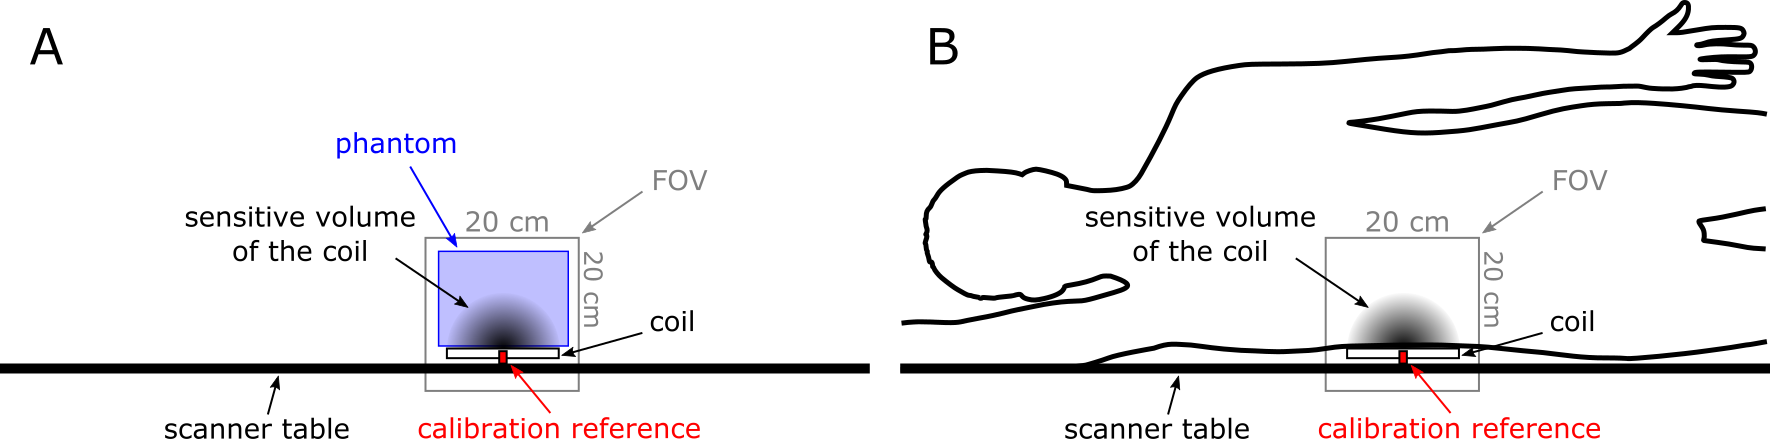
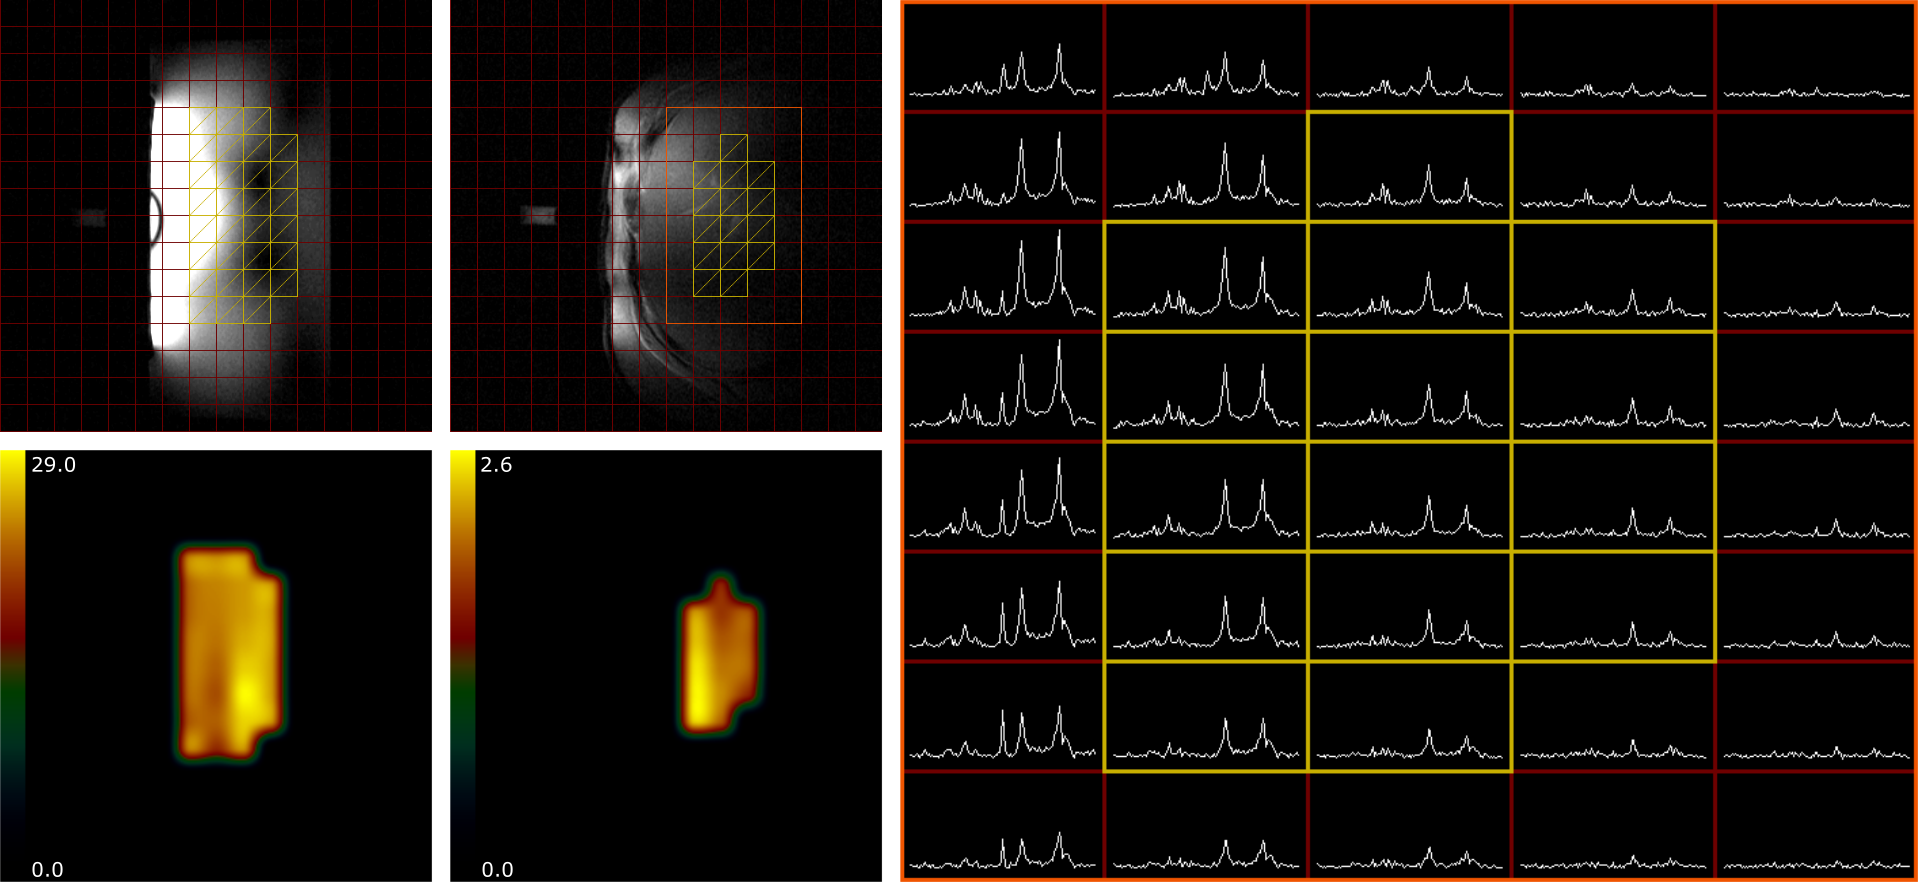
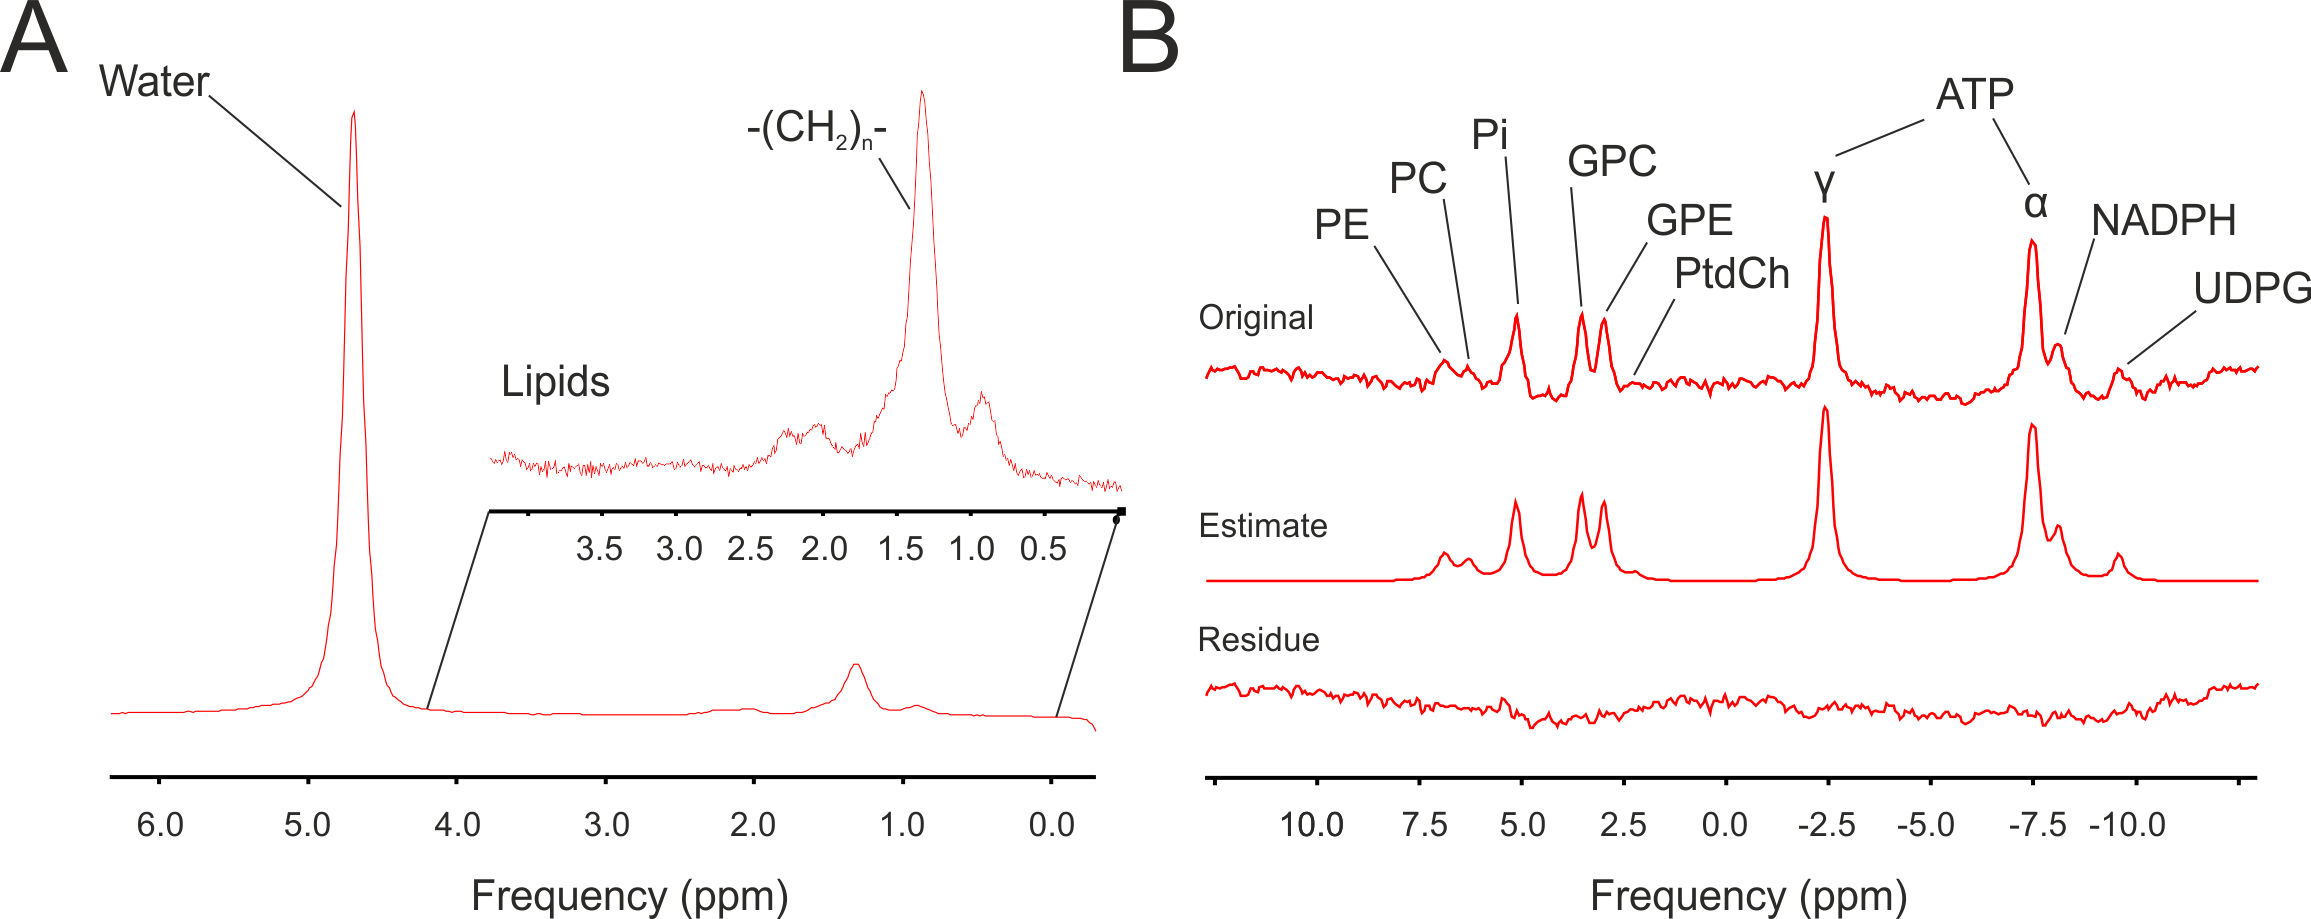
Up to now, 12 healthy volunteer (7m/5f, age: mean= 56±2 y age range: 46-70y., BMI= 25.5±1.0 kg.m-2 , range: 20.5 – 31.6, normal fasting plasma glucose, insulin and liver enzymes) took part in the study. Insulin sensitivity was assessed in 180 min oral glucose tolerance test as oral-glucose-insulin-sensitivity-index at time point of 120 minutes (OGIS_120). MR measurements were performed in 7T Magnetom MR system (Siemens Healthineers, Erlangen, Germany) using a double tuned 1H/31P surface coil (10cm, Rapid Biomedical, Rimpar, Germany) with volunteers in right lateral position laying on the top of the RF-coil. For the measurements of absolute concentrations of 31P metabolites a 3D-FID based CSI (FOV:20x20x20 cm3, matrix:12x12x12 zero-filled to 16x16x16, 600 μs block pulse,TR=1.8s) was employed. A coil load was calibrated with small 31P containing phantom (Fig.1). Spectra from selected voxels (no obvious PCr contamination, sufficient SNR) were fitted with AMARES algorithm in jMRUI and then compared with the corresponding phantom data (25 mM inorganic phosphate solution, Fig 2.). Spectral lines of phosphoetanolamine (PE), phosphocholine (PC), inorganic phosphate (Pi), glycerophosphoetanolamine (GPE), glycerophosphocholine (GPC), phosphotydilcholine (PtdC), adenosine triphosphate (γ-, α- ATP), nicotinamidadenindinucleotidphosphate (NADPH), and uridinephosphate-glucose (UDPG) were included into prior knowledge. Forward rate and flux through of ATP-synthesis was assessed by 1D localized saturation transfer (ST) measurement described and validated previously3. Hepatocellular lipid accumulation was measured by ultra-short echo 1H MRS (TE= 6 ms, TR= 4s, NA= 16) on a single voxel (3x3x3 cm3) placed well within hepatic parenchyma6. Total measurement time did not exceed 70 minutes.Results
Hepatocellular lipid content ranged between 1.37 and 23.6% of T2 corrected signal and volunteers also presented with broad range of insulin sensitivity (OGIS_120: 312 a.u.– 570 a.u.). Successful 31P CSI and ST measurements were performed in all volunteers in broad range of BMI and thickness of abdominal adipose tissue. Representative 1H and 31P MR spectra are given in the Fig 2. No significant correlation between any 31P MRS derived measure, HCL and insulin sensitivity was found on the pooled data from the whole study group. Splitting the data based on hepatocellular lipid content (cut-off: HCL= 5,5%, n= 5/7) revealed higher concentration of Pi in low HCL group (1.5±0.1 vs 1.2±0.1 mM, p=0.028) and tendency to higher PDE, both GPC and GPE (p=0.1), in high HCL group. Grouping the data according to the indexes of insulin sensitivity (cut-off OGIS_120= 440 a.u., n= 6/6) revealed increased PC (1.15±0.05 vs 0.71±0.08 mM, p=0.003) and tendency to higher α-ATP and Pi (p=0.1) in insulin sensitive group. No statistical differences were found in the ATP synthetic rate and/or flux in this respect.Discussion / Conclusion
Experience and data gained in this study confirm the possibility to perform a complex measurement protocol within acceptable time frame on broad range of volunteers. Concentration values of 31P containing metabolites are well within the range of previous publications and subtle differences and tendencies found here point towards their role in pathophysiology of metabolic syndrome and/or hepatic steatosis. More detailed statistical analysis was limited by rather low sample size in this preliminary study.Acknowledgements
The study was supported by Anniversary Fund of Austrian National Bank #15363.References
1. Krssak et al. Diabetes. 2004;53(12):3048-56
2. Szendroedi et al. Hepatology. 2009; 50(4):1079-86
3. Valkovic et al. Eur Radiol. 2014; 24(7):1602-9
4. Chmelik et al. NMR Biomed. 2014;27(4):478-85.
5. Chmelík et al. Magn Reson Med. 2008;60(4):796-802
6. Gajdosik et al. NMR Biomed. 2015;28(10):1283-93
Figures