2057
Quantitative MRI parameters for adipose tissue characterization in obese patientsNikita Garnov1,2, Stefanie Lehmann2, Ulf Retschlag2, Nicolas Linder1,2, Alexander Schaudinn1,2, Arne Dietrich2,3, Andreas Oberbach2, Thomas Kahn1, and Harald Busse1
1Diagnostic and Interventional Radiology, Leipzig University Hospital, Leipzig, Germany, 2Integrated Research and Treatment Center (IFB) AdiposityDiseases, Leipzig University Medical Center, Leipzig, Germany, 3Department of Visceral, Transplantation, Thoracic and Vascular Surgery, Division of Bariatric Surgery, Leipzig University Hospital, Leipzig, Germany
Synopsis
In obesity research and clinical practice, disease progress or response to therapy is typically evaluated by the reduction of body weight, adipose tissue (AT) volume or comorbidity remission rates. However, little is currently known about therapy-induced changes in subcutaneous and visceral AT composition and how to quantify them. Lean control subjects had recently been shown to have significantly higher T1 relaxation times in both SAT (301 ms) and VAT (360 ms) than severely obese patients (275 and 294 ms, respectively). Aims of this study were to characterize AT by quantitative MRI and evaluate the intra-individual changes at two time points.
Purpose
In obesity research and clinical practice, disease progress or response to therapy is typically evaluated by the reduction of body weight, adipose tissue (AT) volume or comorbidity remission rates. However, little is currently known about therapy-induced changes in adipose tissue composition–mainly subcutaneous and visceral AT (SAT, VAT)–and how to quantify them. A recent study has found that lean control subjects had significantly higher T1 relaxation times in both SAT (301 ms) and VAT (360 ms) than severely obese patients (275 and 294 ms, respectively) [1]. Aims of this study were to characterize adipose tissue by quantitative MRI and evaluate the intra-individual changes at two distinct time points.Materials and Methods
Sixteen patients (12 females, mean BMI 44.6±4.4 kg/m2) underwent IRB-approved MRI examination (1.5T Achieva XR, Philips, Best, Netherlands, Fig. 1). Total abdominal visceral AT volumes (VVAT-T) were measured from semi-automatically segmented VAT areas on about 40 MRI slices (thickness 10 mm) between diaphragm and pelvic floor. MRI parameters were assessed in two reference regions of interest for VAT (left infrarenal and retroperitoneal) and SAT (same axial level, left dorsolateral). Regional fat fractions (FFSAT, FFVAT) were then derived from numerical fits to 11-point Dixon-type water-fat MRI data. Corresponding T1 relaxation times (T1SAT, T1VAT) were estimated by numerical fits to inversion-recovery prepared fast spin echoes at six different inversion times (TI) using a previously described technique [1]. For illustration, Fig. 2 shows an axial image (at TI = 750 ms) of a morbidly obese patient. All resulting values were compared intra-individually at two time points–before and seven months after bariatric surgery.Results
An overview of the relative changes of BMI, VVAT-T, FFSAT and FFVAT (normalized to their respective values at month 0) is given in Fig. 3. Total VVAT-T and BMI differences (4.9 vs. 2.1 L and 44.6 vs. 33.7 kg/m2) were highly significant (both p<0.001). On the regional level, FFSAT and FFVAT also showed significant differences – 87.4 vs. 81.4% (p<0.001) and 87.6% vs. 82.1% (p<0.01). Figure 4 illustrates the changes in absolute T1 times. Average T1 relaxation times were significantly higher in both SAT (by 12.9% at 323 ms, p<0.01) and in VAT (by 9.1% at 323 ms, p<0.05) after weight loss.Discussion and Conclusion
Obese patients did not only show a significant reduction in BMI and total visceral fat volume but also characteristic changes in quantitative MRI parameters towards values for healthy lean subjects in both SAT and VAT. Therefore, MRI-derived fat fractions and T1 relaxation times may assist with in-vivo characterization of adipose tissue in obese patients.Acknowledgements
Grant support under BMBF 01EO1001 is greatly acknowledged.References
[1] Garnov N, Linder N, Schaudinn A, et al., Comparison of T1 relaxation times in adipose tissue of severely obese patients and healthy lean subjects measured by 1.5 T MRI. NMR Biomed. 2014;27(9):1123-1128.Figures
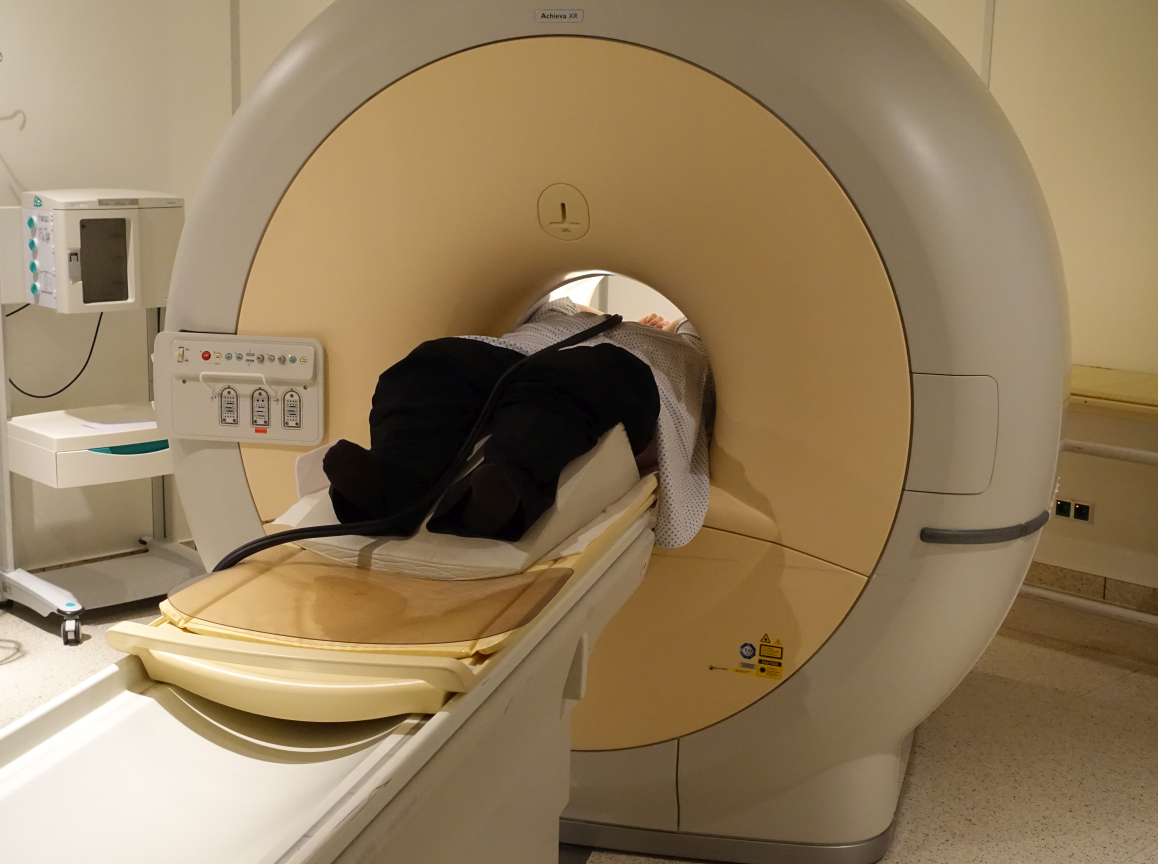
Figure 1. IRB-approved
1.5T MRI examination of obese patient in a standard 60-cm-bore system (Achieva
XR, Philips) using the integrated body coil as receive coil.
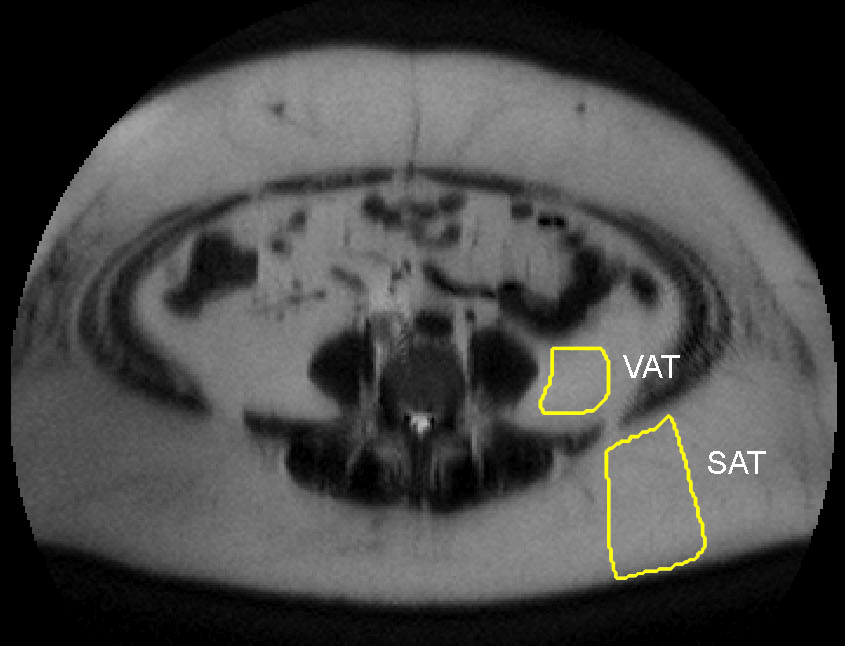
Figure 2. Pre-interventional MR image at TI = 750
ms of an obese, 39 year-old male (BMI = 51.8 kg/m2) with regions
of interest used for FF and T1 assessment in VAT and SAT.
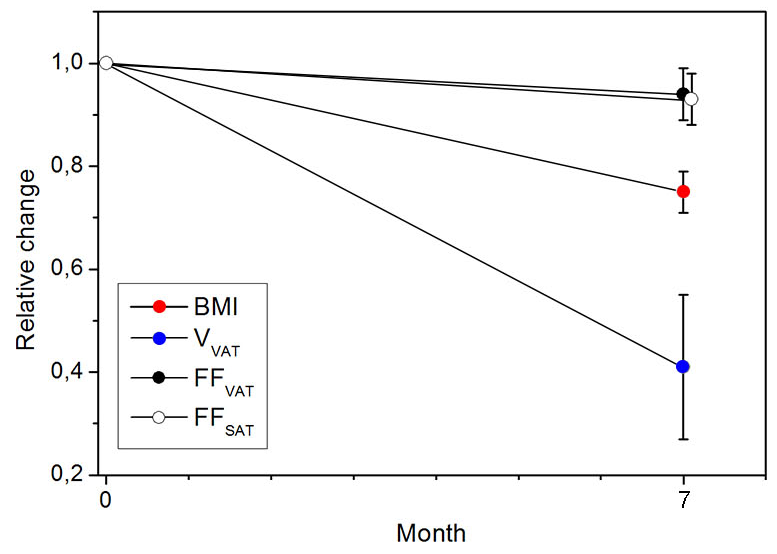
Figure 3. Relative
changes of BMI, total abdominal VAT volume (VVAT-T) and fat fraction
in VAT and SAT before (month 0, M0) and 7 months after (M7) obesity treatment.
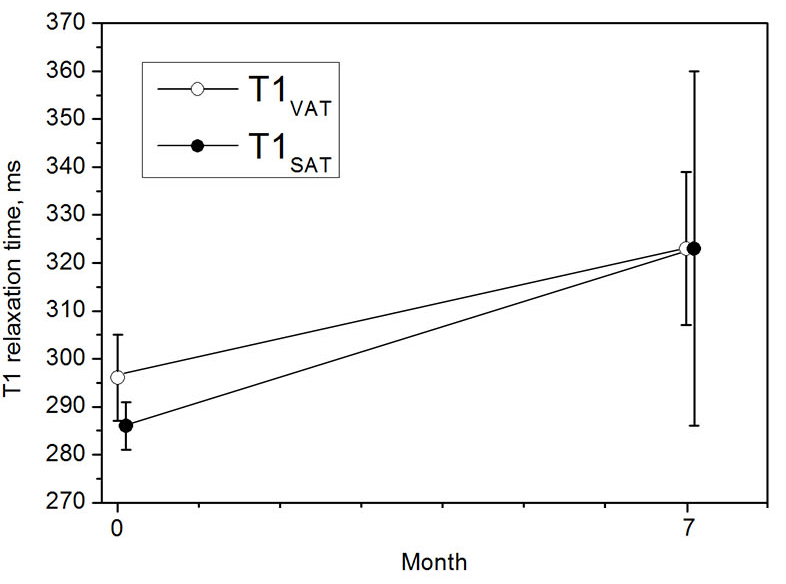
Figure 4. Absolute
T1 relaxation times at 1.5 T (in ms) in visceral (T1VAT) and
subcutaneous adipose tissue (T1SAT) at time points M0 and M7. Error
bars indicate standard deviations.