2056
Ethnic variation in body composition of men with type 2 diabetes from automated analysis of Dixon MRI1Guy's & St. Thomas NHS Foundation Trust, London, United Kingdom, 2Klarismo Ltd, 3Division of Imaging Sciences and Biomedical Engineering, King's College London, London, United Kingdom, 4Diabetes & Nutritional Sciences Division, King's College London, London, United Kingdom
Synopsis
This work explores the role of body composition and its relationship with the development of type 2 diabetes in White European and Black African men. An investigation of differences in body composition between these two groups was performed via automated image segmentation and analysis of Dixon MR images. Our initial results suggest visceral adipose tissue may not be a principal determinant in the development of type 2 diabetes in Black African men as it is with White European men.
PURPOSE
Excess body fat, particularly accumulation of visceral adipose tissue (VAT), has been implicated in the pathogenesis of type 2 diabetes (T2D) (1). Populations of Black African (BA) ethnicity are disproportionately affected by T2D (1) and there is evidence that its development is distinct from other ethnic groups. Despite high levels of obesity, pre-diabetic BA groups are seen to have lower waist circumferences than White Europeans (WE) (2). Imaging studies have demonstrated lower VAT accumulation, however these studies have been limited to analysis from a single slice of the abdomen (3). Dixon MRI is a technique that leverages the resonant frequency shift between in-vivo fat and water protons to create separate fat and water maps of the scanned subject. This allows one to directly measure in-vivo tissue volumes and fat fractions without the use of ionising radiation. The aim of our investigation was to compare whole body fat (%), VAT, subcutaneous adipose tissue (SAT), leg muscle (LM) and psoas muscle (PM) between BA and WE men with T2D, using whole-body Dixon magnetic resonance imaging (MRI).METHODS
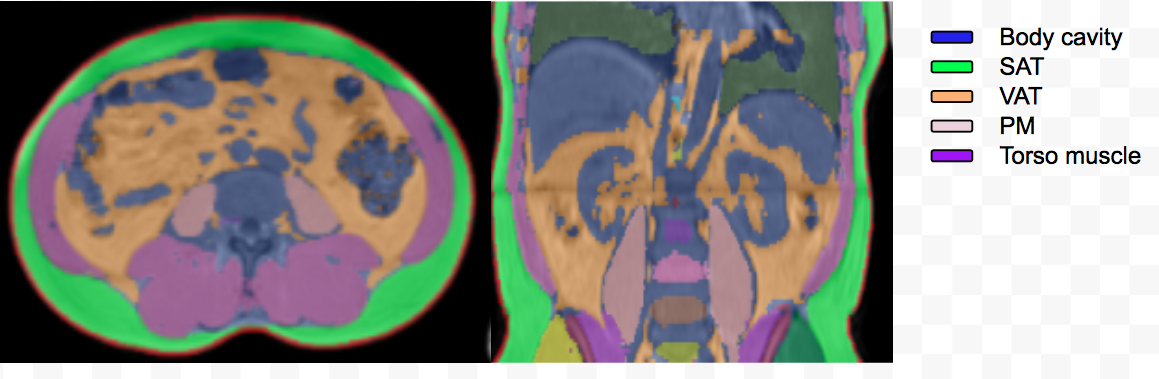
Men of BA and WE ethnicity, matched for age and body mass index (BMI), with recent-onset T2D were recruited. A 2-point Dixon MRI sequence (TE=2.39 & 4.77 ms; TR=6.77 ms; FoV=360x500 mm, 64x3 mm slices; matrix = 320x161 and FA=10º ) with 5 contiguous stations was acquired from each subject on a Siemens Aera 1.5 T MRI system. These data were processed via the Klarismo Image Analysis Pipeline (www.klarismo.com), a cloud-based software platform for the automatic segmentation and labelling of whole-body Dixon MRI, including anatomically-specific sub-compartments of adipose and muscle tissue. The cloud-based implementation of the Klarismo Image Analysis Pipeline allows hundreds or even thousands of scans to be processed simultaneously.Volumetric measurements were taken of total body fat, VAT, SAT, LM and the iliopsoas muscles (PM) from MRI data (Figure 1). Mean ± standard deviation were calculated for each ethnic group and compared using independent samples t-tests. Pearson correlation was used to determine the association between fat variables.RESULTS
Twenty-seven men (12 BA, 15 WE) participated. The mean duration of T2D diagnosis was 2.9 ± 1.1 years; age 55.3 ± 7.0 years; HbA1c 49.9 ± 7.8 mmol/mol; BMI 31.1 ± 4.2 kg/m2, which were not significantly different between the two ethnic groups (all p>0.05).
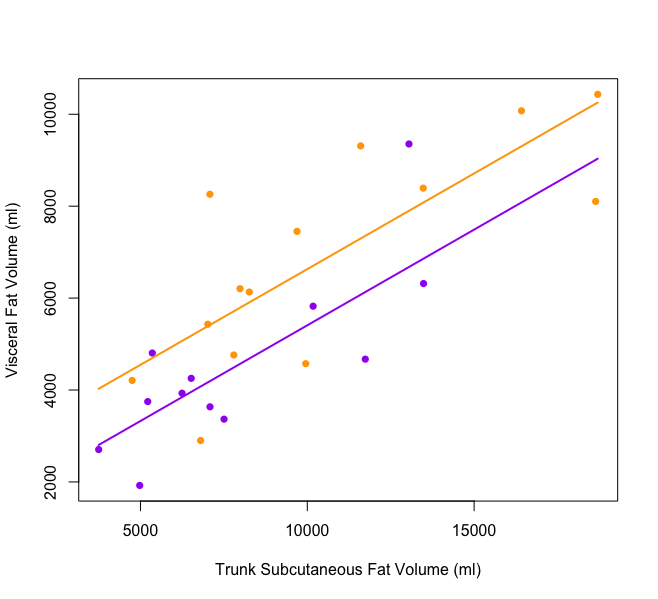
Total body fat was lower amongst BA men (WE 30.0 ± 5.9 vs BA 25.9 ± 5.9 %), although this did not reach statistical significance (p=0.08). Ethnic differences in body fat were driven by significantly lower VAT in BA (WE 7286.9 ± 2757.4 vs BA 4544.1 ± 1943.6 ml, p=0.007) whilst there were no significant differences in SAT between the groups (WE 15065.6 ± 5975.7 vs BA 11943.5 ± 5682.4 ml, p=0.18). In both ethnic groups there were significant associations between SAT and VAT (WE r=0.565, p=0.03; BA r=0.798, p=0.001) (Figure 2). There were ethnic differences in muscle mass, LM mass was significantly higher amongst BA men (WE 9250.8 ± 1427.8 vs BA 10492.9 ± 1765.1 ml, p=0.05) however PM mass did not differ between the groups (WE 669.5 ± 116.1 vs BA 609.9 ± 127.5, p=0.22).
DISCUSSION
Visceral fat accumulation is a principal determinant of insulin resistance and the development of T2D. However, in BA men with T2D, VAT accumulation is significantly lower and subcutaneous adiposity is not different to that of WE men. Alongside ethnic differences in body fat deposition, leg muscle mass was significantly higher amongst BA men, however there were no differences found in psoas muscle mass.CONCLUSIONS
This study demonstrates the utility of automated segmentation of Dixon MRI for rapid analysis of whole body composition. Result from this study support evidence of distinctions in the mechanisms by which T2D develops in BA populations, and suggest that, unlike in WE groups, VAT accumulation may not be a principal determinant of T2D in BA populations.Acknowledgements
No acknowledgement found.References
(1) International Diabetes Federation. Diabetes Atlas, 7th Edition. http://www.diabetesatlas.org/resources/2015-atlas.html
(2) Staiano AE, Katzmarzyk PT. Ethnic and sex differences in body fat and visceral and subcutaneous adiposity in children and adolescents. Int J Obes 2012;36(10):1261-9.
(3) Maligie M, Crume T, Scherzinger A, Stamm E, Dabelea D. Adiposity, fat patterning, and the metabolic syndrome among diverse youth: the EPOCH study. J Pediatr 2012;161(5):875-80.
Figures