2055
Changes in fat distribution and composition during ketogenic diet investigated by MRI and MRS.Martin Buechert1, Thomas Lange1, Peter Deibert2, and Paul Urbain3
1Medical Physics, Department of Radiology, Medical Center – University of Freiburg, Freiburg, Germany, 2Medical Center – University of Freiburg, Freiburg, Germany, 3Department of Medicine I, Section of Clinical Nutrition and Dietetics, Medical Center – University of Freiburg, Freiburg, Germany
Synopsis
Changes in fat distribution and composition during ketonic diet were investigated in a sub group of twelve volunteers of a larger study. Liver fat concentrations in the examined cohort turned out to be surprisingly low compared to patient cohorts with similar BMI measured in other studies. The hypotheses that intra-hepatic fat may be reduced during a ketogenic diet could not be confirmed. However the composition of the sub group may have biased the outcome. While the MRI protocol and analysis worked well, MRS analysis of data acquired with the given protocol in subjects with low hepatic fat reaches its limitations.
PURPOSE
The ketogenic diet (KD) is a very low-carbohydrate, high-fat and adequate-protein diet with no calorie limit that will change the metabolism of the body towards a higher level of basal fat burning. Its therapeutic use in a range of diseases is under investigation. For better planning of such therapies it’s of clinical interest to know which part of the body fat will be reduced during therapy. The hypothesis is that intra-hepatic fat may be reduced during a ketogenic diet via a mechanism described by others [1] [2]. The KetoPerformance study investigated in healthy adults the impact of a 6-week KD without caloric restriction on physical performance. In the present feasibility study, a subgroup of subjects underwent a combined MRI/MRS approach to investigate if and to which extent changes in fat distribution and fat composition during a ketogenic diet could be measured with clinical MRI and MRS protocols.METHODS
Twelve of the 42 subjects from the KetoPerformance study could be recruited for the present MR substudy. All experiments were performed on 3T MR systems (Trio, Siemens Healthcare, Germany). The subjects underwent the following MR protocol prior the ketogenic diet and 6 weeks later a follow up examination with the same protocol. A Dixon-based sequence covering the abdomen at least between the top of the femoral heads and the liver apex were used for Fat/Water imaging. Under free breathing and prospective acquisition correction (PACE) based on navigator triggering, liver MR-spectroscopy was performed using single voxel PRESS. The measurement voxel (3 x 3 x 3 cm3) was positioned in the lateral part of the liver, avoiding contamination from larger blood vessels. Using this setup, non-water-suppressed as well as water-suppressed MRS data with 64 spectral averages were acquired using an echo time TE = 35 ms and a minimal TR = 1 s. Fat and water images were reconstructed from the acquired multi-TE gradient echo data, using the graph cuts algorithm [3] and intra-abdominal and subcutaneous fat volumes were determined. The liver spectra were fitted and quantified with LCModel, using a dedicated analysis protocol for lipid detection in the liver. The lipid signal was modeled with peaks at [0.9, 1.3, 1.6, 2.1, 2.3, 2.8, 4.1, 4.3, 5.2, 5.3] ppm by LCModel. Figure 1 gives an overview of the measurement locations within the abdomen. Quantification results determined with Cramer-Rao lower bounds larger than 20% were rejected for further analysis. Statistical analysis for all data was carried out using SPSS.RESULTS
Twelve subjects in the age range 31-56 (mean 44.8+/-9.1) and BMI range 23-29 (mean 25.8+/-1.8) successfully finished baseline and follow-up MR examinations. Abdominal fat/water analysis of both MRI examinations were successfully done. No significant differences were found in the primary fat/water parameters ([total, subcutaneous and internal] fat and water volumes) or in any derived measure like ratios of single component volumes to total volumes. LCModel analysis could also be performed for all data sets. However, spectral quality only allowed valid determination of (L16+L09+L13)/water for all spectra. The ratios L43/water, L41/water (L16+L13)/(L16+L09+L13), (L28+L23+L21)/(L16+L09+L13), L13/(L16+L09+L13), L09/(L16+L09+L13), L21/(L16+L09+L13), Cho/(L16+L09+L13) and Glycg/(L16+L09+L13) could not be determined with sufficient accuracy (CRLBs < 20 %) in one or several subjects. Consequently, measures derived from these ratios such as saturated lipid component, fraction of unsaturated lipids and mean chain length could not be determined, either. Furthermore, peak ratios including L23, L28, (L53+L52), L43 or L41 to (L16+L09+L13) could not be quantified in a sufficient number of subjects for a valid group comparison baseline vs. follow-up examination. However, none of the MRS parameters showed a significant difference between baseline and follow-up examination. Figure 2 shows exemplary results for L21/(L16+L09+L13).DISCUSSION
While an abdominal fat/water analysis could be performed in all acquired Dixon data sets, in this particular volunteer group the used MRS protocol only partly delivered valid information about the fat composition in the liver. The expected change in hepatic fat could not be observed. Spectral quality may be improved by increasing the number of acquired averages, albeit at the expense of considerably longer scan times. Liver fat concentrations in the examined cohort turned out to be surprisingly low compared to patient cohorts with similar BMI measured in other studies [4]. We hypothesize that the considerable expenditure of time for the participating subjects lead to a selection bias towards slightly overweight but very health-conscious and thus healthy individuals who only displayed mild hepatic fatty infiltration. Future studies should consider this aspect even though that will complicate volunteer recruitment.Acknowledgements
We thank Prof. Hartmut Bertz the principal investigator of the KetoPerformance study who agreed on the MR investigation of this subgroup out of the main study.References
1. Pilkis SJ et al., Annu Rev Physiol. 1992;54:885. 2. Fukao T et al., Prostaglandins Leukot Essent Fatty Acids. 2004;70:243. 3. Hernando D et al., Magn Reson Med 2010;63:79. 4. König D et al., Nutrients 2015 7/12 9825.Figures
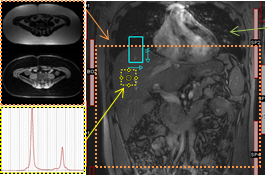
Scout image
(center) with inscribed location of Dixon fat/water MRI (orange) and liver MR
spectroscopy (yellow).
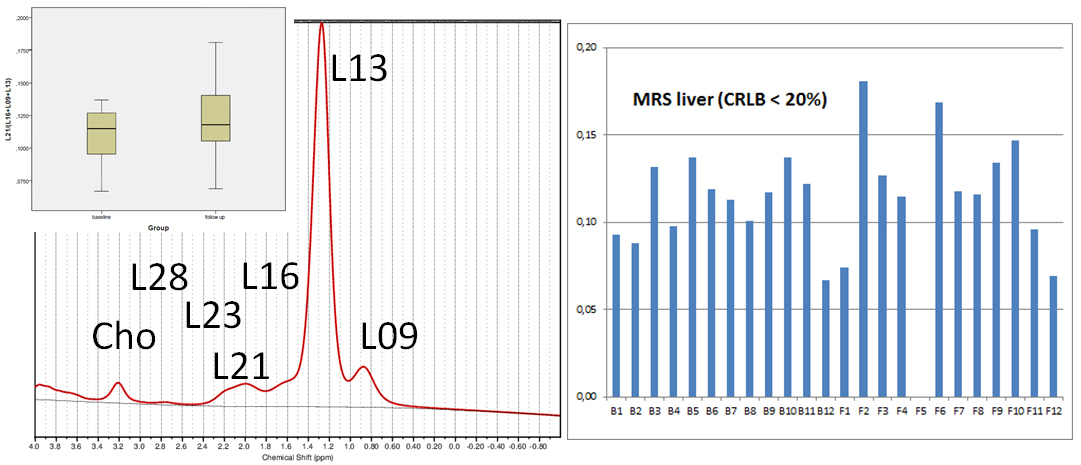
Example liver spectra with main peaks: a methylene (CH2)
peak at 1.3 ppm, a methyl (CH3) peak at 0.9 ppm, an α-olefinic and α-carboxyl
peak at 2.1 ppm, a diacyl peak at 2.8 ppm and a choline peak at 3.2 ppm. The insert shows the derived mean L21/(L16+L09+L13) values for baseline and follow up measurements while on
the right the individual values are displayed.