2052
Resistance and susceptibility to diabetes - characterising the ‘Thin on the Outside Fat on the Inside’ (TOFI) profile using magnetic resonance imaging: a pilot study in Asian and Caucasian women1Human Nutrition Unit, School of Biological Sciences, University of Auckland, Auckland, New Zealand, 2Faculty of Health and Environmental Sciences, Auckland University of Technology, Auckland, New Zealand
Synopsis
Prediction of risk for dysglycaemia and adverse metabolic health is difficult, with some outwardly lean individuals having greater susceptibility to type 2 diabetes (T2D) than obese resilient individuals. Using 3T MR Imaging and spectroscopy we showed, in 10 Asian Chinese and 6 European Caucasian healthy or prediabetic women (18 – 70 years and BMI 25 – 50 kg/m2), that greater storage of fat within riskier ectopic sites, i.e. pancreas and liver, may in part explain the reported increased risk of T2D in Asian Chinese populations compared to their Caucasian counterparts at the same BMI and younger age.
Background:
The New Zealand National Science Challenge High Value Nutrition (NSC-HVN) program addresses the biggest science-based challenges within the country as identified by government, researchers and the general public, intended to have a national and global footprint. Obesity and associated metabolic risk including type 2 diabetes (T2D) is increasing globally, with the most rapid rise in Asia, including China1. Prediction of risk is difficult, with some outwardly lean individuals having greater susceptibility to T2D than obese resilient individuals. This may be due to lipid ‘overspill’ from safe peripheral subcutaneous stores into risky ectopic sites such as pancreas and liver2. The thin on the outside fat on the inside ‘TOFI’ profile may partly explain why Asian Chinese populations are reported to be at greater risk of poor metabolic health than Caucasian counterparts at the same body mass index (BMI) and younger age3. We hypothesise that for TOFI individuals, greater pancreatic and liver fat may worsen glycaemia compared to age, gender and BMI matched individuals. The NSC-HVN metabolic program, Peak Nutrition for Metabolic Health (PANaMAH), is investigating the metabolic profile that characterises and predicts susceptibility and resilience to T2D, in Chinese and Caucasian cohorts, with and without the TOFI profile.Method:
A pilot study was conducted in 10 Asian Chinese and 6 European Caucasian healthy or prediabetic women, 18 – 70 years and BMI 25 – 50 kg/m2. Participants had no significant disease, i.e. diabetes, no prior bariatric surgery and no recent body weight loss/gain in prior 3 months. Anthropometry (height, weight, waist, hip circumference, blood pressure) and indices of glycaemia (fasting plasma glucose, FPG; glycated haemoglobin, HbA1c) were measured. Visceral, subcutaneous, pancreatic and liver fat was assessed using a 3 Tesla Siemens MRI system (Erlangen, Germany).
A sagittal localizing image was acquired from 5.0 mm thick sections from diaphragm to pelvis. The field of view ranged from 50-80 cm, dependent on body thickness. Phase encoding was in the anteroposterior direction minimising effects of motion-induced phase artefacts and signal averaging (four) applied reducing the effect of motion-related artefacts. Respiratory gating reduced motion induced artefacts and blurring of fat boundaries in the anterior region of the abdomen. 3D dual gradient-echo sequence acquired water/fat images in one acquisition using 2-point Dixon technique. Images were acquired using T1-weighted spin echo pulse sequence with TR of 6.5 msec and TE out of phase/in phase, 2.4/4.8 msec, flip angle 12 degrees, matrix 256 x 128, and 0.7 number of excitations. Scan time for abdominal fat assessment in each patient was less than 60 seconds apart from scout imaging and section planning. Following whole abdomen scan, the pancreas was located. Using similar 2-point Dixon protocol, with ~10-15 seconds breath holds, a number of 3.0 mm slides with signal average of 16 was acquired. Subcutaneous abdominal, visceral and pancreatic fat was distinguished through image processing in ImageJ4, and the volumes of these compartments calculated.
MR proton spectroscopy was performed to determine liver fat content. A voxel of the size of 2x2x2 cm3 was selected within the right lobe of the liver using images acquired from the abdominal scan. MRS of the selected voxel was performed and spectrum recorded using the stimulated-echo acquisition mode sequence, with an echo time of 20 msec, a TR of 3000 msec and mixing time of 33 msec, 1024 data points over 1200 kHz spectral width with 50 averages. Water-suppressed spectrum with 50 averages was recorded to detect weak lipid signals. Area under the curve (AUC) of the water and the fat peak was calculated from non-water-suppressed and water-suppressed spectra, respectively, in Sivic5. Liver fat was presented as percentage volume/volume.
Results:
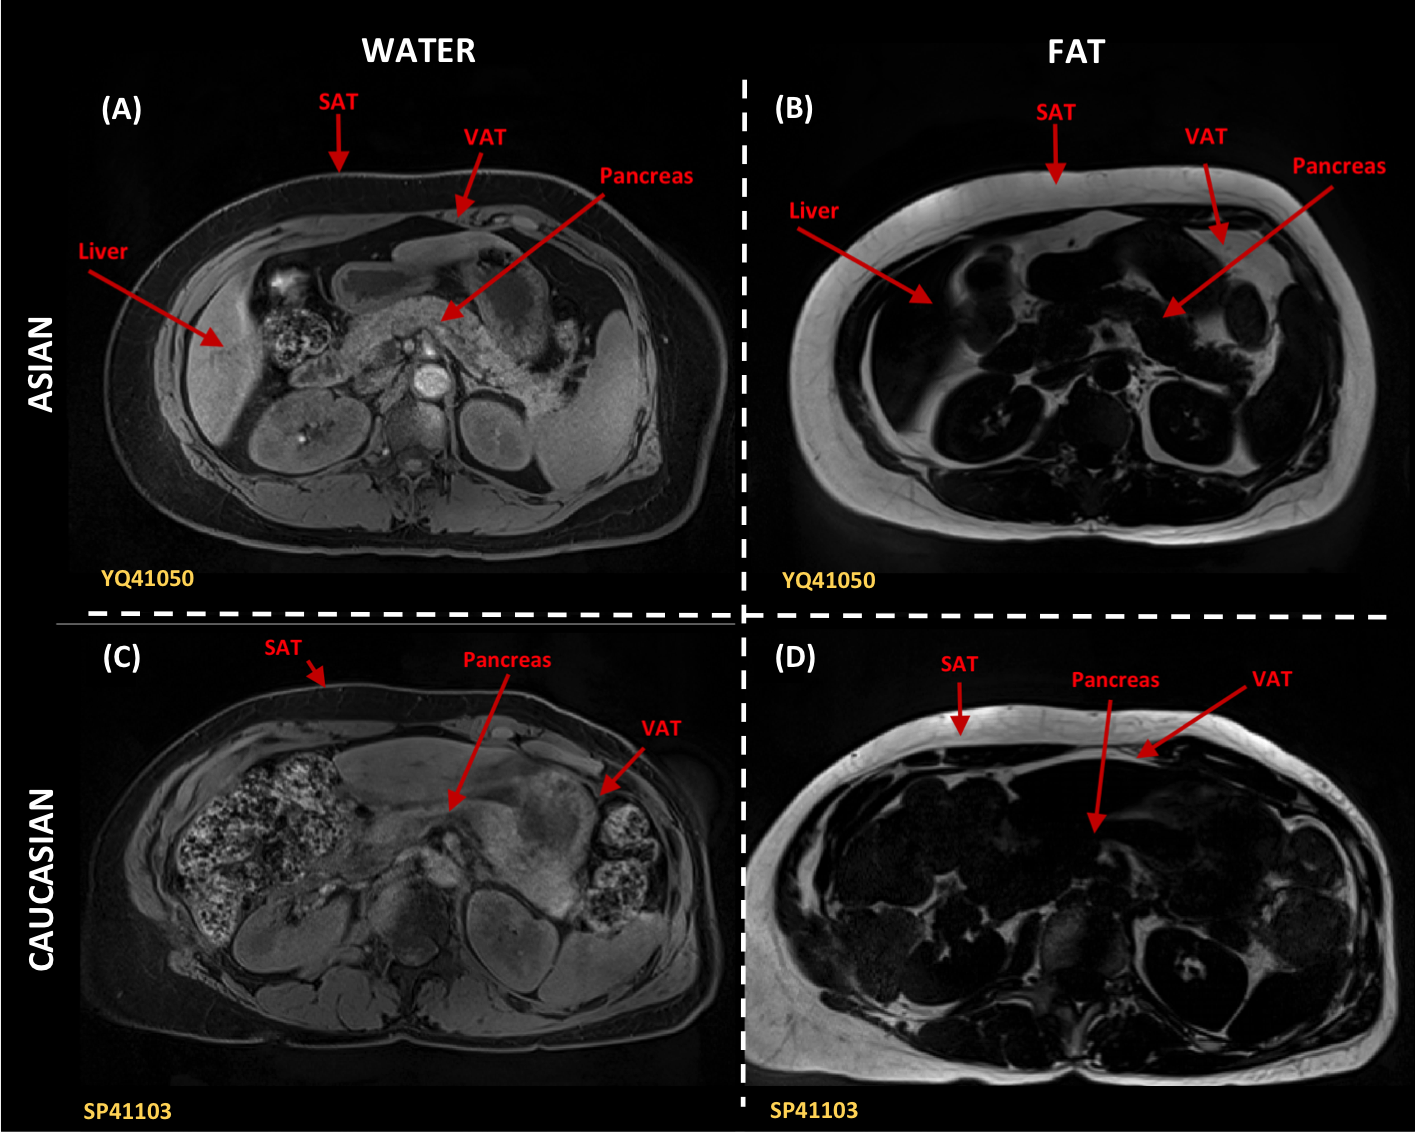
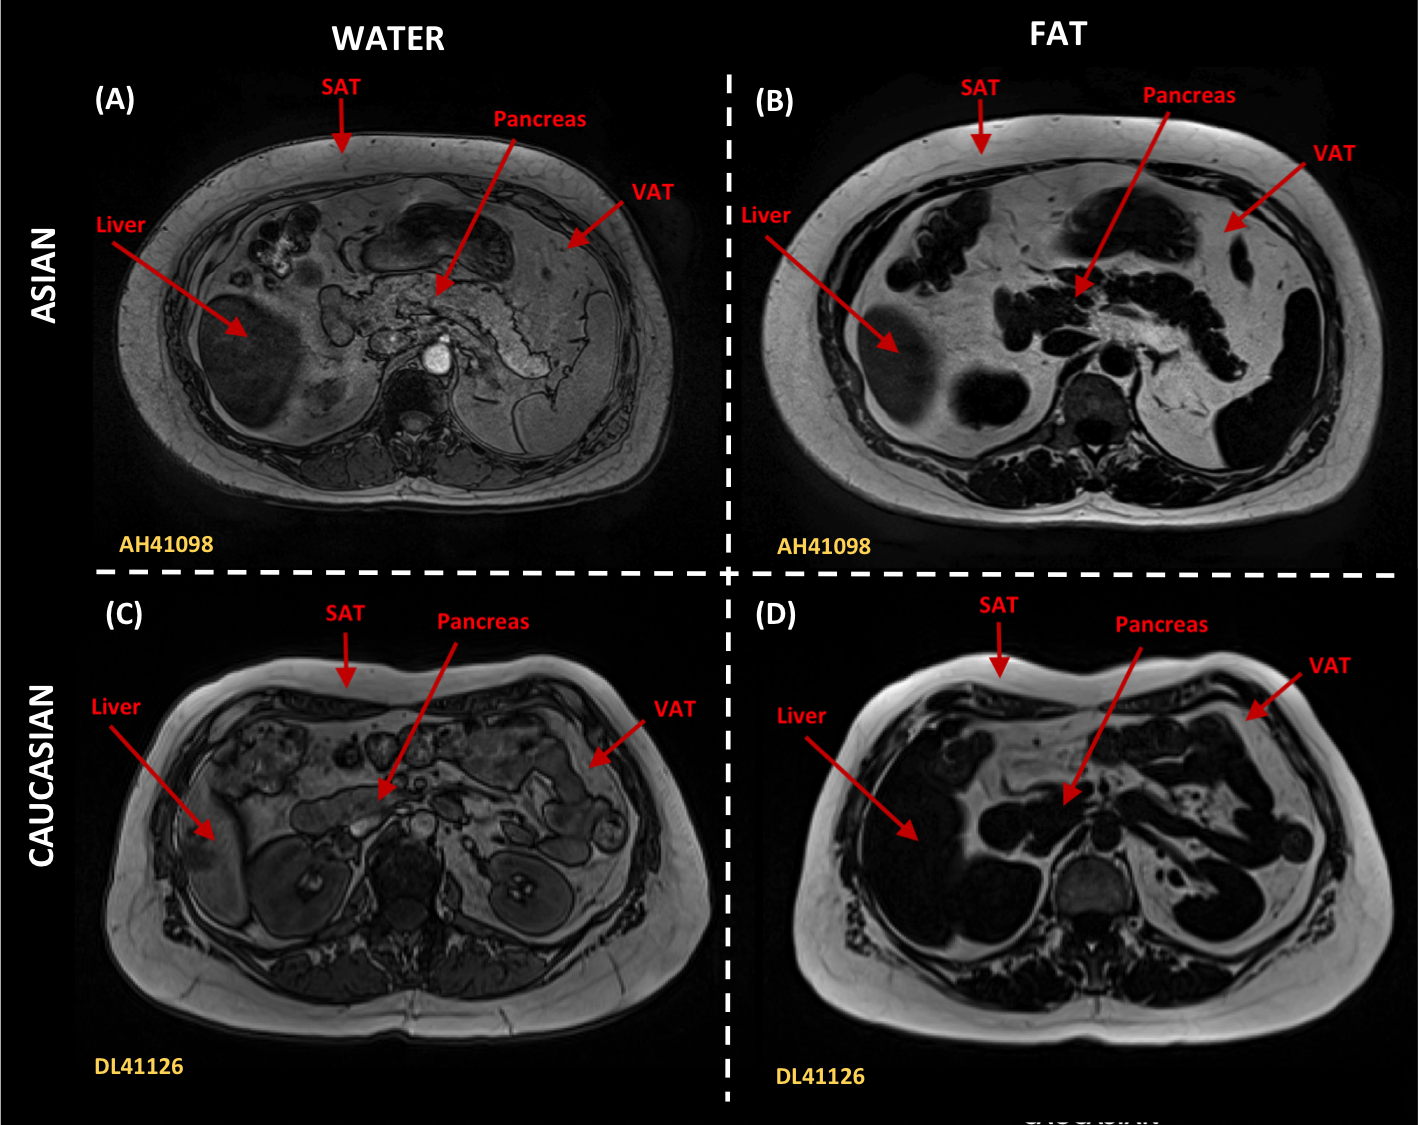
Asian Chinese women were younger (37.6 ± 8.5 yrs) than their Caucasian counterparts (61.0 ± 3.7 yrs) with both groups matched for BMI (Asian: 30.7 ± 3.9 kg/m2; Caucasian: 29.5 ± 4.4 kg/m2) and HbA1c (Asian: 36.1 ± 3.2 mmol/mol; Caucasian: 36.2 ± 2.6 mmol/mol), but the former having higher fasting plasma glucose levels (Asian: 5.6 ± 0.5 mmol/L; Caucasian: 5.2 ± 0.3 mmol/L). MRI/MRS showed that for similar BMI, young women of Asian descent had greater subcutaneous, visceral, pancreatic and hepatic adiposity than their older Caucasian counterparts (Figure 1 & 2), indicative that BMI is a poor predictor of adipose tissue content and FPG.Conclusion:
Susceptibility or resilience to dysglycaemia varies amongst ethnicities, and may be underpinned by site of lipid deposition. Lipid overspill into ‘risky’ ectopic sites may trigger dysglycaemia and early disease onset in TOFI individuals within Asian populations, with an increased risk of T2D at a lower BMI and age than their Caucasian counterparts.Acknowledgements
PANaMAH is funded by MBIE via the National Science ChallengeReferences
1. NCD Risk Factor Collaboration. Trends in adult body-mass index in 200 countries from 1975 to 2014: a pooled analysis of 1698 population-based measurement studies with 19·2 million participants. The Lancet 2016;387:1377-1396.
2. Saponaro C, Gaggini M, Carli F, et al. The subtle balance between lipolysis and lipogenesis: a critical point in metabolic homeostasis. Nutrients 2015;7:9453-9474.
3. Haldar S, Chia SC, Henry CJ. Body composition in Asians and Caucasians: comparative analyses and influences on cardiometabolic outcomes. Advances in Food and Nutrition Research 2015;75:97-154.
4. Abràmoff MD, Magalhães PJ, Ram SJ. Image processing with ImageJ. Biophotonics International 2004, 11(7):36-42.
5. Crane JC, Olson MP, Nelson SJ. SIVIC: open-source, standards-based software for DICOM MR spectroscopy workflows. Journal of Biomedical Imaging 2013, 2013:169256
Figures