2049
High-resolution 3D lung 1H-MRI in rodents at 9.4T with an optimized multi-echo gradient echo sequence1Buffalo Neuroimaging Analysis Center, Department of Neurology, Jacobs School of Medicine and Biomedical Sciences, University at Buffalo, The State University of New York, Buffalo, NY, United States, 2MRI Clinical and Translational Research Center, Jacobs School of Medicine and Biomedical Sciences, University at Buffalo, The State University of New York, Buffalo, NY, United States
Synopsis
Preclinical MR lung imaging has been challenging due to lower tissue density compared to other organs. Current practice has been 2D spin-echo or gradient echo with relatively lower resolution. In this work we present an optimized high resolution 3D Multi Gradient Echo and demonstrate the results by comparing it with state of the art 2D Gradient echo.
Purpose:
Lung cancer is one of the major causes of death in the U.S, despite significant advances in cancer treatments and drugs1,2. Several preclinical models have been developed to reproduce the human pathology and explore biological markers and treatments. Preclinical MR imaging of tumors and metastases in lung parenchyma, allows us to monitor the disease progression noninvasively and repetitively. However, imaging of lung tissue with MRI is extremely challenging because lungs have lower tissue density compared to other organs and the air-tissue interfaces are a source of susceptibility artifacts and spin dephasing with most conventional pulse sequences. The current state-of-the-art for preclinical lung MRI is the use of 2D short-echo gradient-echo (GRE) or spin-echo pulse sequences with limited in-plane resolution and relatively high slice thickness3-12. In this work, we present an optimized, high-resolution 3D gradient echo sequence with special post-processing and compare it with conventional 2D lung MRI.Method:
Experiment: The experiment objective was to optimize 3D MGRE sequence for higher resolution and compare the data quality of optimized sequence with state of the art 2D spin-echo sequence.
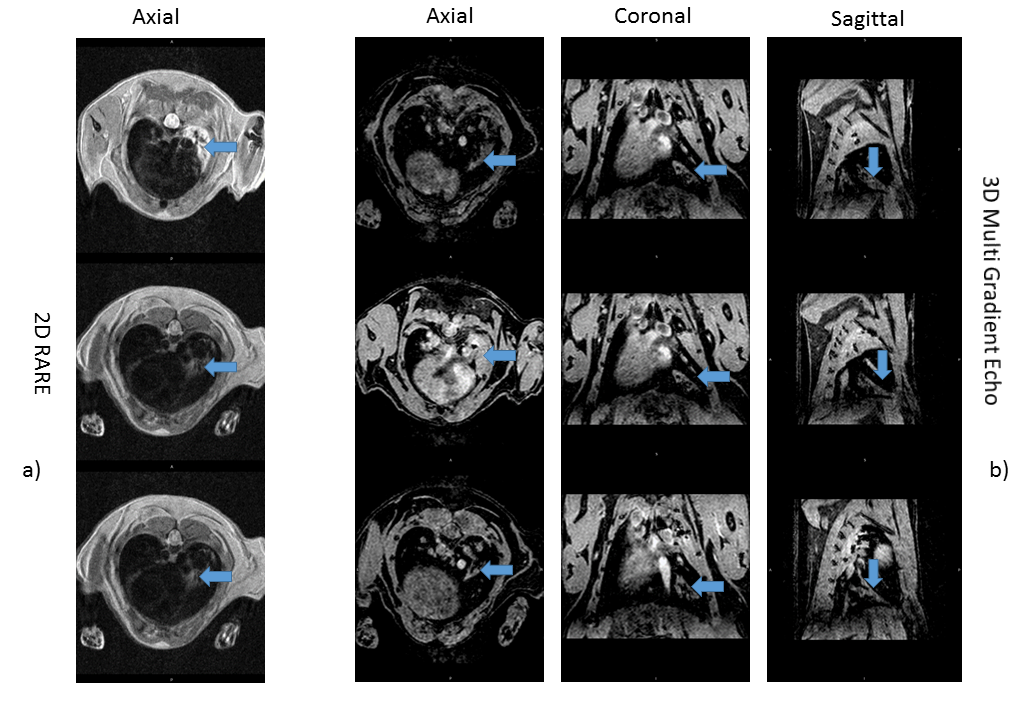
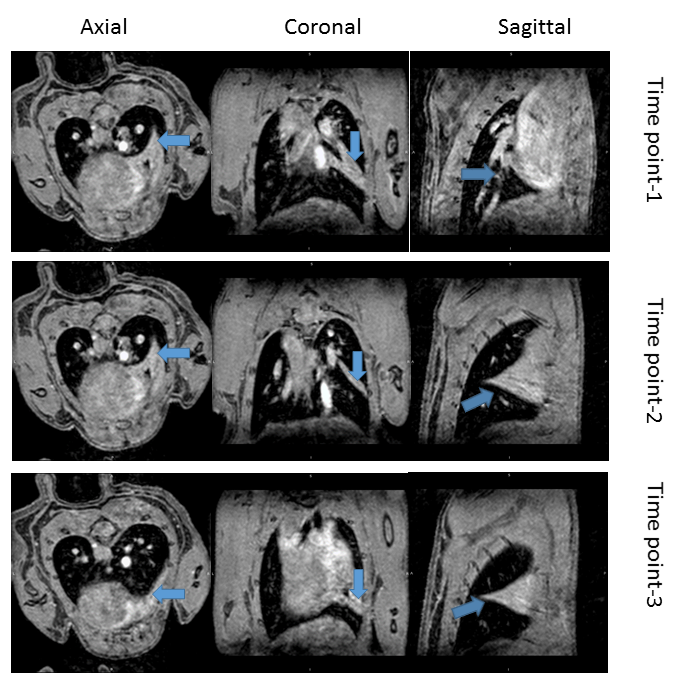
Animals and data acquisition: IACUC-approved experiments were performed in two C57BI/6J mice at a horizontal-bore small-animal 9.4T MRI (Biospec 94/20, Bruker Biospin, Germany) with a 40mm Tx/Rx volume coil. First, we optimized 3D multi-echo gradient echo (MGRE) sequence with respect to a minimized first echo time by reducing the RF pulse length to 72µs and a high readout bandwidth (150kHz). Other parameters were TR/TE1/TE2/TE3=50/1.22/2.86/4.50ms, Navg=1, FA=18˚, matrix=120x133x100, and FOV=24x20x15mm3, resulting in an almost isotropic nominal resolution of 200x150x150µm3 and for comparison, we applied a state-of-the-art 2D axial RARE protocol17: TR/TE=3000/24.51ms, RARE factor=8, Navg=3, BW=75kHz, matrix=214x197, FOV=25x23mm2 (117x117µm2), 25 slices with 500µm thickness, in one Isoflurane-anesthetized mice. To measure the quality of the acquired 3D images longitudinally, we also serially applied (3 times within 6 days) the MGE sequence in one Isoflurane-anesthetized mouse, positioned in the supine position to increase the likelihood of collapsed middle lobe in the right lung. Both sequences acquired with respiratory gating and fat suppression, resulting in average scan times of 22 min for the 3D and 16 min for the 2D sequence.
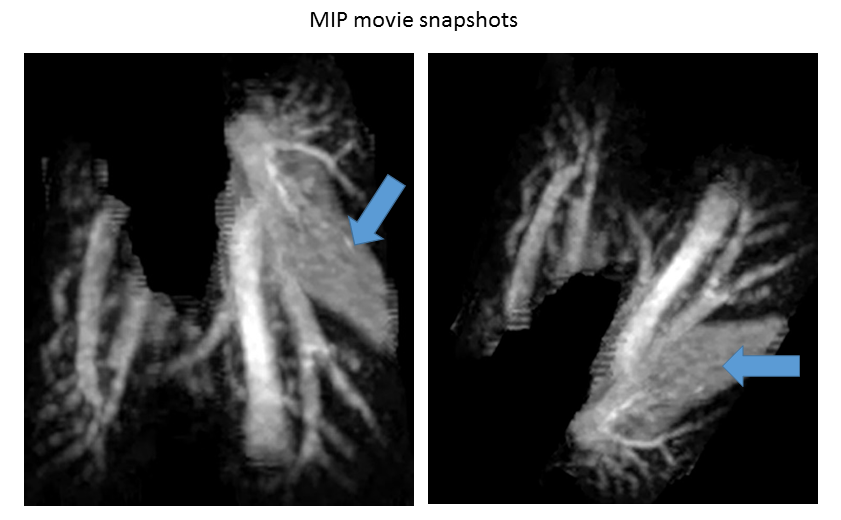
Post processing: After MRI, images were twice up-sampled by k-space zero-filling. Exploiting the almost isotropic voxel size and the 3D nature of the MGRE sequence, we computed movies of maximum intensity projections (MIP) of the image intensities inside the lung along with a trajectory of spatial directions. This was achieved using lung masks generated with 3DSlicer20. For serial scans, we non-linearly registered18 the individual scans prior to the MIP calculation to improve the depiction of differences between the scans. All processing was performed with custom programs in Matlab (The MathWorks, Natick, MA).
Results:
A hyper-intensive region (Fig.1-a; blue arrow) was visible in the right lung during the visual inspection of lung tissue in 2D sequence images. We could clearly identify collapsed lobe from the different slices from 3D MGRE scan (Fig1-b; blue arrow). The serial scan with 3D sequence also revealed the collapse of the middle lobe (Fig.3, blue arrow). Moreover, the MIP movies snapshot (Fig.2) taken from movies (not shown) provided a clear 3D visualization of the lung anatomy between time points (not shown).Discussion:
The 3D visualization enabled by the 3D MGE pulse sequence allowed the unambiguous identification of signal hyperintensity in the lung as a collapsed lobe, avoiding confusion with tumorous tissue in research studies. The collapsed lobe may occur due to sporadically, due to inefficient berating while spontaneous anesthesia. Which deflates the lung and collapses it. This outcome may remain undetected in 2D acquired images. Moreover, registering longitudinal studies, we could correlate tumor staging and growth progression volume by voxel-wise comparison than delineating tumors for staging in highly anisotropic 2D images separately.Conclusion:
Lack of knowledge about lung anatomy could produce incorrect quantitative and qualitative assessment of tumor growth or vasculature of lung parenchyma. 3D visualization robustly identifies tumor growth and functional changes. Our optimized 3D MGE sequence showed the desired result with clarity compared to state of the art 2D spin-echo sequence.Acknowledgements
Research reported in this publication was funded by the National Institute of Neurological Disorders & Stroke under Award Number R01NS094444. The content is solely the responsibility of the authors and does not necessarily represent the official views of the NIH.References
1. Siegel, Rebecca L., Kimberly D. Miller, and Ahmedin Jemal. "Cancer statistics, 2015." CA: a cancer journal for clinicians 65.1 (2015): 5-29.
2. Torre, Lindsey A., et al. "Global cancer statistics, 2012." CA: a cancer journal for clinicians 65.2 (2015): 87-108.
3. Kennel, Stephen J., et al. "High-resolution computed tomography and MRI for monitoring lung tumor growth in mice undergoing radioimmunotherapy: correlation with histology." Medical physics 27.5 (2000): 1101-1107.
4. Beckmann N, Cannet C, Karmouty-Quintana H, Tigani B, Zurbruegg S, Blé FX, Crémillieux Y, Trifilieff A. Lung MRI for experimental drug research. Eur J Radiol 2007; 64: 381–396.
5. Beckmann N, Tigani B, Ekatodramis D, Borer R, Mazzoni L, Fozard JR. Pulmonary edema induced by allergen challenge in the rat: noninvasive assessment by magnetic resonance imaging. Magn Reson Med 2001; 45: 88–95.
6. Karmouty-Quintana H, Cannet C, Sugar R, Fozard JR, Page CP & Beckmann N. Capsaicin-induced mucus secretion in rat airways assessed in vivo and non-invasively by magnetic resonance imaging. Br J Pharmacol 2007; 150: 1022–1030.
7. Karmouty-Quintana H, Cannet C, Zurbruegg S, Blé FX, Fozard JR, Page CP, Beckmann N. Proton MRI as a noninvasive tool to assess elastase-induced lung damage in spontaneously breathing rats. Magn Reson Med 2006; 56: 1242–1250.
8. Branca, Rosa T., et al. "Molecular MRI for sensitive and specific detection of lung metastases." Proceedings of the National Academy of Sciences 107.8 (2010): 3693-3697.
9. Dugas, Joseph P., et al. "Hyperpolarized 3He MRI of mouse lung." Magnetic resonance in medicine 52.6 (2004): 1310-1317.
10. Möller, Harald E., et al. "MRI of the lungs using hyperpolarized noble gases." Magnetic Resonance in Medicine 47.6 (2002): 1029-1051.
11. Schuster, Daniel P., et al. "Recent advances in imaging the lungs of intact small animals." American journal of respiratory cell and molecular biology 30.2 (2004): 129-138.
12. Krupnick, Alexander Sasha, et al. "Quantitative monitoring of mouse lung tumors by magnetic resonance imaging." nature protocols 7.1 (2012): 128-142.
13. Avants, Brian B., Nick Tustison, and Gang Song. "Advanced normalization tools (ANTS)." Insight J 2 (2009): 1-35.
14. MATLAB R2013b (8.2.0.701). Natick, Massachusetts: The MathWorks Inc., 2013.
15. Fedorov A., Beichel R., Kalpathy-Cramer J., Finet J., Fillion-Robin J-C., Pujol S., Bauer C., Jennings D., Fennessy F., Sonka M., Buatti J., Aylward S.R., Miller J.V., Pieper S., Kikinis R. 3D Slicer as an Image Computing Platform for the Quantitative Imaging Network. Magn Reson Imaging. 2012 Nov; 30(9):1323-41. PMID: 22770690.
Figures