2044
Magnetic resonance elastography for uterine fibroidsYoshie Omiya1, Shintaro Ichikawa1, Utaroh Motosugi1, and Hiroshi Onishi1
1University of Yamanashi, Chuo, Japan
Synopsis
We evaluated the feasibility of magnetic resonance elastography (MRE) for uterine fibroids and the effect of imaging sequences (i.e., spin-echo echo-planar imaging [SE-EPI] and gradient-echo [GRE]) on stiffness measurements. All MRE were performed in two cross-sectional planes (i.e., axial and sagittal). SE-EPI-MRE showed lower fibroid stiffness values than GRE-MRE. Each MRE method is a valid and reliable technique for measuring the stiffness of uterine fibroids.
Background and Purpose
Magnetic resonance elastography (MRE) is a new technique for assessing tissue stiffness. MRE has been established as a noninvasive diagnostic tool for the assessment of hepatic fibrosis, and applied for other organs. However, there are only a few reports of MRE for uterine fibroids (1). The purpose of this study is to evaluate the feasibility of MRE for uterine fibroids and the effect of imaging sequences (i.e., spin-echo echo-planar imaging [SE-EPI] and gradient-echo [GRE]) on stiffness measurements.Methods
This retrospective study was approved by the institutional review board; the requirement for informed patient consent was waived. Twenty-two patients (mean age, 45.4 years (38-52 years)) with 23 fibroids were enrolled. The mean size of the fibroids was 90.1 ± 23.1 mm. Location of the fibroids was intramural (n = 19), submucosal (n = 3), or subserosal (n = 1). All patients underwent MRE examinations with a 1.5-T MR system via two methods (SE-EPI and GRE) using a pneumatic vibrator which was placed on the lower abdominal wall and fixed with an elastic band. All MRE were performed in two cross-sectional planes (i.e., axial and sagittal). A two-dimensional postprocessing method was used for GRE-MRE, while a three-dimensional postprocessing method was used for SE-EPI-MRE. Table 1 summarizes the MR sequence parameters. Two radiologists measured the stiffness of fibroids. We manually placed as large a region of interest as possible to exclude crosshatching of areas inadequate for measurement on the stiffness map. Central slices were selected for SE-EPI-MRE. Interobserver agreement was assessed by intraclass correlation coefficients (ICC).Results
The mean stiffness values of the fibroids were as follows: GREaxial, 4.43 ± 1.48 kPa; GREsagittal, 4.32 ± 1.78 kPa; SE-EPIaxial, 5.44 ± 2.10 kPa; and SE-EPIsagittal, 5.58 ± 2.33 kPa (Figure 1). The mean stiffness values of the fibroids measured by SE-EPIaxial were significantly higher than those measured by GREaxial (P = 0.0018) and GREsagittal (P = 0.0012). The mean stiffness values of the fibroids measured by SE-EPIsagittal were significantly higher than those measured by GREaxial (P = 0.0138) and GREsagittal (P < 0.0001). There were no significant differences between GREaxial and GREsagittal (P = 1.0000) or SE-EPIaxial and SE-EPIsagittal (P = 1.0000). The ICC between the 2 observers was excellent for all methods (ρ = 0.903-0.981, Figure 2). Figure 3 presents representative clinical case.Discussion
We demonstrated that stiffness values measured by SE-EPI-MRE were significantly higher than those measured by GRE-MRE. In liver MRE, signal-to-noise ratio of SE-EPI-MRE is higher than that of GRE-MRE (2). This might have led to the difference between the stiffness of uterine fibroids.Conclusion
SE-EPI-MRE showed lower fibroid stiffness values than GRE-MRE. Each MRE method is a valid and reliable technique for measuring the stiffness of uterine fibroids.Acknowledgements
No acknowledgement found.References
(1) Stewart EA, et al. Fertil Steril 2011;95:281-284.
(2) Mariappan YK, et al. Radiology 2016 Aug 10:160153. [Epub ahead of print]
Figures
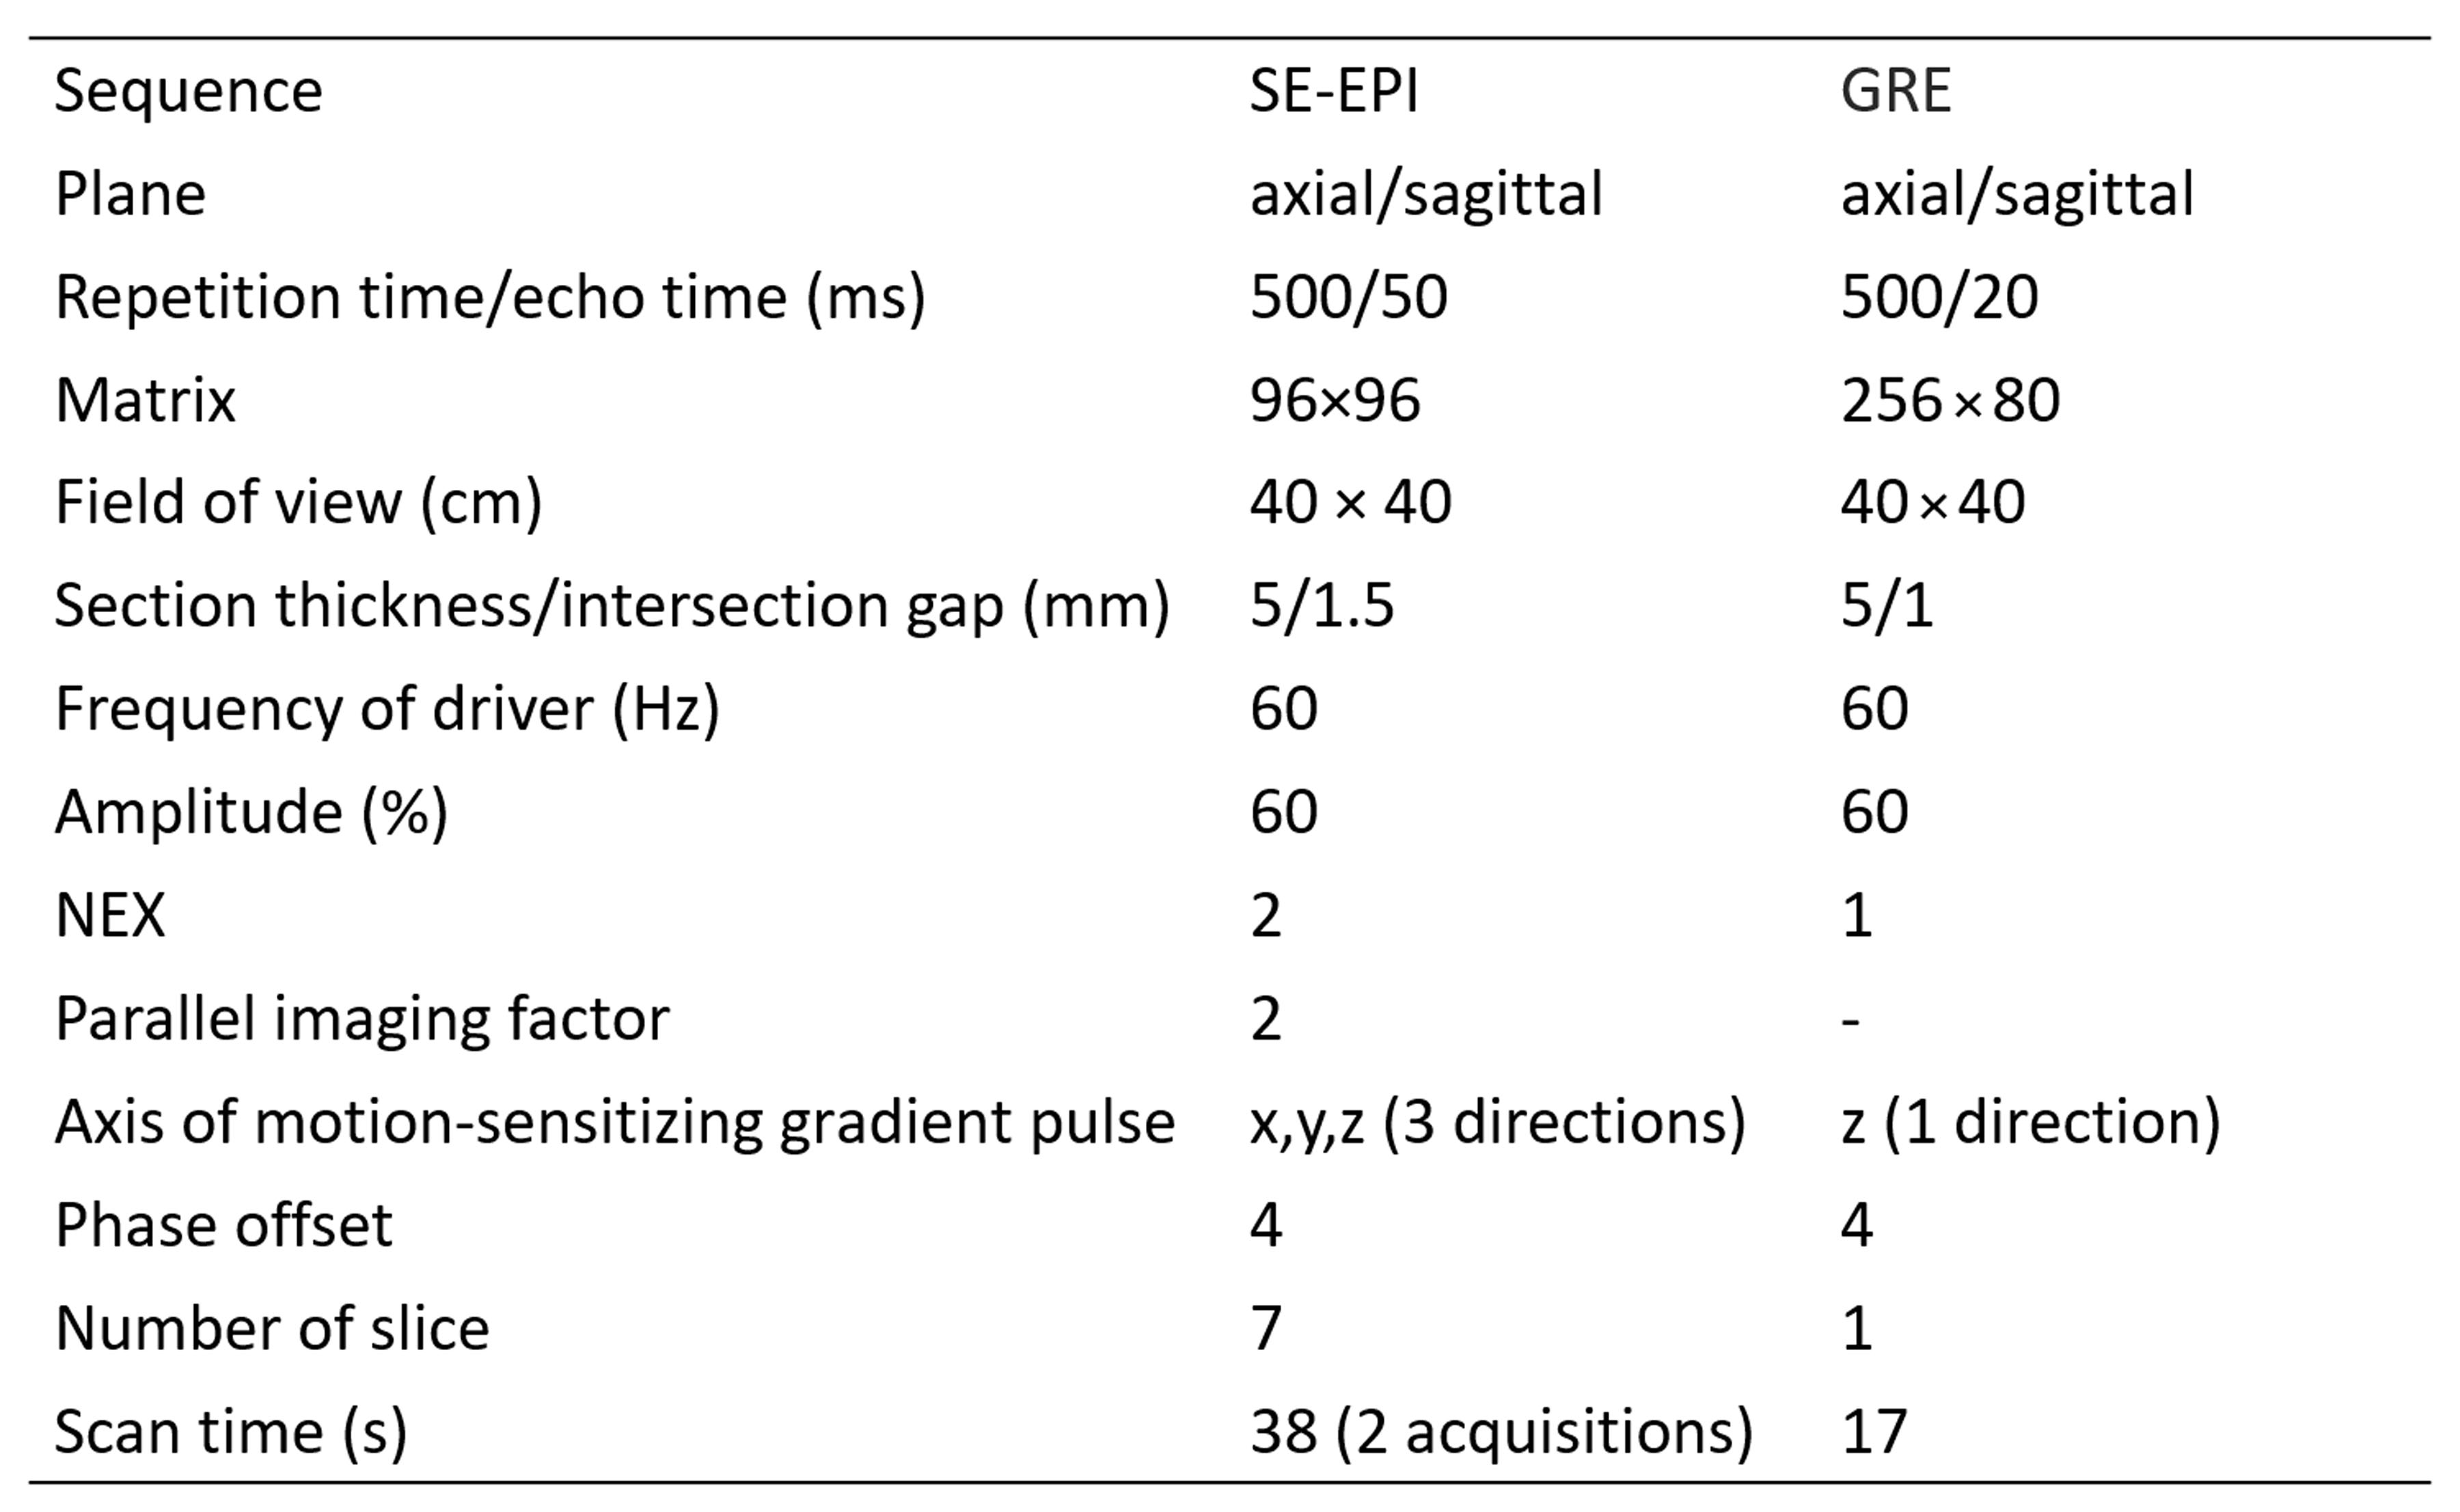
Table 1. MR sequence parameters of
spin-echo echo-planar imaging (SE-EPI) and gradient-echo (GRE) methods.
NEX = number of excitations
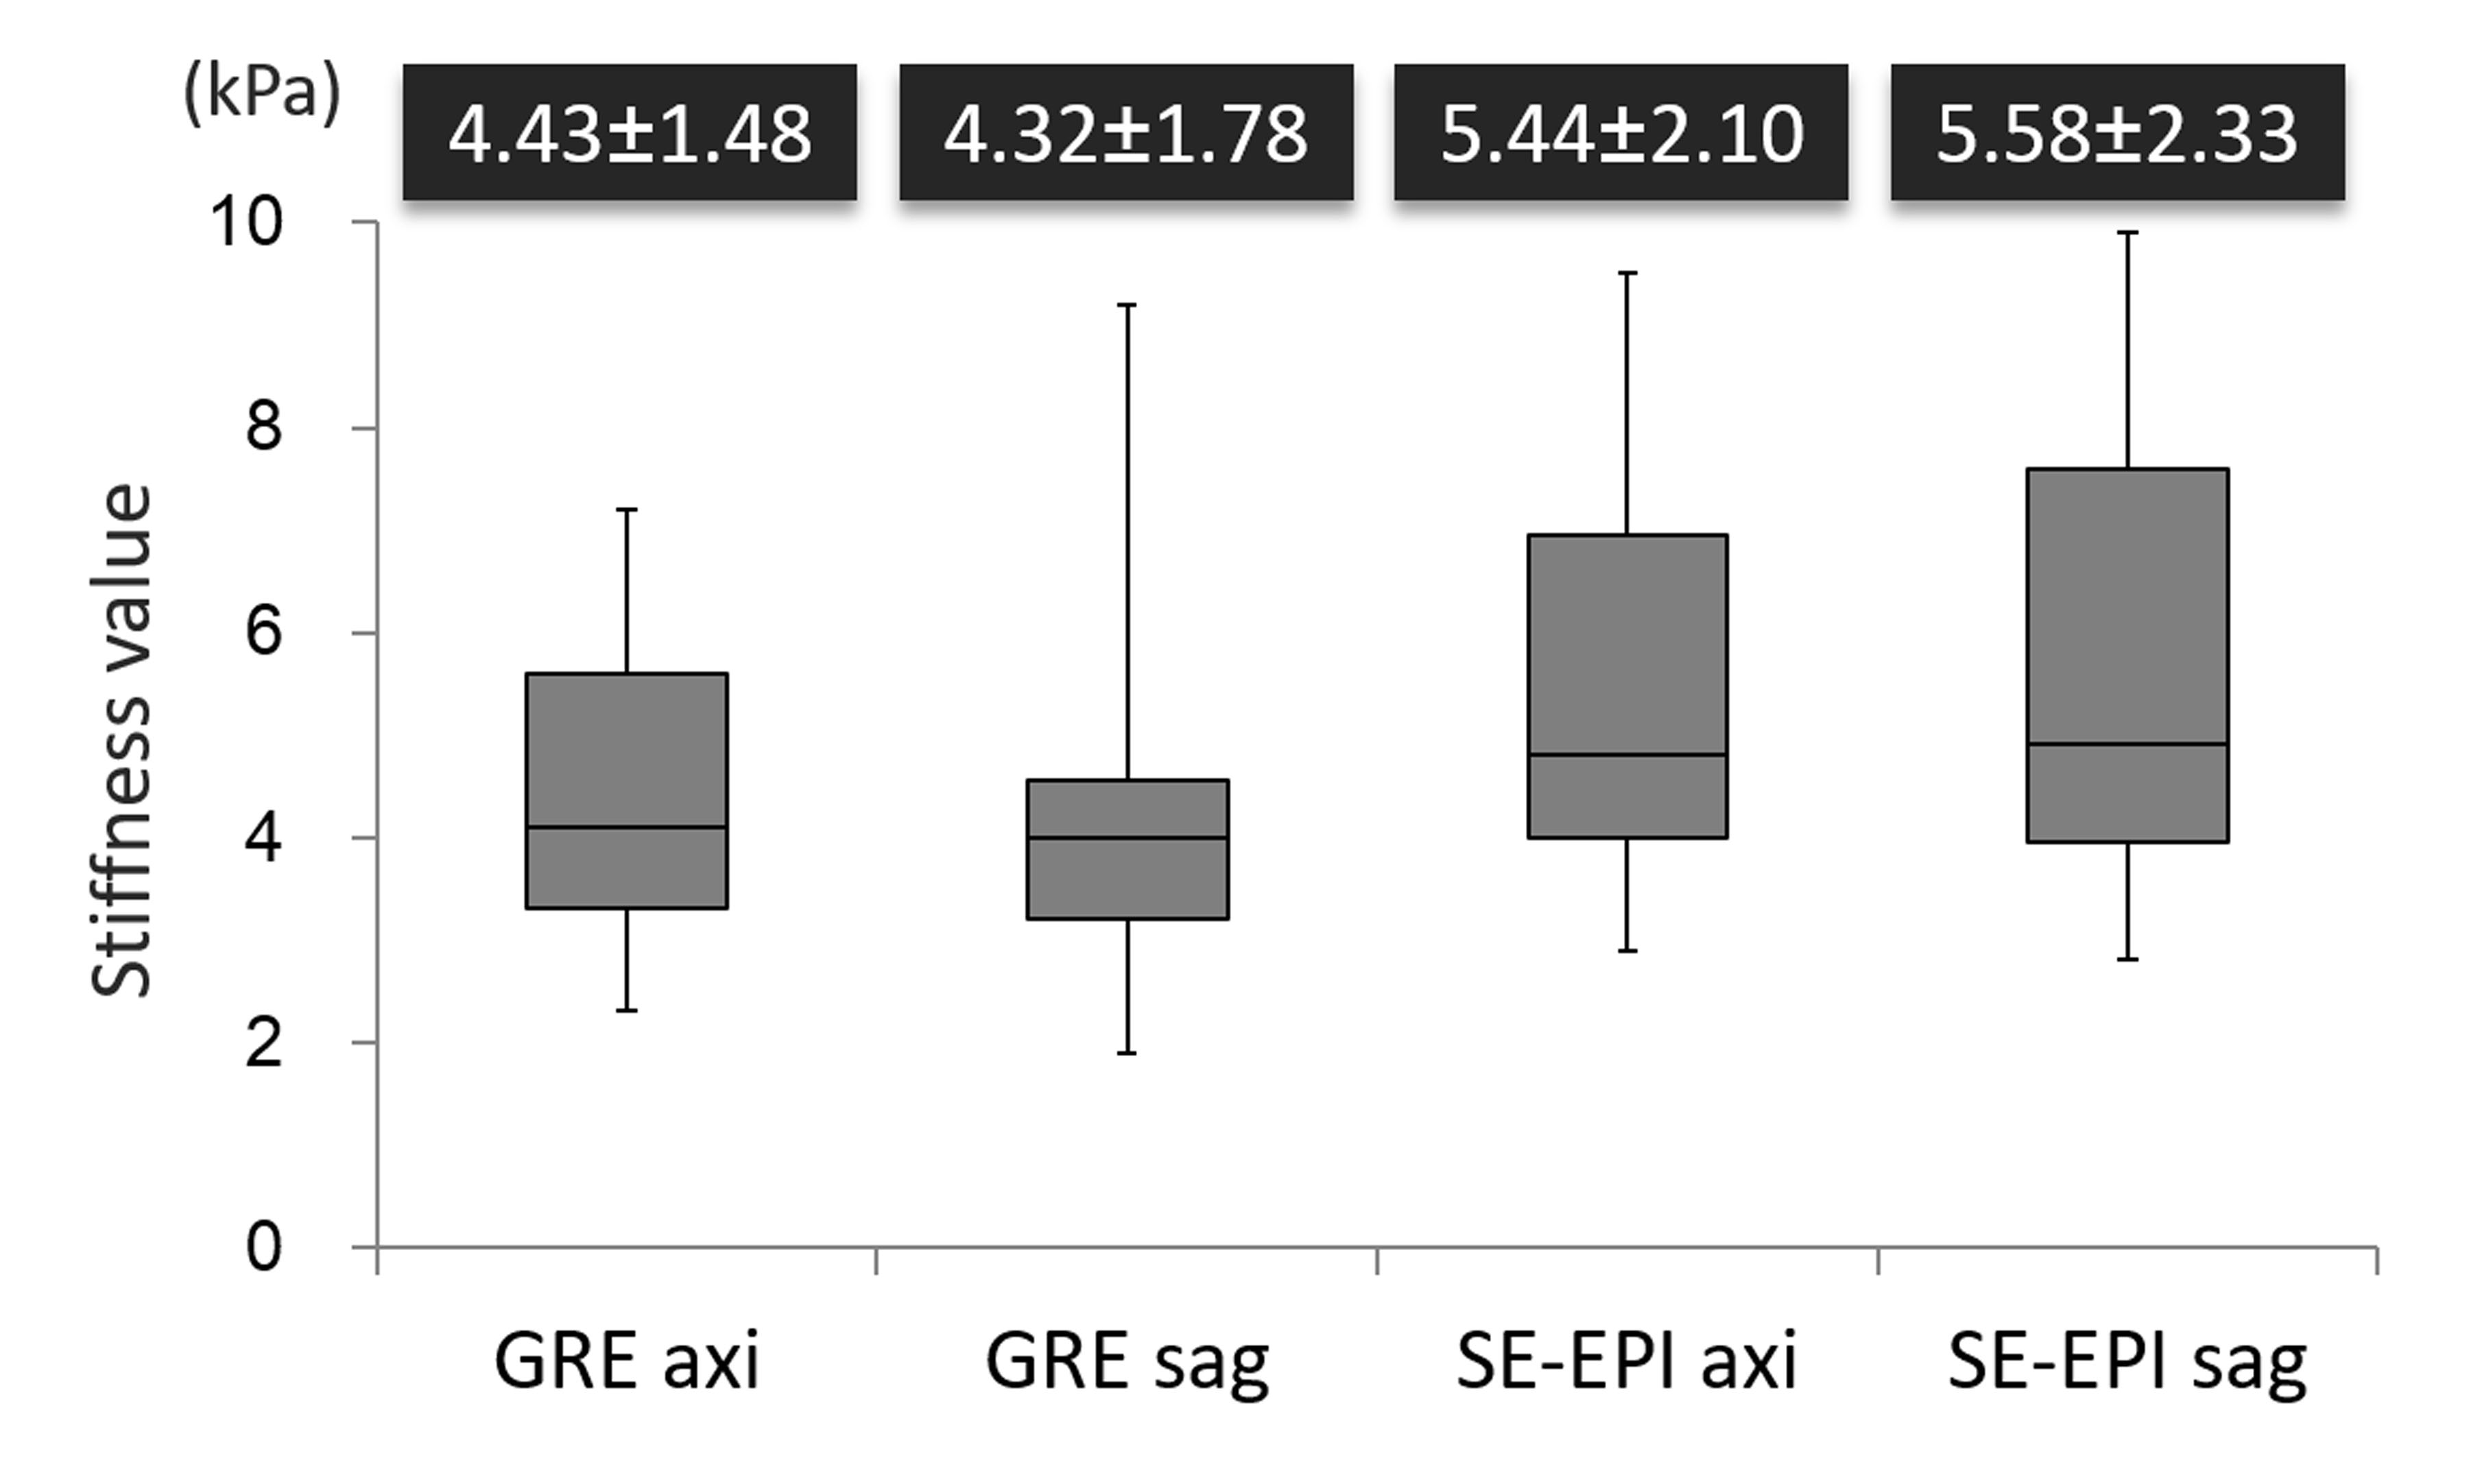
Figure 1. The
stiffness values of uterine fibroids in the four methods.
The mean stiffness values of the fibroids measured
by SE-EPIaxial were significantly higher than those measured by GREaxial
(P = 0.0018) and GREsagittal
(P = 0.0012). The mean stiffness
values of the fibroids measured by SE-EPIsagittal were significantly
higher than those measured by GREaxial (P = 0.0138) and GREsagittal (P < 0.0001). There were no
significant differences between GREaxial and GREsagittal
(P = 1.0000) or SE-EPIaxial
and SE-EPIsagittal (P
= 1.0000).
SE-EPI = spin-echo echo-planar imaging,
GRE = gradient-echo
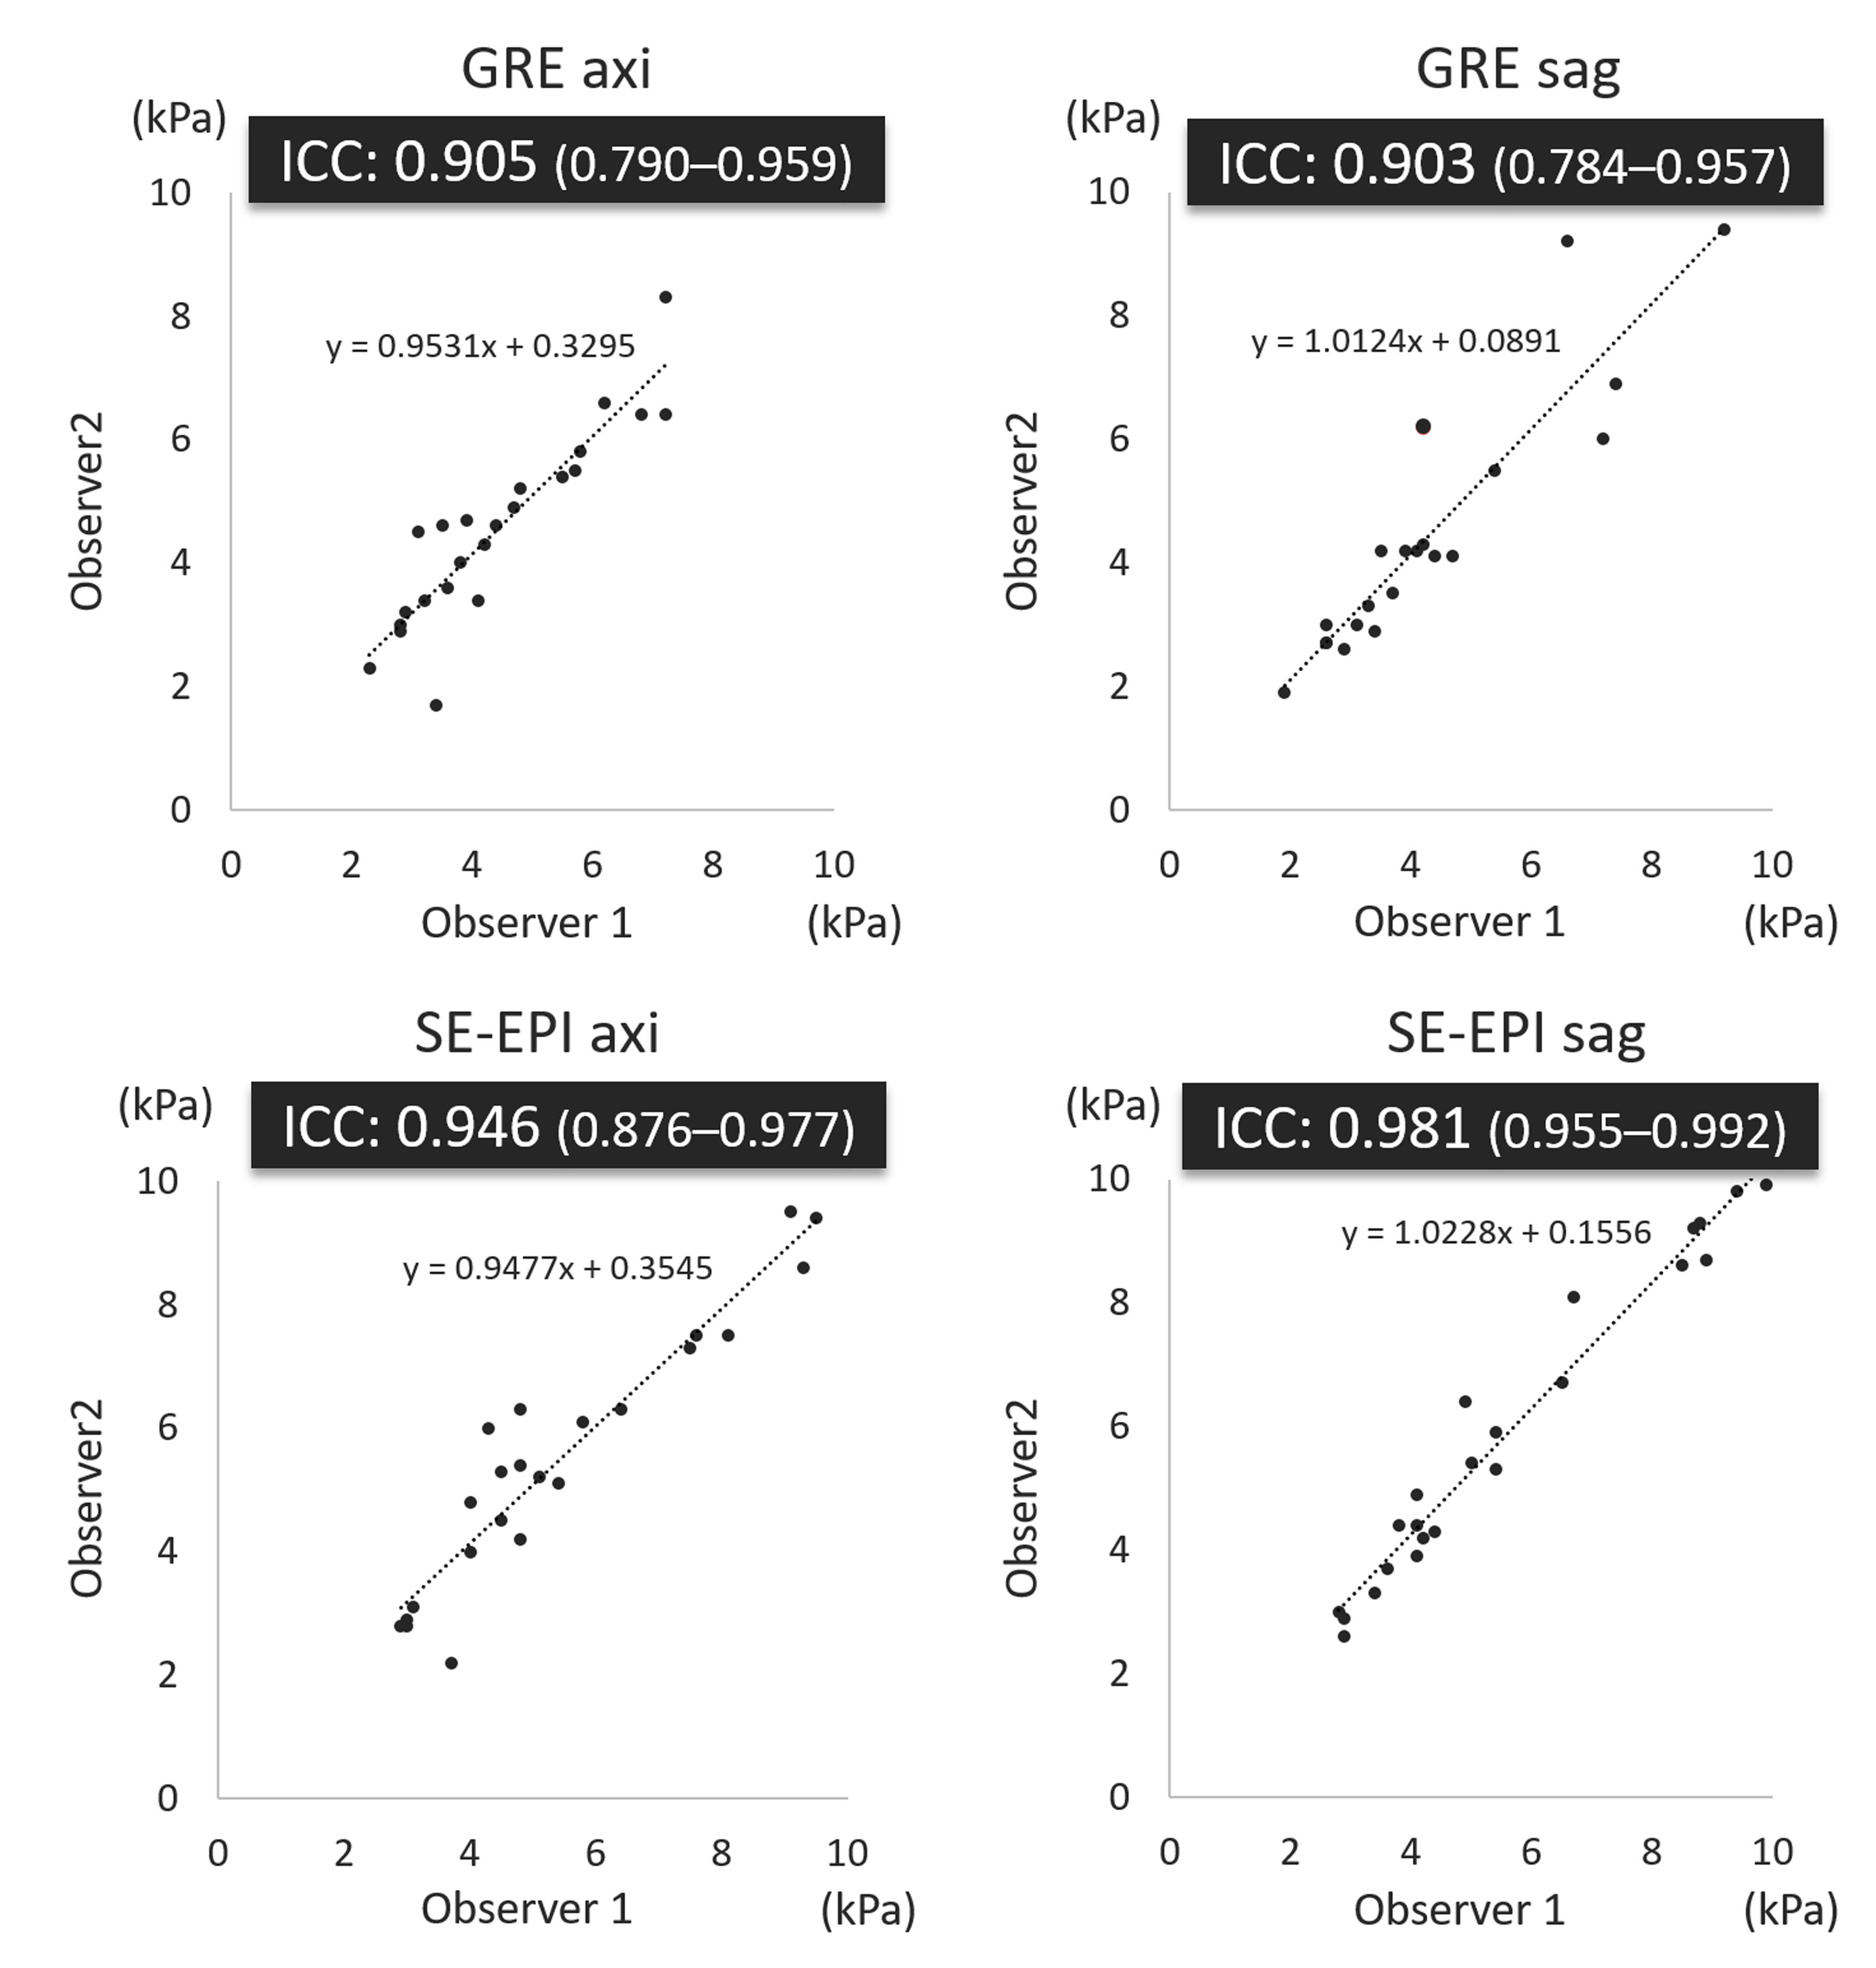
Figure 2. Scatter plot of the stiffness
values of uterine fibroids calculated by two observers.
The interobserver intraclass correlation
coefficients for measurement of the stiffness values of uterine fibroids
were excellent for all methods (ρ = 0.903-0.981). Dashed line represents linear
regression.
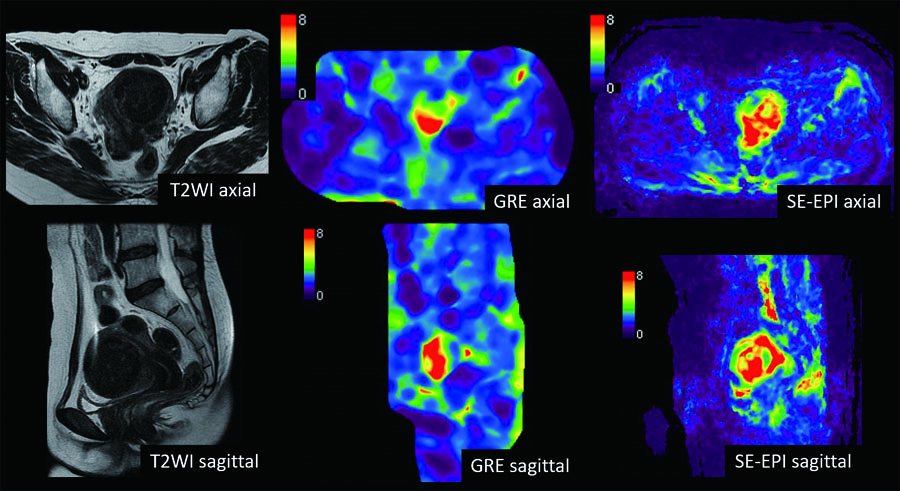
Figure 3. Imaging
findings of a 48-year-old woman.
A two-dimensional postprocessing method
was used for GRE-MRE, while a three-dimensional postprocessing method was used
for SE-EPI-MRE. We manually placed as large a region of interest as possible to
exclude crosshatching of areas inadequate for measurement on the stiffness map.
Central slices were selected for SE-EPI-MRE.
SE-EPI = spin-echo echo-planar imaging,
GRE = gradient-echo