2040
Optimisation for Pulmonary R2* Quantification and Repeatability Evaluation1Radiotherapy and Imaging, The Institute of Cancer Research, Surrey, United Kingdom
Synopsis
In 5 patients with lung cancer, UTE-MRI was used to derive pulmonary R2* in lung and establish its repeatability. Plausible R2* values were obtained only when using TEs of 0.08 and 0.2 ms: higher TEs produced implausible mean negative R2* within individual patients and a cohort R2* not significantly different from zero, due to lack of signal decay beyond TE=0.2ms. Pulmonary R2* values derived using TEs of 0.08 and 0.2ms were higher than prior reports where longer echo-times were employed. Test-retest limits-of-agreement were +90.5%to -47.5% indicating that a 90% increase in R2*is required post-radiotherapy to reliably demonstrate radiation-induced change.
Introduction
UTE MRI enables the generation of signal from structures that show little or no signal on conventional MRI techniques1,2. For lung, T2* values reported from pre-clinical studies at 3T are in the region of 600-900μs (0.6-0.9ms), changing with extent of lung inflation3. However, no consensus exists for optimal UTE sequence parameters required for T2* quantification (including echo times or k-space filling technique) and the relative contributions of intrinsic pulmonary parenchymal T2 versus susceptibility to overall T2* has not been determined. In addition, test-retest repeatability of pulmonary T2* quantification has not yet been reported.Aim
To rationalise post processing parameters for R2* quantification and compare test-retest R2*derived from UTE MRI, in normal lung.Methods
5 patients (55 to 78 years old) with previous radiation therapy for lung cancer were scanned twice within 1 week (interval between scans 1 to 7 days). Data was acquired using a UTE protocol that utilized 3D isotropic k-space filling, with successive separate acquisitions at increasing TE. MRI was performed during free breathing on a Philips 3T Achieva, using a SENSE XL phased array torso coil. 3-D isotropic radial acquisition was performed (TR 10ms, 1 NSA, matrix 192 x 192; FOV 350mm; reconstructed to 192 slices of 3.5mm thickness in the transverse plane; voxel size 3.5 x 3.5 x 3.5mm), imaging from the dome of diaphragm to lung apices. The sequence was run seven times using TE values of 0.08, 0.2, 0.3, 0.4, 0.5, 0.75 and 1.0ms during shallow respiration. Morphological imaging was provided by coronal breath-held T1W e-THRIVE and transverse respiratory-triggered T2W TSE sequences. Total imaging time was approximately 40 minutes.
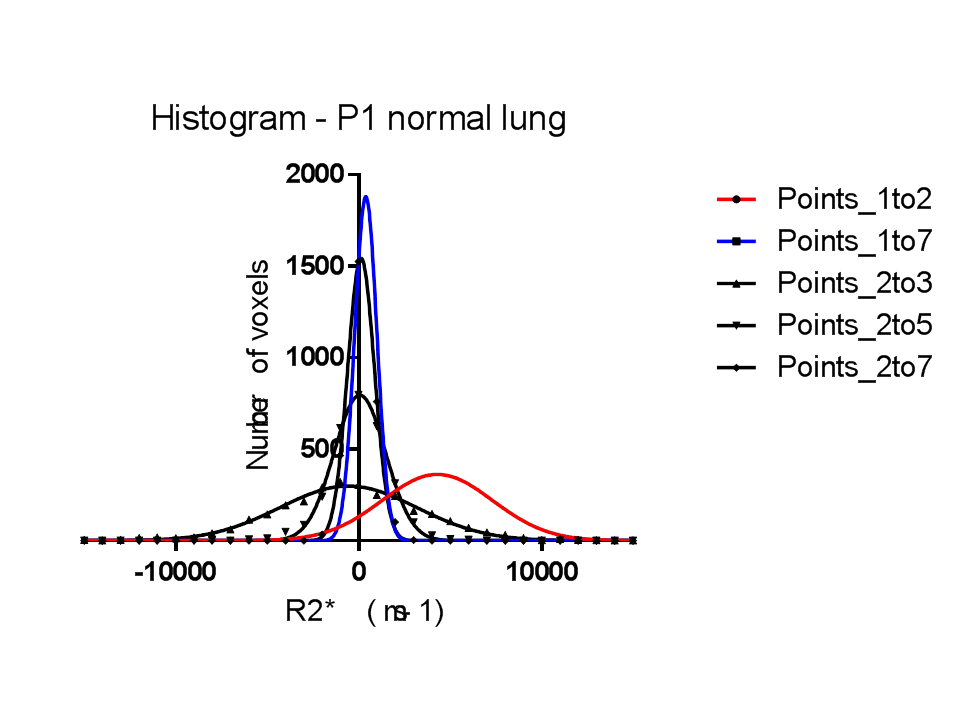
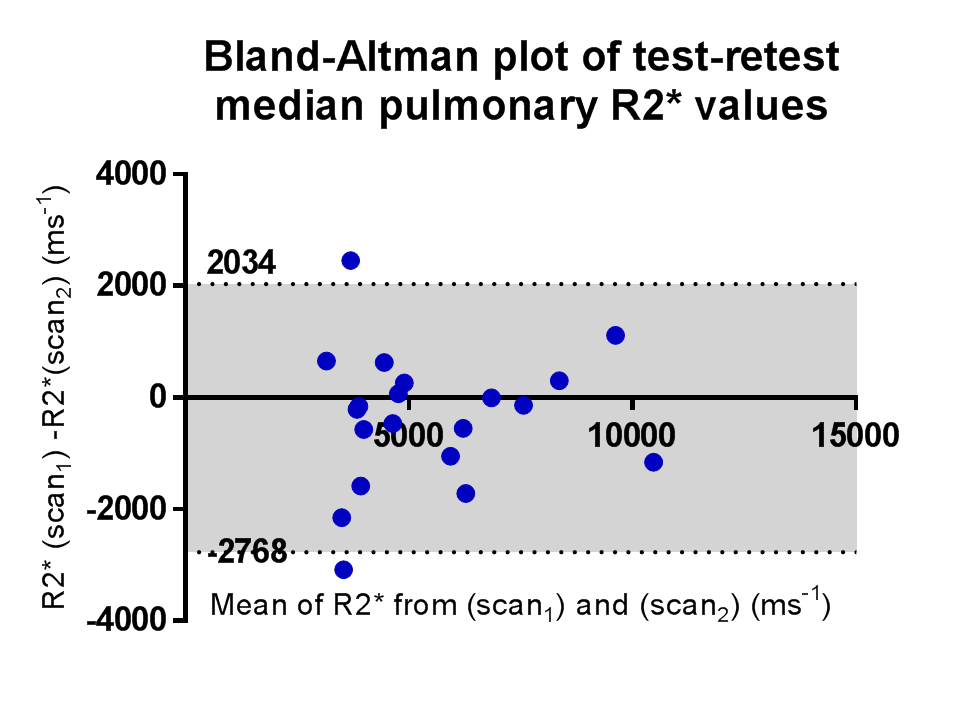
Regions of interest (ROI) were drawn within lung contralateral to tumour and therefore away from the radiation field. R2* values (= 1/T2*) were derived using voxel-wise linear regression analysis of the logarithmic plot of signal intensity decay with increasing TE (ADEPT software, ICR, Sutton) so as to generate R2* intensity maps using the following different combinations of echo times: (a) TE = 0.08 and 0.2 ms (points 1 to 2 of the signal intensity decay curve with increasing TE); (b) TE = 0.08, 0.2, 0.3, 0.4, 0.5, 0.75 and 1.0 ms (points 1 to 7) (c) TE = 0.2 and 0.3 ms (points 2 to 3); (d) TE = 0.2, 0.3 and 0.5 ms (points 2 to 5); and (e) TE = 0.2, 0.3, 0.4, 0.5, 0.75 and 1.0 ms (points 2 to 7). For each echo time combination, R2* values were also generated from a circular ROI placed in free air outside the patient as a comparator, on the same image slice as the pulmonary ROIs. For all analyses, R2* was calculated to include both positive and ‘physically implausible’ negative voxels values, within which signal decay did not occur with increasing TE. Following this, test-retest repeatability was calculated for R2* derived using the TE combination that provided consistently meaningful R2* values.
Results
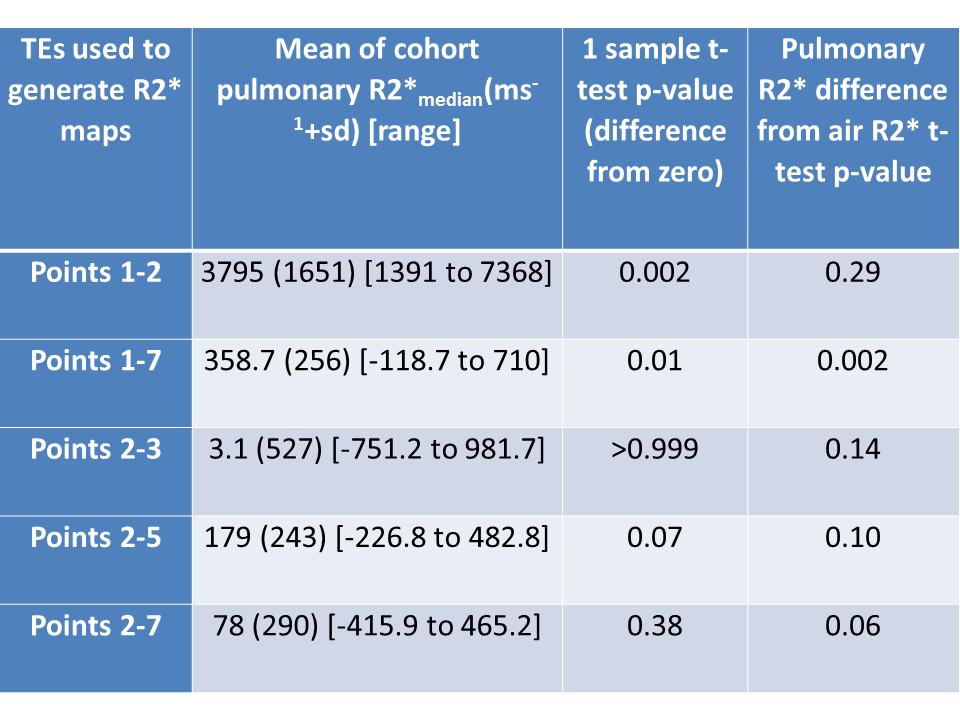
Using points 1-2 (TE = 0.08 and 0.2ms) to generate pulmonary R2* was the only TE combination that consistently yielded plausible positive mean values; with these TEs, no negative mean R2* were generated for patients P1-P5 (range of mean R2* = 1240 to 7441 ms-1 (Figure 1). All other TE combinations generated implausible negative mean pulmonary R2*. The cohort R2* values and their difference from zero and air are summarized in Table 1. Coefficient of variability of the test-retest of R2* derived from points 1 and 2 was 23.6% (95%CI 17.9-34.6%), Limits of Agreement +90.5% and -47.5%.Discussion and Conclusion
Using TEs 0.08 and 0.2ms to derive pulmonary R2* resulted in consistently positive and therefore plausible values. At higher echo times, a large proportion of negative pulmonary R2* values were generated, due to a failure of signal to decay consistently within lung beyond TE = 0.2ms. This is confirmed by the observation that cohort mean pulmonary R2* was not significantly different form zero when TE = 0.2ms was the shortest TE. Our R2* values were higher than expected from prior mouse models of normal lung and emphysematous lung in humans (T2* values of 1160+/-150 μs (normal) and 700 μs +/-70 μs (emphysema))4, but the repeatability of the measurement will allow changes in the region of 50-90% to be measured between baseline and post-radiotherapy for the purposes of monitoring radiation induced change.Acknowledgements
We acknowledge CRUK and EPSRC support to the Cancer Imaging Centre at ICR and RMH in association with MRC & Dept of Health C1060/A10334, C1060/A16464 and NHS funding to the NIHR Biomedical Research Centre and the Clinical Research Facility in Imaging. A. W was funded by EORTC Innovative Medicines Initiative Joint Undertaking under grant agreement number 115151.References
1. Egger C, Gerard C, Vidotto N, Accart N, Cannet C, Dunbar A, et al. Lung volume quantified by MRI reflects extracellular-matrix deposition and altered pulmonary function in bleomycin models of fibrosis: effects of SOM230. American journal of physiology Lung cellular and molecular physiology. 2014;306(12):L1064-77.
2. Bydder G. The Agfa Mayneord lecture: MRI of short and ultrashort T2 and T2* components of tissues, fluids and materials using clinical systems. The British journal of radiology. 2014.
3. Togao O, Tsuji R, Ohno Y, Dimitrov I, Takahashi M. Ultrashort echo time (UTE) MRI of the lung: assessment of tissue density in the lung parenchyma. Magnetic resonance in medicine : official journal of the Society of Magnetic Resonance in Medicine / Society of Magnetic Resonance in Medicine. 2010;64(5):1491-8.
4. Ohno Y, Nishio M, Koyama H, Yoshikawa T,
Matsumoto S, Seki S, et al. Pulmonary 3 T MRI with ultrashort TEs: influence of
ultrashort echo time interval on pulmonary functional and clinical stage
assessments of smokers. Journal of magnetic resonance imaging : JMRI.
2014;39(4):988-97.
Figures