2033
Gadolinium-enhanced high-flip-angle R2* mapping enables estimation of a greater range of R2* values1Liver Imaging Group, Department of Radiology, University of California, San Diego School of Medicine, San Diego, CA, United States
Synopsis
The range of R2* values estimated from MR sequences using low flip angles (FA) is limited by the background signal decay. The administration of contrast allows the use of higher FAs and increases the signal to noise ratio (SNR), allowing the estimation of a greater range of R2* values. We compared pre- and post-contrast R2* values in 158 patients and observed large discrepancies at R2* values greater than 300s-1. Our findings suggest that in patients with severe iron overload, post-contrast high-FA R2* mapping may be the preferred sequence for iron quantification.
Introduction
R2* is emerging as a method of estimating hepatic iron content. R2* and proton density fat fraction (PDFF) are estimated by a multi-echo (ME), gradient-recalled-echo (GRE) technique, acquired using a low flip angle (FA) to minimize T1 effects, and analyzed using a model that incorporates the multi-peak spectrum of fat 1-4. A limitation of this technique is that in cases of rapid signal decay (high R2*), the signal may decay to background noise after the first two or three echoes, possibly introducing errors in R2* estimation. The administration of gadolinium (Gd) -based contrast agent reduces water T1 to that of fat, minimizing T1 effects, allowing the use of a higher FA which increases signal-to-noise. Thus the use of high FA may allow more accurate estimation of R2*. Therefore, the purpose of this study is to examine the effect of Gd on the estimation of hepatic R2*, especially in the high R2* range.Methods
Patients underwent magnetic resonance (MR) exams with Gd-based contrast agent administration on a 3T scanner (GE Signa EXCITE HDxt, GE Healthcare, Waukesha, WI). This exam included both the 10° FA and the 50° FA GRE sequences. The 10° FA sequence was acquired before Gd administration, and the 50° FA sequence was acquired post Gd administration. Regions of interest (ROI) were placed in the liver, one ROI in each Couinaud segment, and R2* values from these segments were averaged to give a whole liver average R2*. ROIs were co-localized between the 10° FA pre and 50° FA post Gd acquisitions. The R2* values obtained pre- and post-contrast were compared using the Pearson’s correlation coefficient and Bland-Altman (BA) analysis.Results
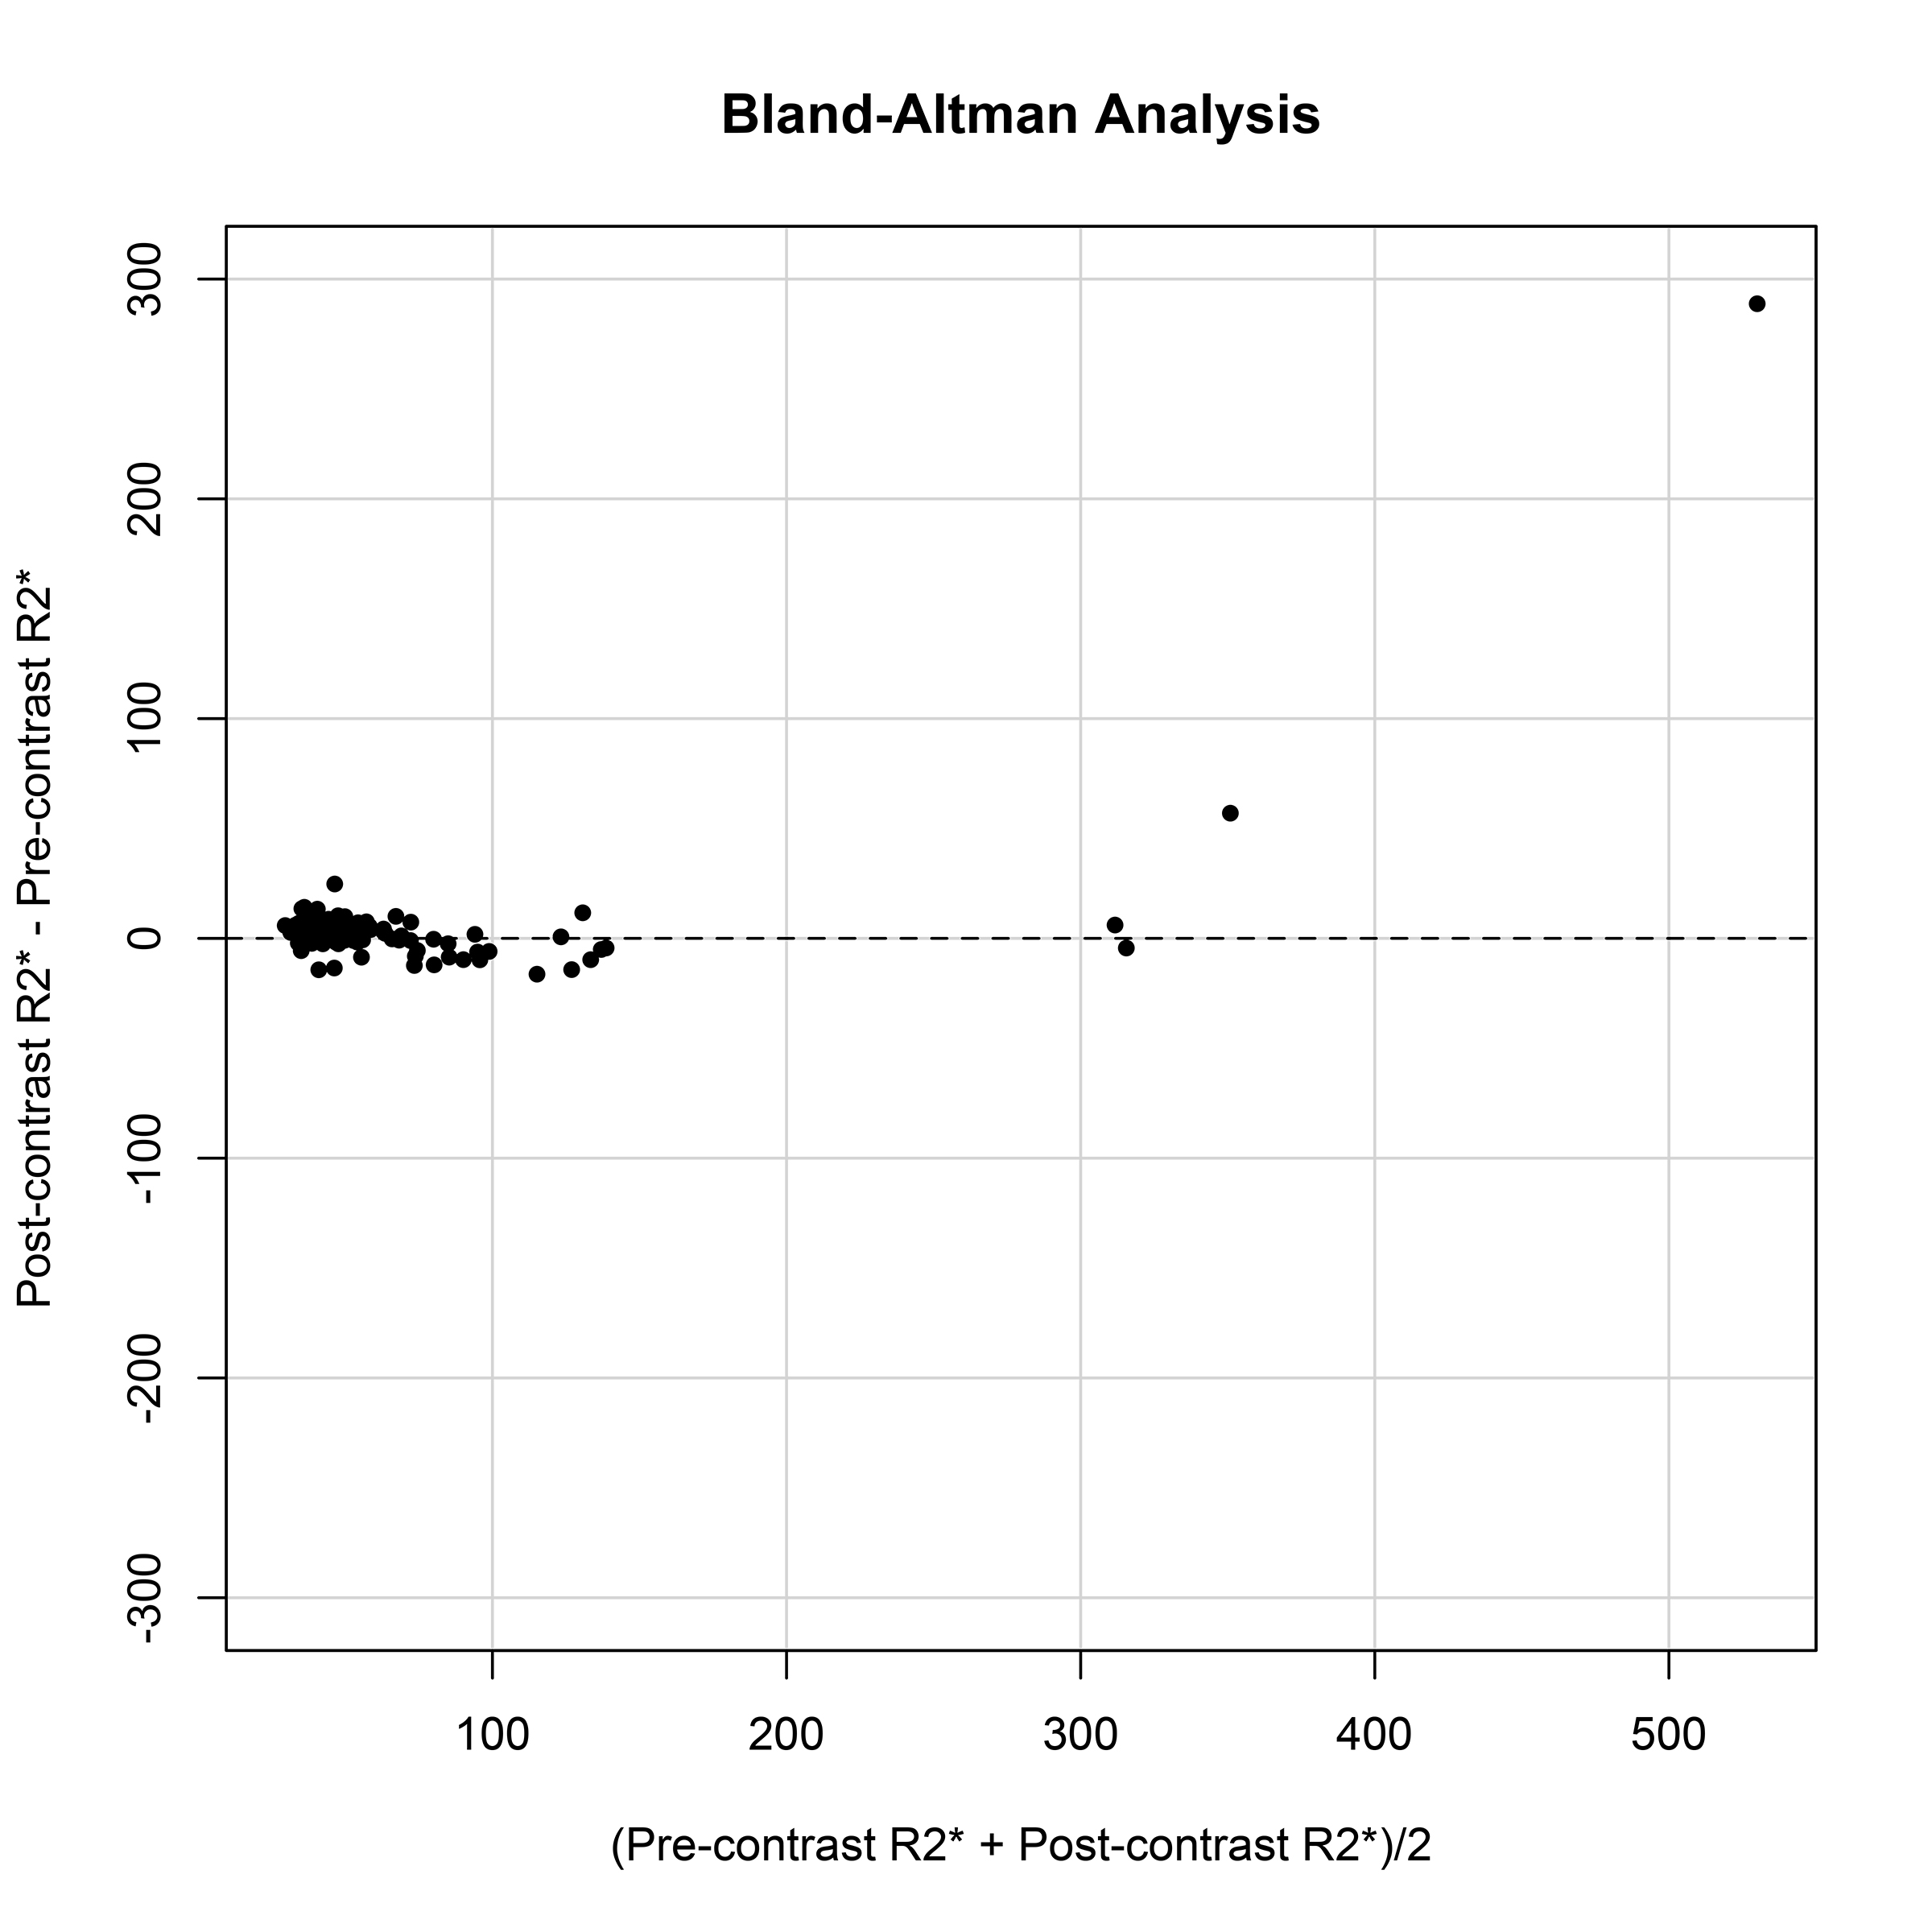
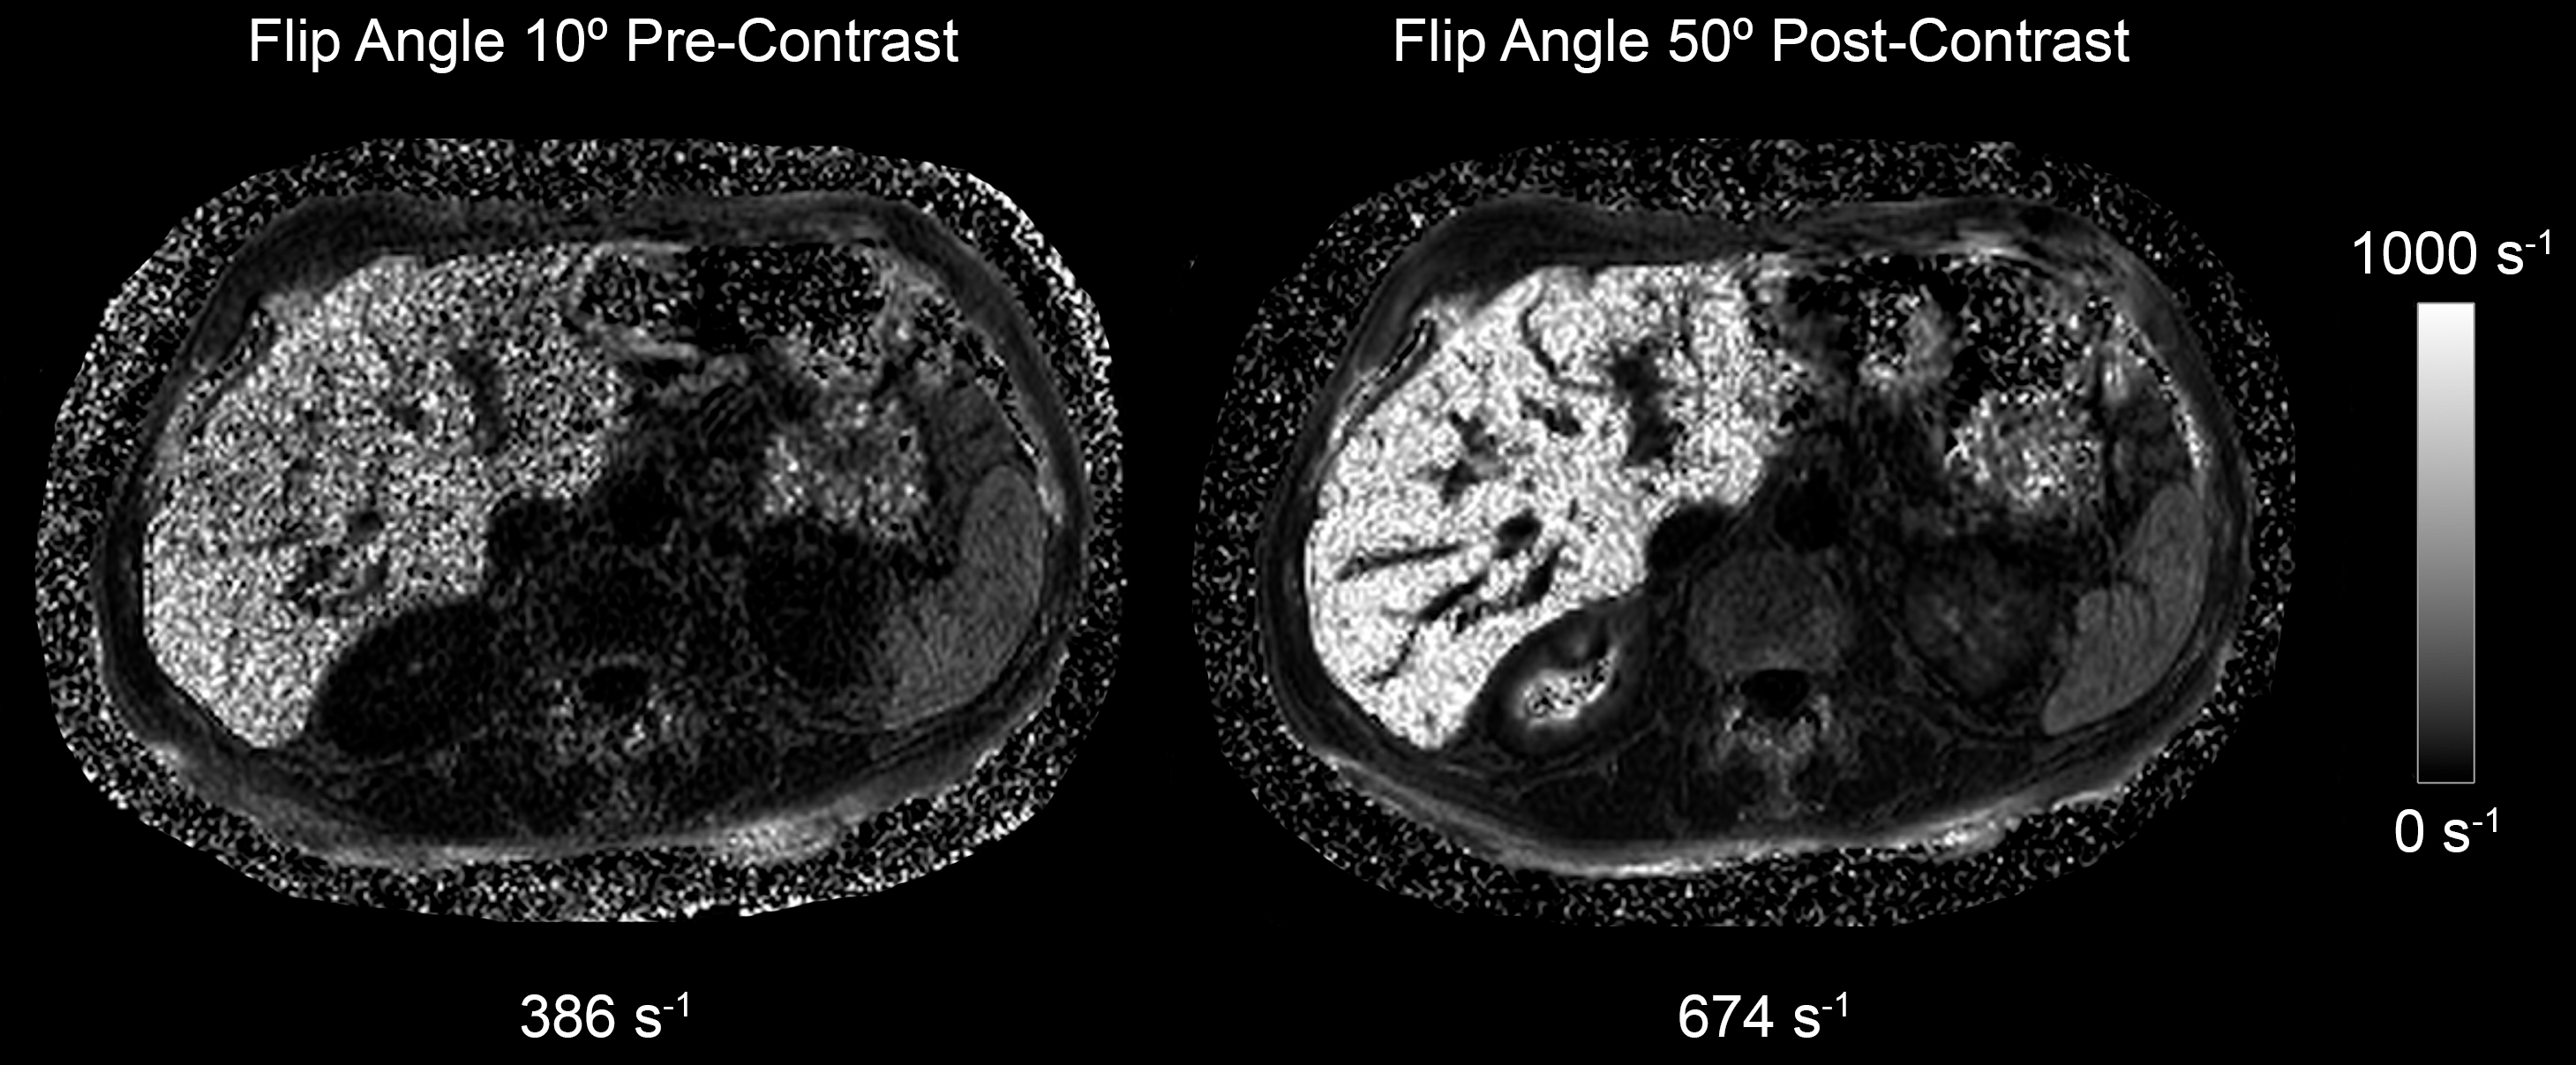
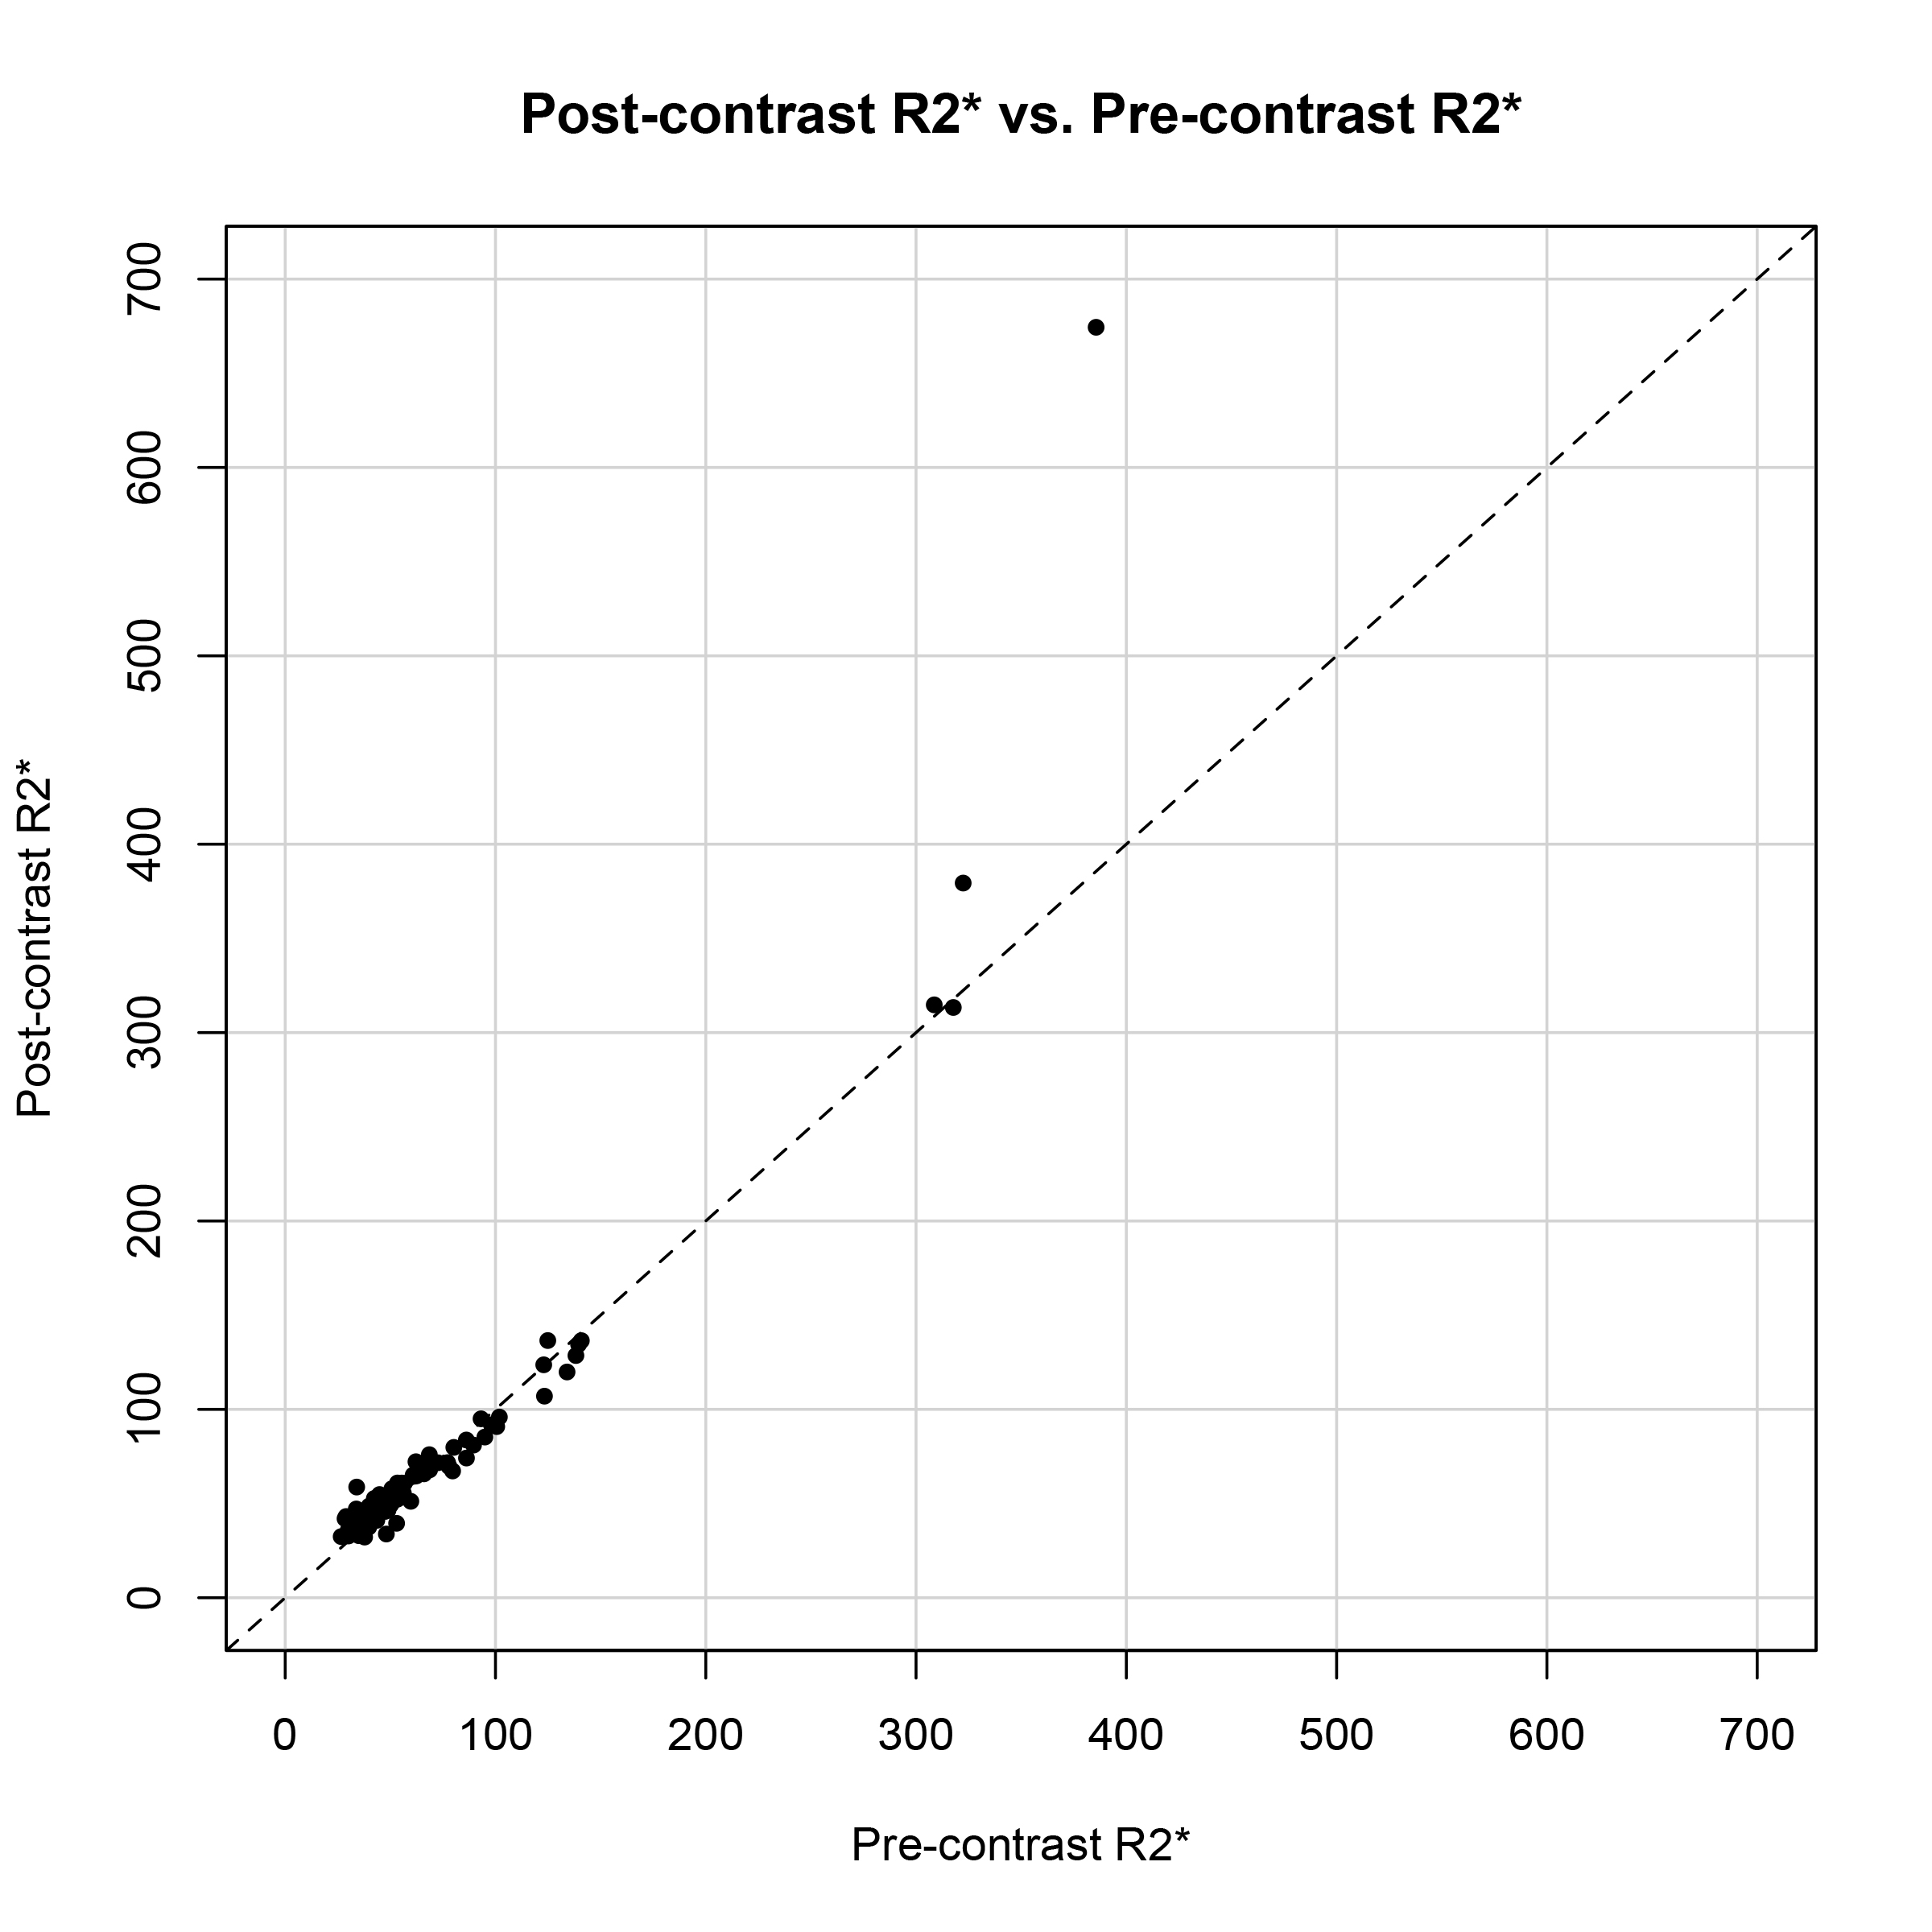
158 patients (93 male, 65 female, mean age 58.4 with a range of 19 – 87) were included in this study. The Bland-Altman plot illustrates close agreement between the pre- and post-contrast R2* values that are less than 300s-1, however large discrepancies were seen at R2* values > 300s-1 (Figure 1). In two patients where the pre-contrast R2* values were 322 s-1 and 386 s-1, the post-contrast R2* was estimated to be 379 s-1 and 674 s-1 respectively (Figure 2). The correlation coefficient between R2* values from FA 10° pre, and FA 50° post sequences was 0.95 in the overall cohort (Figure 3). However, when excluding patients with R2* values greater than 300 s-1, the correlation coefficient improved to 0.99.Discussion
The range of R2* values estimated from MR sequences using low FAs is limited by the background signal decay. The administration of contrast allows the use of higher FAs and increases the signal-to-noise ratio (SNR), allowing the estimation of a greater range of R2* values. This effect is apparent at higher R2* values of > 300s-1 where there is a substantial discrepancy between pre- and post-contrast R2* values. Our results suggest that in patients known to have severe iron overload, post-contrast high-FA R2* mapping may be the preferred sequence for iron quantification.Conclusion
Substantial discrepancies are seen between pre- and post-contrast R2* values in patients with severe iron overload, where the use of contrast increases the SNR and may allow more accurate measurement of higher R2* values.Acknowledgements
No acknowledgement found.References
1. Bydder M, Yokoo T, Hamilton G, et al. Relaxation effects in the quantification of fat using gradient echo imaging. Magn Reson Imaging 2008;26(3):347–59.
2. Hernando D, Levin YS, Sirlin CB, Reeder SB. Quantification of liver iron with MRI: state of the art and remaining challenges. J Magn Reson Imaging. 2014;40(5):1003-21.
3. Yokoo T, Shiehmorteza M, Hamilton G, et al. Estimation of hepatic proton-density fat fraction by using MR imaging at 3.0 T. Radiology 2011;258(3):749–59.
4. Reeder SB, Sirlin CB. Quantification of liver fat with magnetic resonance imaging. Magn Reson Imaging Clin N Am 2010;18(3):337–57, ix.
Figures