2032
Comparison of 2D and 3D Magnetic Resonance Elastography (MRE) Wave-Image Quality Across a Range of Body Mass Indices1Radiology, Liver Imaging Group, University of California, San Diego, San Diego, CA, San Diego, CA, United States, 2Division of Gastroenterology, Hepatology, and Nutrition, Department of Pediatrics, University of California, San Diego, San Diego, CA, 3Gastroenterology, Rady Children's Hospital San Diego, San Diego, CA, 4NAFLD Translational Research Unit, Division of Gastroenterology, University of California, San Diego, La Jolla, CA, 5Radiology, University of Wisconsin - Madison, Madison, WI, 6Medical Physics, University of Wisconsin - Madison, Madison, WI, 7Biomedical Engineering, University of Wisconsin - Madison, Madison, WI, 8Medicine, University of Wisconsin - Madison, Madison, WI, 9Emergency Medicine, University of Wisconsin - Madison, Madison, WI, 10Radiology, Mayo Clinic, Rochester, MN
Synopsis
This analysis of 129 adults compared the
Introduction
Magnetic resonance elastography (MRE) is a noninvasive MR-based method that quantifies tissue stiffness as a biomarker of liver fibrosis. Conventional two-dimensional (2D) scalar MRE acquires multi-slice images that are motion-encoded in a single direction orthogonal to the imaging plane. This allows detection of shear waves as they propagate in the 2D imaging plane and stiffness is calculated in each slice independently of adjacent slices1. A more complicated three-dimensional (3D) vector MRE2,3 technique uses additional motion-encoding directions and a larger number of thinner slices to track waves with polarization in any direction, thereby permitting a more complete analysis of wave motion. The use of the 2D or 3D MRE scan affects different processing techniques to derive the mechanical properties of the tissues5. Recent studies have shown that both 2D and 3D MRE approaches are highly accurate and comparable for diagnosing advanced fibrosis4,5. There is emerging evidence that 3D MRE offers improved assessment of wave propagation, resulting in the ability to diagnose larger areas of tissue5,6. The direct comparison of 2D and 3D MRE wave-image quality has not been explored in detail to date. The primary purpose of this study was to compare the performance of 2D and 3D MRE techniques, using the area of analyzable MRE data found from regions of interest (ROI) as a metric of technical success. The secondary purpose was to examine whether differences in the ROI areas of good wave-image quality depend on BMI. We classified BMI into the following sub-cohorts: normal weight (BMI of 18.5 – 24.9 kg/m2), overweight (BMI of 25.0 – 29.9 kg/m2), obese (BMI > 30.0 kg/m2), and morbidly obese (BMI > 40.0 kg/m2 or BMI > 35.0 kg/m2 with comorbidities such as diabetes and hypertension).Methods
This secondary analysis of a prospective, cross-sectional study included 129 adults with known or suspected NAFLD. The study was IRB-approved and HIPAA-compliant. All patients provided informed consent. Same-day 2D and 3D 60-Hz MRE scans were performed on a 3T scanner (GE Signa EXCITE HDxt) using a multi-slice motion-sensitized GRE sequence for 2D and a motion-sensitized SE EPI sequence for 3D MRE (Table 1). Patients were scanned between January 2013 and October 2016. Three image analysts (in a random subdivision of labor) examined MRE wave images as cine loops (MRE Quant software, Mayo Clinic) to identify regions with good wave propagation within the liver parenchyma. For 3D MRE, four slices were selected that were most closely registered to the 2D MRE slice locations. These ROIs were placed where reliable hepatic stiffness measurements could be obtained (Figure 1) and their areas were subsequently used as a quantitative measure of wave-image quality. The Wilcoxon signed-rank test was used to assess whether the 2D and 3D MRE ROI areas differed in the whole cohort and within each BMI sub-cohort. The Spearman’s rank correlation coefficient was computed to determine the correlation between BMI (as a continuous variable) and the ratio of the 3D ROI areas to the 2D ROI areas.Results
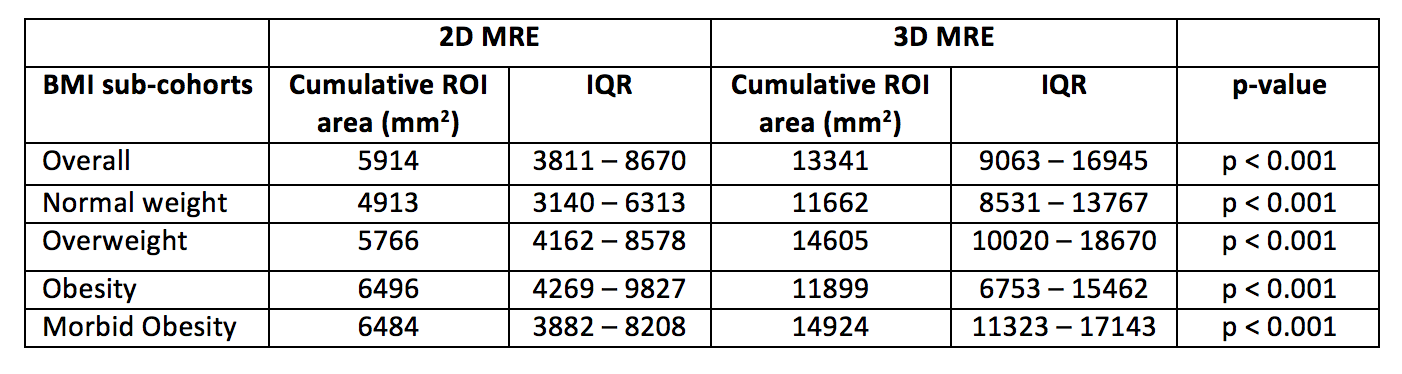
129 patients (75 female, 54 male, mean BMI 32.14 ± 6.53 kg/m2) were included in this study (Table 2). Mean age was 54 ± 13 years. Median 2D and 3D MRE ROI area for the whole cohort was 5914 mm2 (IQR: 3811 – 8670 mm2) and 13341 mm2 (IQR: 9063 – 16945 mm2), respectively. ROI areas of 3D MRE were significantly greater than those of 2D MRE in the whole cohort and in each BMI sub-cohort (p < 0.001 for all, Table 3). Correlation between BMI and the ratio of ROI areas was weak and was not statistically significant (ρ=-0.084, p=0.3422).Discussion
This study focused on comparing 2D and 3D MRE at 60 Hz. It is possible that MRE at other frequencies (e.g., 30, 40, 50, or 80 Hz) yield different results. A limitation to this study was the noticeable increase in difficulty when analyzing 2D and 3D MRE in patients with obesity and morbid obesity than is typically encountered in patients with normal weight. In a small number of patients, complete co-localization could not be performed, although this is unlikely to substantially affect the results. This study suggests that 3D MRE techniques may provide reliable stiffness data over larger regions of tissue, as demonstrated by the larger 3D MRE ROI areas.Acknowledgements
The authors wish to acknowledge support from the NIH (R01-DK088925 and R01-DK106419), as well as GE Healthcare who provides research support to UCSD and UW-Madison.References
1. Yin M, Talwalkar JA, Glaser KJ, Manduca A, Grimm RC, Rossman PJ, Fidler JL, and Ehman RL. Assessment of hepatic fibrosis with magnetic resonance elastography. Clin Gastroenterol Hepatol 2007;5:1207-1213.e2
2. Yin M, Kolipaka A, Woodrum DA, Glaser KJ, Romano AJ, Manduca A, Talwalkar JA, Araoz PA, McGee KP, Anavekar NS, and Ehman RL. Hepatic and splenic stiffness augmentation assessed with MR elastography in an in vivo porcine portal hypertension model. J Magn Reson Imaging 2013;38:809-815. 3. Nedredal GI, Yin M, McKenzie T, Lillegard J, Luebke-Wheeler J, Talwalkar J, Ehman R, and Nyberg. Portal hypertension correlates with splenic stiffness as measured with MR elastography. J Magn Reson Imaging 2011;34:79-87.
4. Forsgren MF, Noren B, Kihlberg J, Dahlqvist Leinhard O, Kechagias S, and Lundberg P. Comparing hepatic 2D and 3D magnetic resonance elastography methods in a clinical setting- Initial experiences. Eur J Radiol Open. 2015 Apr 28;2:66-70
5. Loomba R, Cui J, Wolfson T, Haufe W, Hooker J, Szeverenyi N, Ang B, Bhatt A, Wang K, Aryafar H, Behling C, Valasek MA, Lin GY, Gamst A, Brenner DA, Yin M, Glaser KJ, and Ehman RL. Novel 3D magnetic resonance elastography for the noninvasive diagnosis of advanced fibrosis in NAFLD: a prospective study. Am J Gastroenterol. 2016 Jul;111(7):986-94.
6. Shi Y, Xia F, Li QJ, Li JH, Yu B, Li Y, An H, Glaser KJ, Tao S, Ehman RL, and Guo QY. Magnetic resonance elastography for the evaluation of liver fibrosis in chronic hepatitis B and C by using both gradient-recalled echo and spin-echo echo planar imaging: a prospective study. Am J Gastroenterol. 2016 Jun;111(6):823-33.
Figures
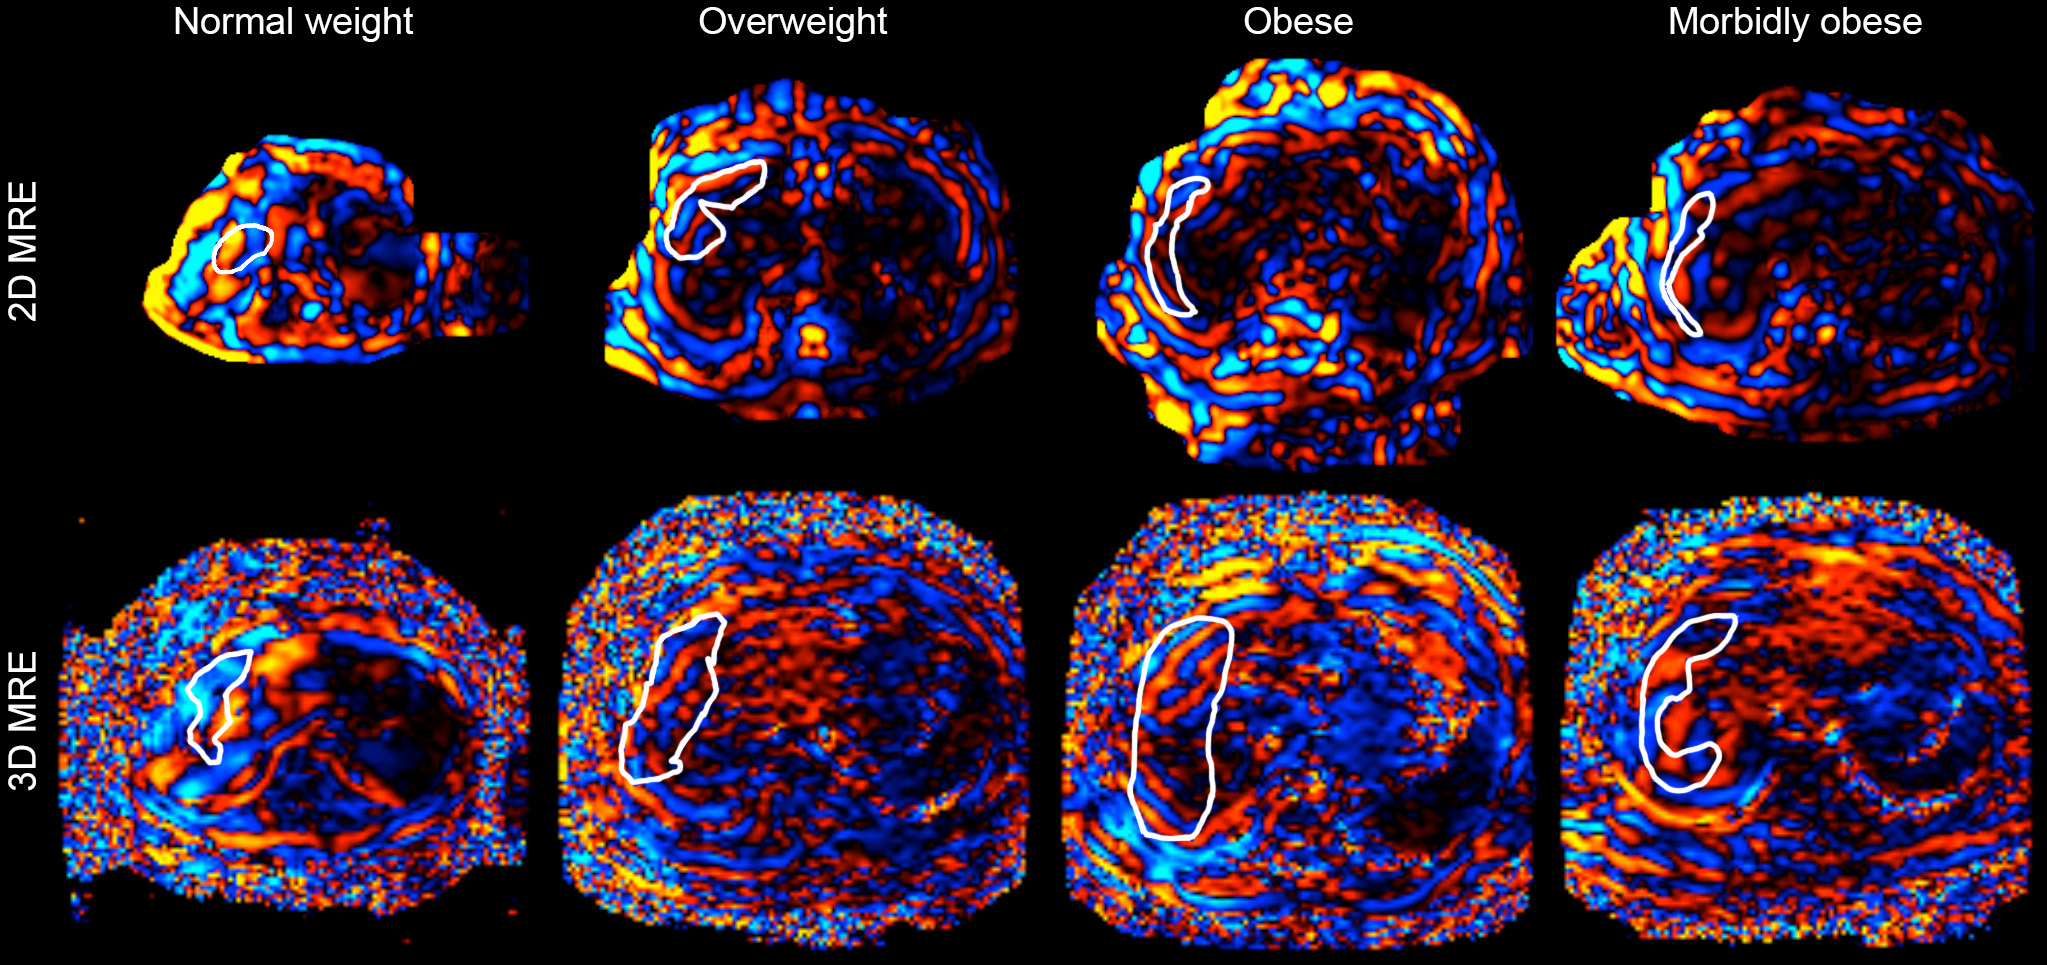
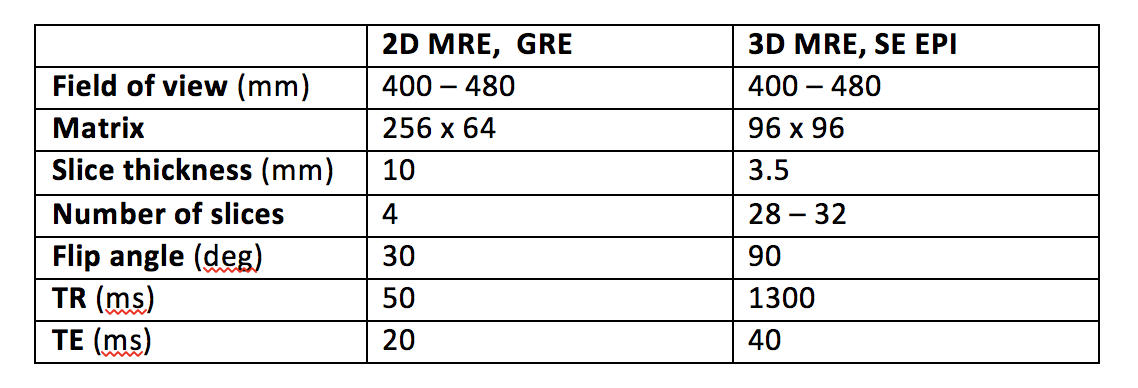
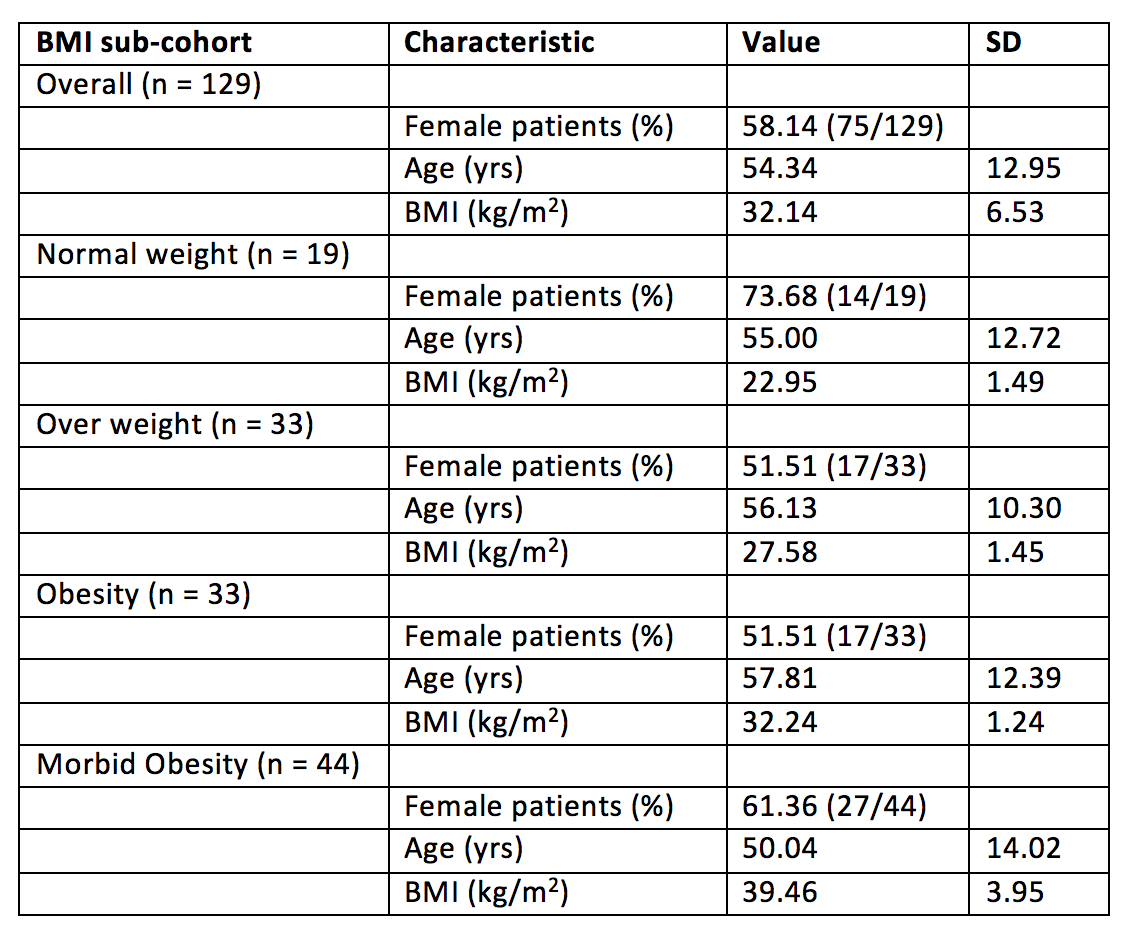
Table 2. Demographic characteristics of study participants. Age, height, weight and BMI are mean values. Abbreviations: SD, standard deviation; yrs, years; cm, centimeters; kg, kilograms