2031
Effect of fitting model on the accuracy of T2 and T2* magnetic resonance based liver iron concentration1Radiology, Columbia University, New York, NY, United States
Synopsis
Literature has suggested mixed results regarding agreement between T2 relaxivity based liver iron concentration (LIC) and T2* relaxivity based LIC The purpose of the following study is to determine whether or not choice of relaxivity fitting models will impact the agreement of the results.
PURPOSE
Accurate assessment of liver iron concentration (LIC) is essential for treating multiple iron-loading disorders such as thalassemia and sickle cell disease1. Magnetic resonance imaging (MRI) based relaxometry is an accurate, reproducible, and noninvasive method for assessing LIC2,3. FerriScan, an FDA approved service, quantifies LIC based on liver R2 values. Obtaining LIC results from FerriScan however, is a relatively slow and costly process. A faster and less expensive alternative for LIC quantification, which has been found to correlate well with biopsy results, is T2* relaxometry4. Despite the benefits of T2* relaxometry, the literature suggests mixed results with regard to its accuracy. While some studies have found R2* to accurately measure LIC, others have found R2* to overestimate it2,3,5. It has also been suggested that different curve fitting models may contribute to poor agreement between T2 and T2* relaxometry methods6. The purpose of the following study is to quantify LIC based on T2 and T2* relaxometry using various fitting models and to determine a model that best correlates the LIC from these two relaxometry methods.
METHODS
This retrospective study consisted of 36 image sets from 21 patients (9M 12F, age 2-17) scanned on a 1.5T (GE Twinspeed HDxT) system equipped with an 8 channel cardiac coil. Each patient underwent both T2 and T2* relaxometry protocols. For T2 relaxometry, eleven axial slices (slice thickness = 5 mm, gap = 5 mm) were obtained per scan using scan parameters similar to those described by St Pierre et al (TR = 1000 msec, TE = 6, 9, 12, 15, 18 msec, flip angle = 90°, NEX = 1, matrix size = 256 x 256)1. T2* relaxometry data were obtained using a gradient echo sequence (TR = 100 msec, TE = 1.492 msec intervals from 1.05 to 28.56 msec, flip angle = 20°, matrix size = 96 x 96, NEX = 1) with 10 mm slice thickness and gap. T2* values were calculated voxelwise by fitting the voxel intensity data as a function of TE in MATLAB. Five fitting models were used: monoexponential decay (2-parameter fit), monoexponential decay with an offset (3-parameter fit), monoexponential decay with truncation (truncated fit), analytical fit, and mixed fit. An ROI was drawn on the central axial slice of the liver while carefully avoiding vasculatures. An average T2* value was then calculated based on this ROI and converted to LIC according to the calibration curve described by Wood et al3. T2 values were also calculated in the same fashion as T2* and converted to LIC according to the curve described by St Pierre et al1. Two-tailed paired t-tests were used to assess any statistical differences among different fitting models.RESULTS
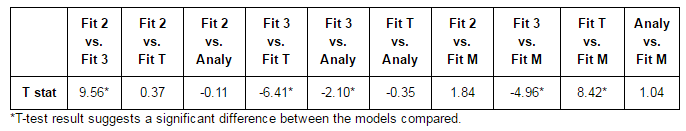
There was a significant difference between T2* values obtained from 3-parameter fitting and those obtained from other fitting models (Table 1). When T2* values from 3-parameter fitting were converted to LIC, these liver iron concentrations were significantly different from those obtained from 2-parameter fitting of T2 data (t(35) = 4.31, p < 0.05), but were not significantly different from those obtained from 3-parameter fitting of T2 data (t(35) = 1.57, p < 0.05).CONCLUSION
Different fitting models
yielded different T2* values. Since LIC is derived from T2*, it is believed
that the accuracy of LIC quantification depends on the type of fitting model
used. Since no statistical difference was found between LIC from T2 and T2* relaxometry
using a 3-parameter fit, a 3-parameter fit may be the model that best
correlates LIC derived from T2 with LIC derived from T2*. However, further
studies are needed to evaluate the accuracy of the LIC obtained from this fit
by comparing these concentrations to reference values, such as those determined from liver
biopsies or FerriScan.
Acknowledgements
References
1. St Pierre TG, Clark PR, Chua-anusorn W, et al. Noninvasive measurement and imaging of liver iron concentrations using proton magnetic resonance. Blood. 2005;105(2):855-861
2. Chan WC, Tejani Z, Budhani F, et al. R2* as a Surrogate Measure of FerriScan Iron Quantification in Thalassemia. J Magn Reson Imaging. 2014;39:1007-1011
3. Wood JC, Cathleen E, Nilesh G, et al. MRI R2 and R2* mapping accurately estimates hepatic iron concentration in transfusion-dependent thalassemia and sickle cell disease patients. Blood. 2005;106(4):1460-1465
4. Hankins JS, et al. R2* magnetic resonance imaging of the liver in patients with iron overload. Blood. 2009;113:4853-4855
5. Alústiza Echeverría JM, Castiella A, Emparanza JI. Quantification of iron concentration in the liver by MRI. Insights Imaging. 2012;3:173-180
6. Garbowski MW, Carpenter J, Smith G, et al. Biopsy-based calibration of T2* magnetic resonance for estimation of liver iron concentration and comparison with R2 Ferriscan. J Cardiovasc Magn Reson. 2014;16:40
Figures