2030
Diffusion-Weighted Imaging and Variable Flip Angle T1 Mapping in Progression Assessment of Liver Fibrosis Caused by Hepatitis B Virus Infection: A longitudinal studyPeng Hu1, Jihong Sun, Fangfang Lv, Borui Pi, Fangping Xu, Guocan Han, Xi Hu, Yue Wang, Ning Huang, Xia Wu, Yong Zhang, Jun Yang, Peipei Pang, and Xiaoming Yang
1Department of Radiology, Sir Run Run Shaw Hospital, Zhejiang University School of Medicine, Hangzhou, People's Republic of China
Synopsis
Liver fibrosis caused by Hepatitis B virus (HBV) is a worldwide health problem. However, liver biopsy as the gold standard of diagnosing and evaluating therapy of liver fibrosis is an invasive examination with possible errors from sampling and intra- and inter-observer interpretation (1, 2). The non-invasive MRI may be a promising modality to evaluate the liver fibrosis. We used diffusion-weighted imaging (DWI) and variable flip angle (VFA) T1 mapping to explore the progression of liver fibrosis caused by HBV infection in a longitudinal study.
Purpose
To evaluate the efficacies of DWI and VFA-T1 mapping, and find the optimal b value of ADC in following up liver fibrosis caused by HBV.Introduction
Liver fibrosis was once thought to be an irreversible process. However, recent studies revealed that liver fibrosis can be reversed if its pathological causes are removed (3, 4). Therefore, early diagnosis and treatment are critical for the recovery of patients with liver fibrosis caused by HBV. Several magnetic resonance imaging based methods can be used for assessment of liver fibrosis, such as magnetic resonance elastography (MRE), dynamic contrast-enhanced magnetic resonance imaging (DCE-MRI) and magnetic resonance spectroscopy (MRS), DWI and T1 mapping. Among these methods, both DWI and T1 mapping are non-invasive, available in routine clinical practice, and easily acceptable by patients. In the present study, we aimed to explore progression of HBV-type liver fibrosis using DWI and T1 mapping in a follow-up study.Methods
This prospective study was approved by the institution’s committee of human research, and written informed consent was obtained from each enrolled patient. 11 patients underwent serial follow-up MRI scans using a 3T MRI unit (Discovery 750, GE, Waukesha, WI) within 1.5 years before and after therapies. The scan sequences included (i) DWI using EPI sequence, TR,1800ms; TE, 56.1msec; field of view, 38×38cm; matrix,96×130; slice thickness, 7.0mm; and slice interval, 2.0mm, with b values of 0, 200, 500, 700 and 1000 s/mm2); (ii) T1 mapping using LAVA sequence, with 5 flip angles of 3°, 6°, 9°, 12° and 15°, TR/TE, 2.48/1.17 msec; bandwidth, 125 Hz/pixel; matrix, 256×192; slice thickness, 5mm; slice interval, 0mm; and field of view, 38×38cm. The follow-up biopsies were also performed. Six of eleven patients were clinically proven to be cirrhosis (F4), while the remaining five patients were proven to be liver fibrosis at different stages according to the METAVIR system, including 3 patents at F2, 1 at F3, and 1 at F4 (cirrhosis) stage. At the end of follow-up, two of the F2-stage patients had progressed to F3 and the others remained unchanged. For each patient, four consecutive MRI examinations were performed, including one baseline MRI before the treatment, and three follow-up MRIs at 0.5-year interval after the treatment. ADC parameters with four pairs of b values (0/200, 0/500, 0/700, 0/1000 s/mm2) and T1 mapping were correlated to the pathology-confirmed stages of liver fibrosis. The pathological stages were then divided into two groups, F2-3 and F4, since there was no F1 patient and the two F2 patents had progressed to F3. The receiver operating characteristic (ROC) analysis and repeated measurement (RM) analysis of variance were used for statistical analysis.Results
The ROC analysis using different ADC parameters was demonstrated in Fig. 1. The ADC value using b=500s/mm2 was the best diagnostic parameter of DWI in differentiating F2-3 and F4 staged liver fibrosis, and significant inter-group difference between F2-3 and F4 group was found only for ADC values at b=500s/mm2 (p<0.05). The RM analysis of variance revealed no significant intra-group differences of ADC values except at b=200s/mm2 (Fig.3). For T1 mapping, RM analysis of variance revealed significant differences between F2-3 group and F4 group (p<0.05), with no intra-group differences within F2-3 or F4 group among the 4 exams. ROC analysis of VFA-T1 mapping showed that using a single cutoff T1 value of 482, AUC of 0.893, 0.786, 0.857 and 0.750, sensitivity of 0.857, 0.857, 0.857 and 0.857 and specificity of 1.000, 0.750, 0.750 and 0.750 could be achieved respectively in the 4 exams (Fig. 2). The T1 mapping results were consistent among the 4 exams, with no intra-group differences (Fig. 4) and close ROC analysis results.Conclusions
The ADC value at the optimal b value of 500s/mm2 and T1 mapping were potential good imaging biomarkers for differentiating F2-3 from F4 staged liver fibrosis. Combining this ADC value with T1 relaxation time helps to evaluate progression of liver fibrosis.Acknowledgements
This study was supported by the Program for National Science and Technology Major Project of China (2013ZX10002004-001-005)References
1. Bedossa P, Dargere D, Paradis V. Sampling variability of liver fibrosis in chronic hepatitis C. Hepatology. 38(6):1449-1457 (2003). 2. Cadranel JF, Rufat P, Degos F. Practices of liver biopsy in France: results of a prospective nationwide survey. For the Group of Epidemiology of the French Association for the Study of the Liver (AFEF). Hepatology, 2(3):477-481 (20003). 3. Chang TT, Liaw YF, Wu SS, Schiff E, Han KH, Lai CL, Safadi R, Lee SS, Halota W, Goodman Z, Chi YC, Zhang H, Hindes R, Iloeje U, Beebe S, Kreter B. Long-term entecavir therapy results in the reversal of fibrosis/cirrhosis and continued histological improvement in patients with chronic hepatitis B. Hepatology.52(3):886-893 (2010). 4. Iredale JP. Models of liver fibrosis: exploring the dynamic nature of inflammation and repair in a solid organ. J Clin Invest.117(3):539-548 (2007).Figures
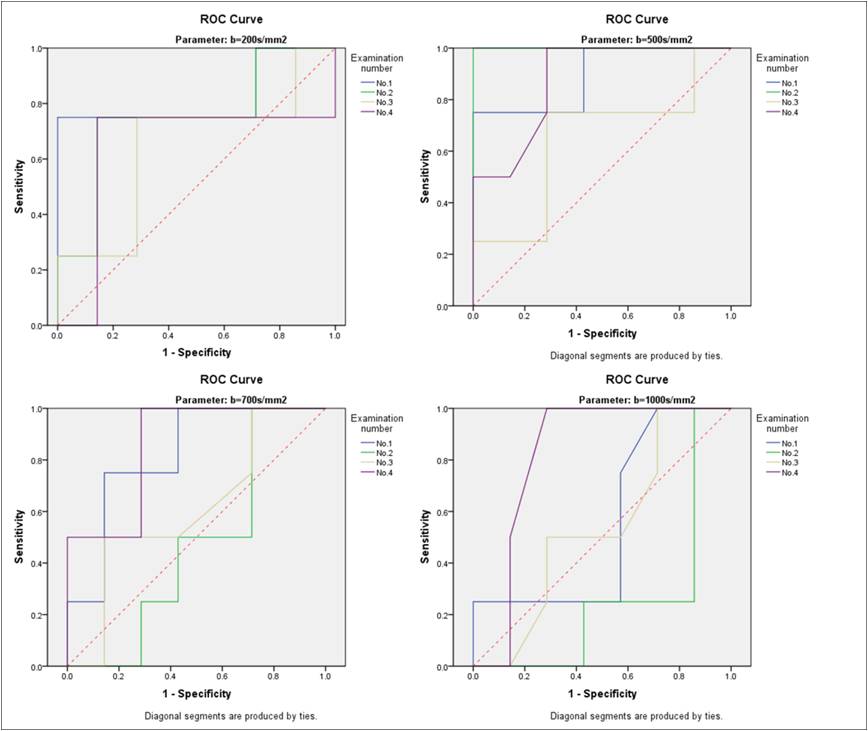
Figure 1. Area
under the ROC curve (AUC) of ADC values at four time points
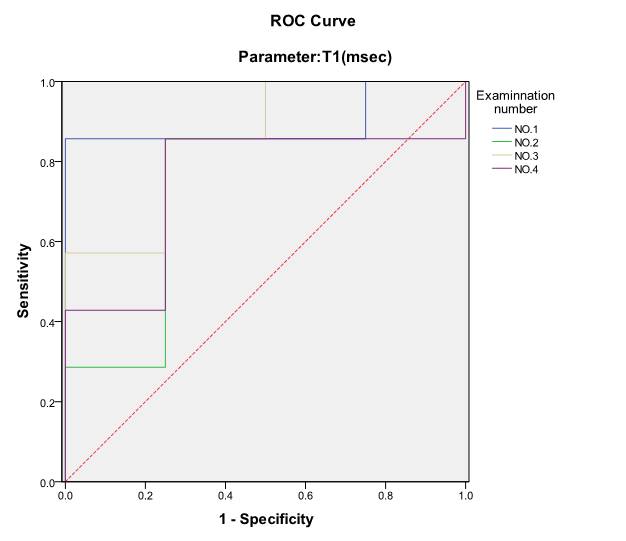
Figure 2. Area under the ROC curve (AUC) of T1
relaxation times.
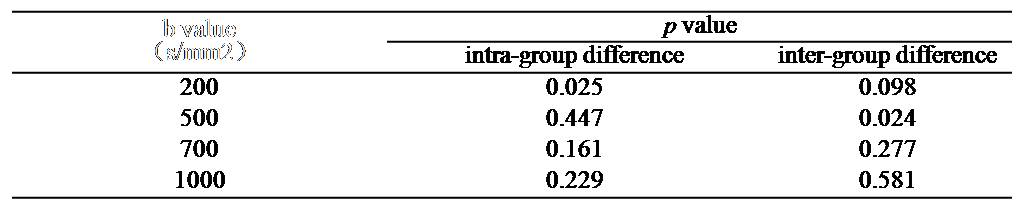
Figure 3. Repeated measures analyses of
variance of four b values

Figure 4. Repeated measures analyses of
variance of T1 relaxation times