2028
The effects of a 2 week hyperenergetic high carbohydrate or high fat diet on subcutaneous, visceral fat and metabolism1Sir Peter Mansfield Imaging Centre,Physics and Astronomy, Nottingham University, Nottingham, United Kingdom, 2School of Life Sciences, Nottingham University, Nottingham, United Kingdom, 3NIHR Nottingham Digestive Diseases Biomedical Research Unit, Nottingham University Hospitals NHS Trust and University of Nottingham
Synopsis
With the rise in obesity globally, there is great interest in quantifying body composition and in particular metabolically active visceral adipose tissue (VAT). Increased accumulation of VAT has been linked with an increase in risk factors for cerebrovascular disease and Type 2 Diabetes (T2DM) . We investigated the degree to which weight, subcutaneous fat visceral fat, liver and lipid markers are affected by 2 weeks of overfeeding at 25% excess energy given as either carbohydrate or fat. 2 weeks of 25% excess energy overfeeding of either carbohydrate of fat does not alter subcutaneous or visceral abdominal fat in line with no changes in weight. MRI measurements of SAT and VAT can be used in longitudinal studies of diet to ascertain any changes in abdominal body fat deposition.
Introduction
With the rise in obesity globally, there is great interest in quantifying body composition and in particular metabolically active visceral adipose tissue (VAT). Increased accumulation of VAT has been linked with an increase in risk factors for cerebrovascular disease [1] and Type 2 Diabetes (T2DM) [2]. We investigated the degree to which weight, subcutaneous fat visceral fat, liver and lipid markers are affected by 2 weeks of overfeeding at 25% excess energy given as either carbohydrate or fat.Material and Method
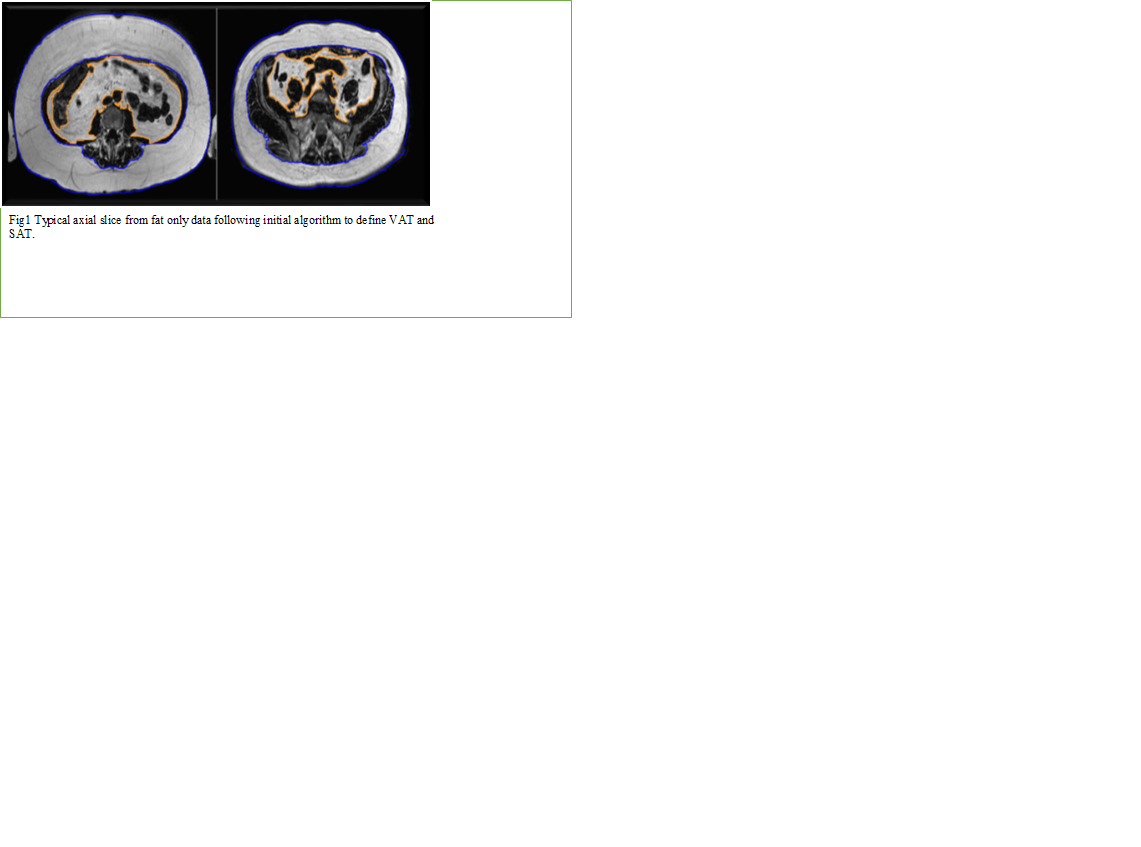
21 overweight but otherwise healthy males (40.3 ± 2.5 yrs, BMI 31 ± 1.0 kgm-2) were recruited. All subjects gave written informed consent. Participants completed validated questionnaires concerning medical history, lifestyle, and health practices. Participants attended the Sir Peter Mansfield Imaging Centre following an overnight fast and were scanned using 3.0 T whole-body scanner (Achieva, Philips Medical System, Netherlands) prior to and after a 2 week dietary intervention. Prior to visit 1, volunteers consumed an isocaloric diet for 1 week. Volunteers were then randomized into two groups and given a hyper energetic diet (25% excess energy) of either high carbohydrate, HC (65% CHO, 20% fat, 15% protein) or high fat, HF (38% CHO, 47% fat, 15% protein) to be consumed over two weeks before returning for visit 2. The images to determine volumes of subcutaneous and visceral fat were measured using a 3D T1 weighted mDIXON protocol [3], which reconstructed in-phase, out-of-phase, water and fat only images in the transverse plane. This acquired 150 slices in 3 stacks; each 50 slice stack acquired in a short breath hold (<20s). Parameters for both field strengths were as follows: flip angle = 15o, SENSE = 2.0, TE1 = 1.8 ms, TE2 = 4 ms, TR = 5.4 ms, FOV 400-480 x 370-447 mm2 acquired resolution 1.5 x 1.95 x 6 mm3, reconstructed resolution 1.25 x 1.25 x 3 mm3. The segmentation algorithm used software written using IDL 6.4 (Research Systems INC, Boulder, CO, USA) and has been described elsewhere [4]. Outputs from the algorithm were VAT, SAT and TAT in mL from the 30 slices centred at the L4/L5 intervertebral disc (Fig1). The algorithm then output the VAT and SAT and ratio of VAT/SAT within the central 30 slices (15 below and 14 above the defined L4/L5 disc). Fasted liver fat fractions were measured using MRS as described previously [5]. Fasting serum insulin, glucose, triacylglyceride (TAG), free fatty acids (FFAs), lipoapoproteins, total cholesterol and liver function were also obtained before and after the 2 weeks dietary intervention. All results are reported as mean ± standard deviation.Results
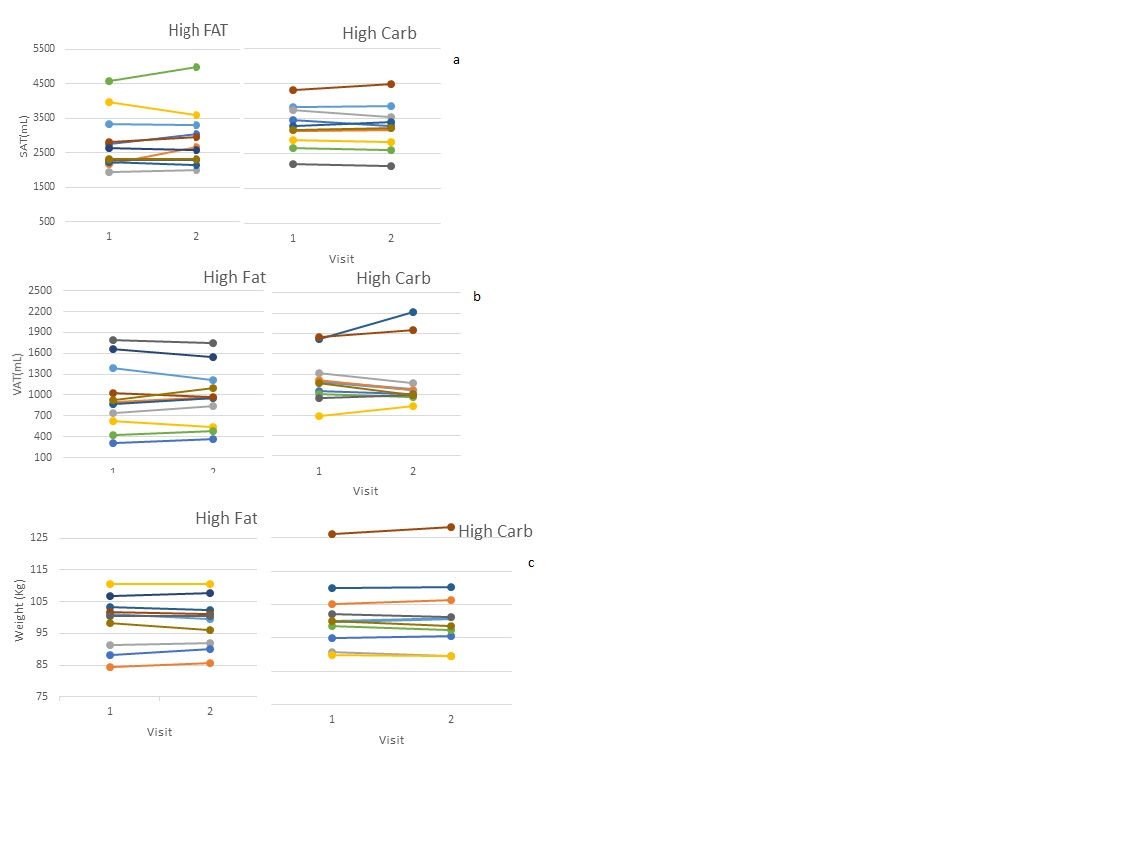
The baseline volumes of VAT were 1224±346 ml and 950±497ml for HC and HF groups respectively, and the baseline volume of SAT were 2767±612 ml and 2582±617 ml for HC and HF groups respectively. On visit two (following the dietary intervention) there was no significant change in VAT (1229±466) or SAT (2449±953) in either group (P > 0.2) (figure 2). The baseline weight on visit 1 was 101.7±10.5 and 97.6±8.15 for the HC and HF groups respectively, and there was no significant change on visit 2 (P > 0.9). Liver fat fraction values increased significantly in the HC group (3.5 ± 1%, P>0.05) but not in the HF group (1.7 ± 1.1%, P>0.3) as reported previously [5]. There were no significant changes in blood markers.Conclusion
2 weeks of 25% excess energy overfeeding of either carbohydrate of fat does not alter subcutaneous or visceral abdominal fat in line with no changes in weight. MRI measurements of SAT and VAT can be used in longitudinal studies of diet to ascertain any changes in abdominal body fat deposition. Measurements of SAT, VAT and TAT using a semi-automatic segmentation algorithm show good repeatability, measurement of VAT and SAT on the same day showed that in VAT measurement the Pearson correlation coefficient was R=0.96 and the coefficient of variation CV% = 0.9% and R=0.98 and the coefficient of variation CV%=0.8% for SAT [6]. Significant changes in liver fat from visit 1 to visit 2 were observed in the HC group as reported previously [5], which indicates that changes in fat can occur within tissue before potentially impacting adipose stores.Acknowledgements
No acknowledgement found.References
1. Karcher HS, Holzwarth R, Mueller HP, et al. Body fat distribution as a risk factor for cerebrovascular disease: an MRI-based body fat quantification study. Cerebrovasc Dis 2013;35(4):341-348. Abbasi SA, 2.Hundley WG, Bluemke DA, et al. Visceral adiposity and left ventricular remodeling: The Multi-Ethnic Study of Atherosclerosis. Nutr Metab Cardiovasc Dis 2015;25(7):667-676.Eggers H, Brendel B, Duijndam A, 3.Herigault G. Dual-echo Dixon imaging with flexible choice of echo times. Magn Reson Med 2011;65(1):96-107
4. Hoad et al. ISMRM 2014;4310
5.Bawden S, et al., Effect of a two week hyper energetic matched high carbohydrate vs high fat diet on hepatic and fat stores and metabolic blood markers: A 1H MRS Study. Proceedings 24th Scientific Meeting of the ISMRM, Singapore, 2016.
6.Mehri Kaviani , et al.,Semi-automatic segmentation of abdominal fat: repeatability of measurements and comparison between 1.5T and 3T. Biritsh Chapter meeting 2015.
Figures