2023
Pancreatic MRI associated with pancreatic fibrosis and postoperative fistula: comparison between pancreatic cancer and non-pancreatic cancer tissues1Department of Radiology, Gifu University, Gifu, Japan, 2Department of Pathology, Gifu University, Gifu, Japan
Synopsis
Pancreatic cancer (PC) occurs a histopathologically stronger pancreatic fibrosis compared to other non-PC. The risk factors of postoperative pancreatic fistula (POPF) were reported as soft or normal pancreatic parenchyma, and ampullary or duodenal disease. In this study, in patients with non-PC, frequency of POPF was greater due to lower grade of pancreatic fibrosis, and our results suggest that T1 signal and ADC value of the pancreas may link to the POPF. The T1 signal and ADC value of the pancreas may be a potentially useful imaging biomarker for the assessment of pancreatic fibrosis and POPF.
Purpose
To evaluate the potential value of magnetic resonance (MR) imaging for grading pancreatic fibrosis and predicting the postoperative pancreatic fistula (POPF) and to compare between pancreatic cancer (PC) and non-pancreatic cancer (non-PC) cases.Materials and Methods
This retrospective study was approved by our institutional review board and written informed consent was waived. Forty patients (23 men and 17 women; age range, 52–82 years; mean 69.9 ± 7.9 years) underwent pancreatoduodenectomy to treat pancreatic head cancer and other pancreatic or bile duct tumors. Among the 40 patients, the final diagnosis was pancreatic head adenocarcinoma in 31 patients, intraductal papillary mucinous carcinoma in two, extrahepatic bile duct carcinoma in two, ampullary carcinoma in two, intraductal papillary mucinous neoplasm in one, pancreatic adenoma in one, and paraganglioma in one.
MR imaging was performed using a 1.5-T MR system (Intera Achieva Nova Dual, Philips Healthcare) and a 6-channel torso array coil. The basic MR imaging protocol consisted of the following imaging sequences: breath-hold two dimensional fat-suppressed axial T1-weighted fast field-echo imaging (3D-FFE); in-phase and opposed-phase T1-weighted gradient-recalled-echo imaging; respiratory-triggered two-dimensional fat-suppressed axial T2-weighted turbo spin-echo imaging; and free-breathing two dimensional axial diffusion-weighted imaging with a single-shot echo planar sequence.
Histopathological evaluation of the surgical specimens in the area adjacent to resection margins was conducted. Azan staining was performed to grade the degree of pancreatic fibrosis and hematoxylin-eosin-staining to grade the degree of fat deposition and interstitial edema. The grades for pancreatic fibrosis, fat deposition, and interstitial edema in nontumoral pancreatic parenchyma were determined semiquantitatively using a 4-point scale.
The signal intensities of the pancreatic parenchyma (SIpancreas) and paraspinal muscle (SImuscle) were measured on 2D-FFE T1-, in- and opposed-phase T1-, and T2-weighted images for calculation of the signal intensity ratio (SIR = SIpancreas/SImuscle). ADC value of pancreatic parenchyma was also calculated. The SI measurements were made at the side of the pancreatic head in the resection margin to match locations of the surgical specimen histopathologically evaluated as closely as possible.
Each MR imaging measurement was compared with grades for pancreatic fibrosis, fat deposition, and interstitial edema. Grade for pancreatic fibrosis, MR imaging measurements, and frequency of POPF between PC and non-PC were compared. Differences in MR imaging measurements between patients with and without POPF were also compared.
Results
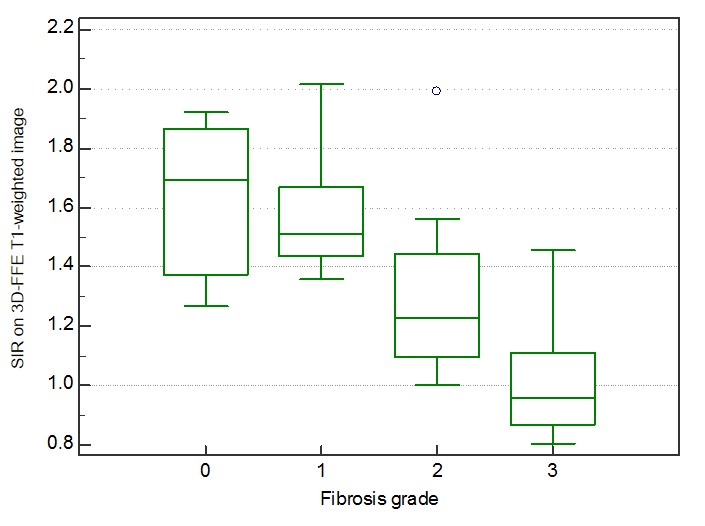
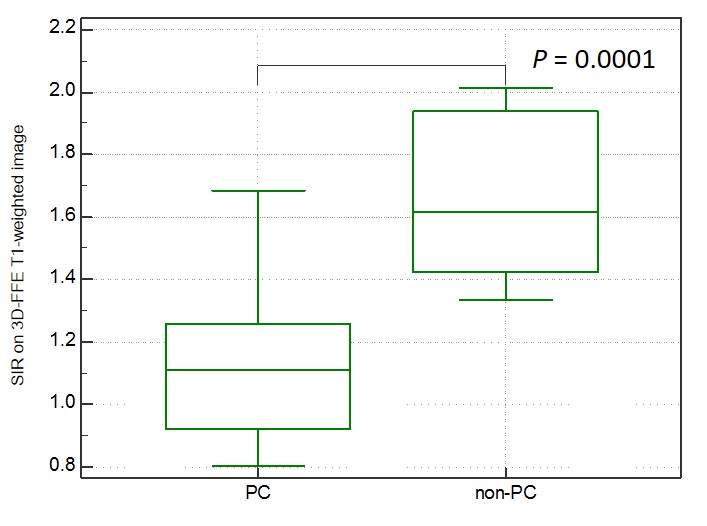
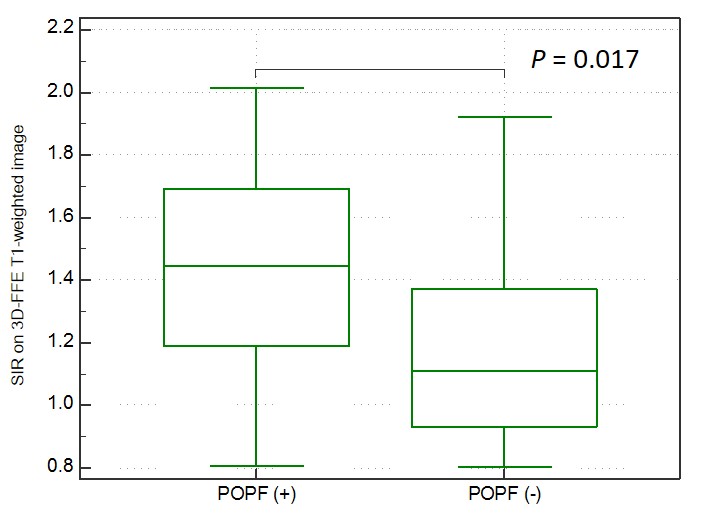
The SIRs on 3D-FFE T1- (r = -0.63, P < 0.0001), in- (r = -0.44, P = 0.0042) and opposed-phase T1-weighted images (r = -0.36, P = 0.023), and ADC value (r = -0.49, P = 0.0012) were significantly correlated with the pancreatic fibrosis grade and ADC value was also correlated with the interstitial edema grade (r = -0.33, P = 0.041). The SIR on 3D-FFE T1-weighted image decreased constantly as the pancreatic fibrosis grade progressed (P < 0.0001), and independently associated with the pancreatic fibrosis grade (r = -0.71, P < 0.0001) (Figure 1). The frequency of POPF was significantly greater in patients with non-PC compared with in those with PC (P = 0.0067). The patients with non-PC demonstrated lower grade of pancreatic fibrosis (P = 0.019) and higher SIR on 3D-FFE T1-weighted image (P = 0.0001) than those with PC (Figure 2). The SIR on 3D-FFE T1-weighted image (P = 0.017) was significantly higher in patients with POPF than in those without POPF (Figure 3).Discussion
Compared to distal bile duct, ampullary, and duodenal cancers, PC occurs a stronger pancreatic fibrosis (1). This is a reason why fistula rate after the pancreatic head resection is lowest in PC case among four above. Regarding the paraneoplastic pancreatic fibrosis associated with PC, two major reasons were reported. First, PC cells activate the pancreatic stellate cells (PSCs) around them, and this activation leads to the fibrosis of the tumor and surrounding pancreatic tissues as well. Second, because PC originates in the pancreatic ductal system, it obstructs the smaller ductules or even the main pancreatic duct as a consequence of pancreatitis due to ductal obstruction and create pancreatic fibrosis (2, 3).
We reported that pancreatic T1 signal decreased as the pancreatic fibrosis grades progressed (4, 5). In this study, pathologically proven pancreatic fibrosis was more progressed in PC case than non-PC. T1 signal decreased as the pancreatic fibrosis grades progressed. We believe that pancreatic T1 signal may be a potential biomarker for the estimation of pancreatic fibrosis and risk for POPF.
In conclusion, the SIR on 3D-FFE T1-weighted image of the pancreas demonstrated the degree of pancreatic fibrosis and reflected the rate of POPF. It may be a potential imaging biomarker for the estimation of pancreatic fibrosis and risk for POPF.
Acknowledgements
The authors of this manuscript declare no relationships with any companies whose products or services may be related to the subject matter of the article.References
1. Erkan M, Hausmann S, Michalski CW, et al. How fibrosis influences imaging and surgical decisions in pancreatic cancer. Front Physiol. 2012;3:389.
2.Tanaka T, Ichiba Y, Fujii Y, Itoh H, Kodama O, Dohi K. New canine model of chronic pancreatitis due to chronic ischemia with incomplete pancreatic duct obstruction. Digestion. 1988;41(3):149-55.
3. Kloppel G, Detlefsen S, Feyerabend B. Fibrosis of the pancreas: the initial tissue damage and the resulting pattern. Virchows Arch. 2004;445(1):1-8.
4. Watanabe H, Kanematsu M, Tanaka K, et al. Fibrosis and postoperative fistula of the pancreas: correlation with MR imaging findings--preliminary results. Radiology. 2014;270(3):791-9.
5. Noda Y, Goshima S, Tanaka K, et al. Findings in pancreatic MRI associated with pancreatic fibrosis and HbA1c values. J Magn Reson Imaging. 2016;43(3):680-7.
Figures