2021
Gadoxetate disodium (Gd-EOB-DTPA) DCE-MRI of the Liver for the Assessment of Parenchymal Alterations in Primary Sclerosing Cholangitis1Diagnostic and Interventional Radiology and Nuclear Medicine, University Medical Center Hamburg Eppendorf, Hamburg, Germany, 2Neuroradiology, University Medical Center Hamburg Eppendorf, Hamburg, Germany, 3Internal Medicine, University Medical Center Hamburg Eppendorf, Hamburg
Synopsis
This study evaluates the feasibility of dynamic contrast-enhanced magnetic resonance imaging (DCE-MRI) with Gd-EOB-DTPA for detection of hepatic inflammation/fibrosis in comparison to Ultrasound elastography in primary sclerosing cholangitis (PSC).
Purpose
Assessment of fibrosis/inflammation using dynamic contrast-enhanced magnetic resonance imaging (DCE-MRI) with Gd-EOB-DTPA and Ultrasound elastography in primary sclerosing cholangitis (PSC).Material and Methods
Dynamic contrast-enhanced magnetic resonance imaging
DCE-MRI with gadolinium ethoxybenzyl diethylenetriamine pentaacetic acid (Gd-EOB-DTPA) was performed on a 3.0 Tesla in 48 patients with proven PSC (male:female 31:17; mean age 43.4 ± 14.5 years). Areas of suspected inflammation with hyperintense signal were identified by two radiologists using T2 weighted axial and coronal sequences (TR 1250 ms; TE 80 ms; FA 90; Fov 400 x 400 mm). DCE-MRI sequence was performed using a T1-weighted three-dimensional (3D) FFE (TR/ TE/flip angle 3.9 ms/1.15 ms/20°, field of view (FOV) 400 mm (RL), 300 mm (AP) and 175 (FH) mm, acquisition matrix 160 x 107 mm2, reconstruction matrix 320x320 (reconstruction voxel size 1.25mm), 70 slices, slice thickness 3 mm with oversampling factor of 1.6 and SENSE factor 2.5(AP)/2 (FH)). The whole liver was scanned with a navigated respiratory compensation using respiratory triggering and tracking during 140 dynamic scans over a time period of 12 minutes, and patients were asked to breath slowly at the same depth during each acquisition. Six volumes were acquired pre-contrast for baseline calculations, followed by 134 volumes with step-wise increase in sampling intervals. A dose of 0.1 mL/kg Gd-EOB-DTPA (0.25 mmol/mL) was injected into the anterior cubital vein, coinciding with the start of the sixth acquired volume. The contrast was injected using a power injector (Spectris MR injector System, Medrad, Pittsburgh, PA) at an infusion rate of 2 mL/s, followed immediately by a bolus of 20 mL of saline (NaCl 0.9%) at the same infusion rate.
Ultrasound Elastography
Hepatic fibrosis was diagnosed using ultrasound elastography (USE) (FibroScan©) within an interval of ± 6 month to DCE-MRI. USE derived stages of fibrosis which were classified according to METAVIR fibrosis score with absent or mild fibrosis < 7kPA, significant fibrosis >7kPA<9kPA, severe fibrosis > 9.5 < 12.5kPA, and cirrhosis >12.5 kPA 1.
Image analysis
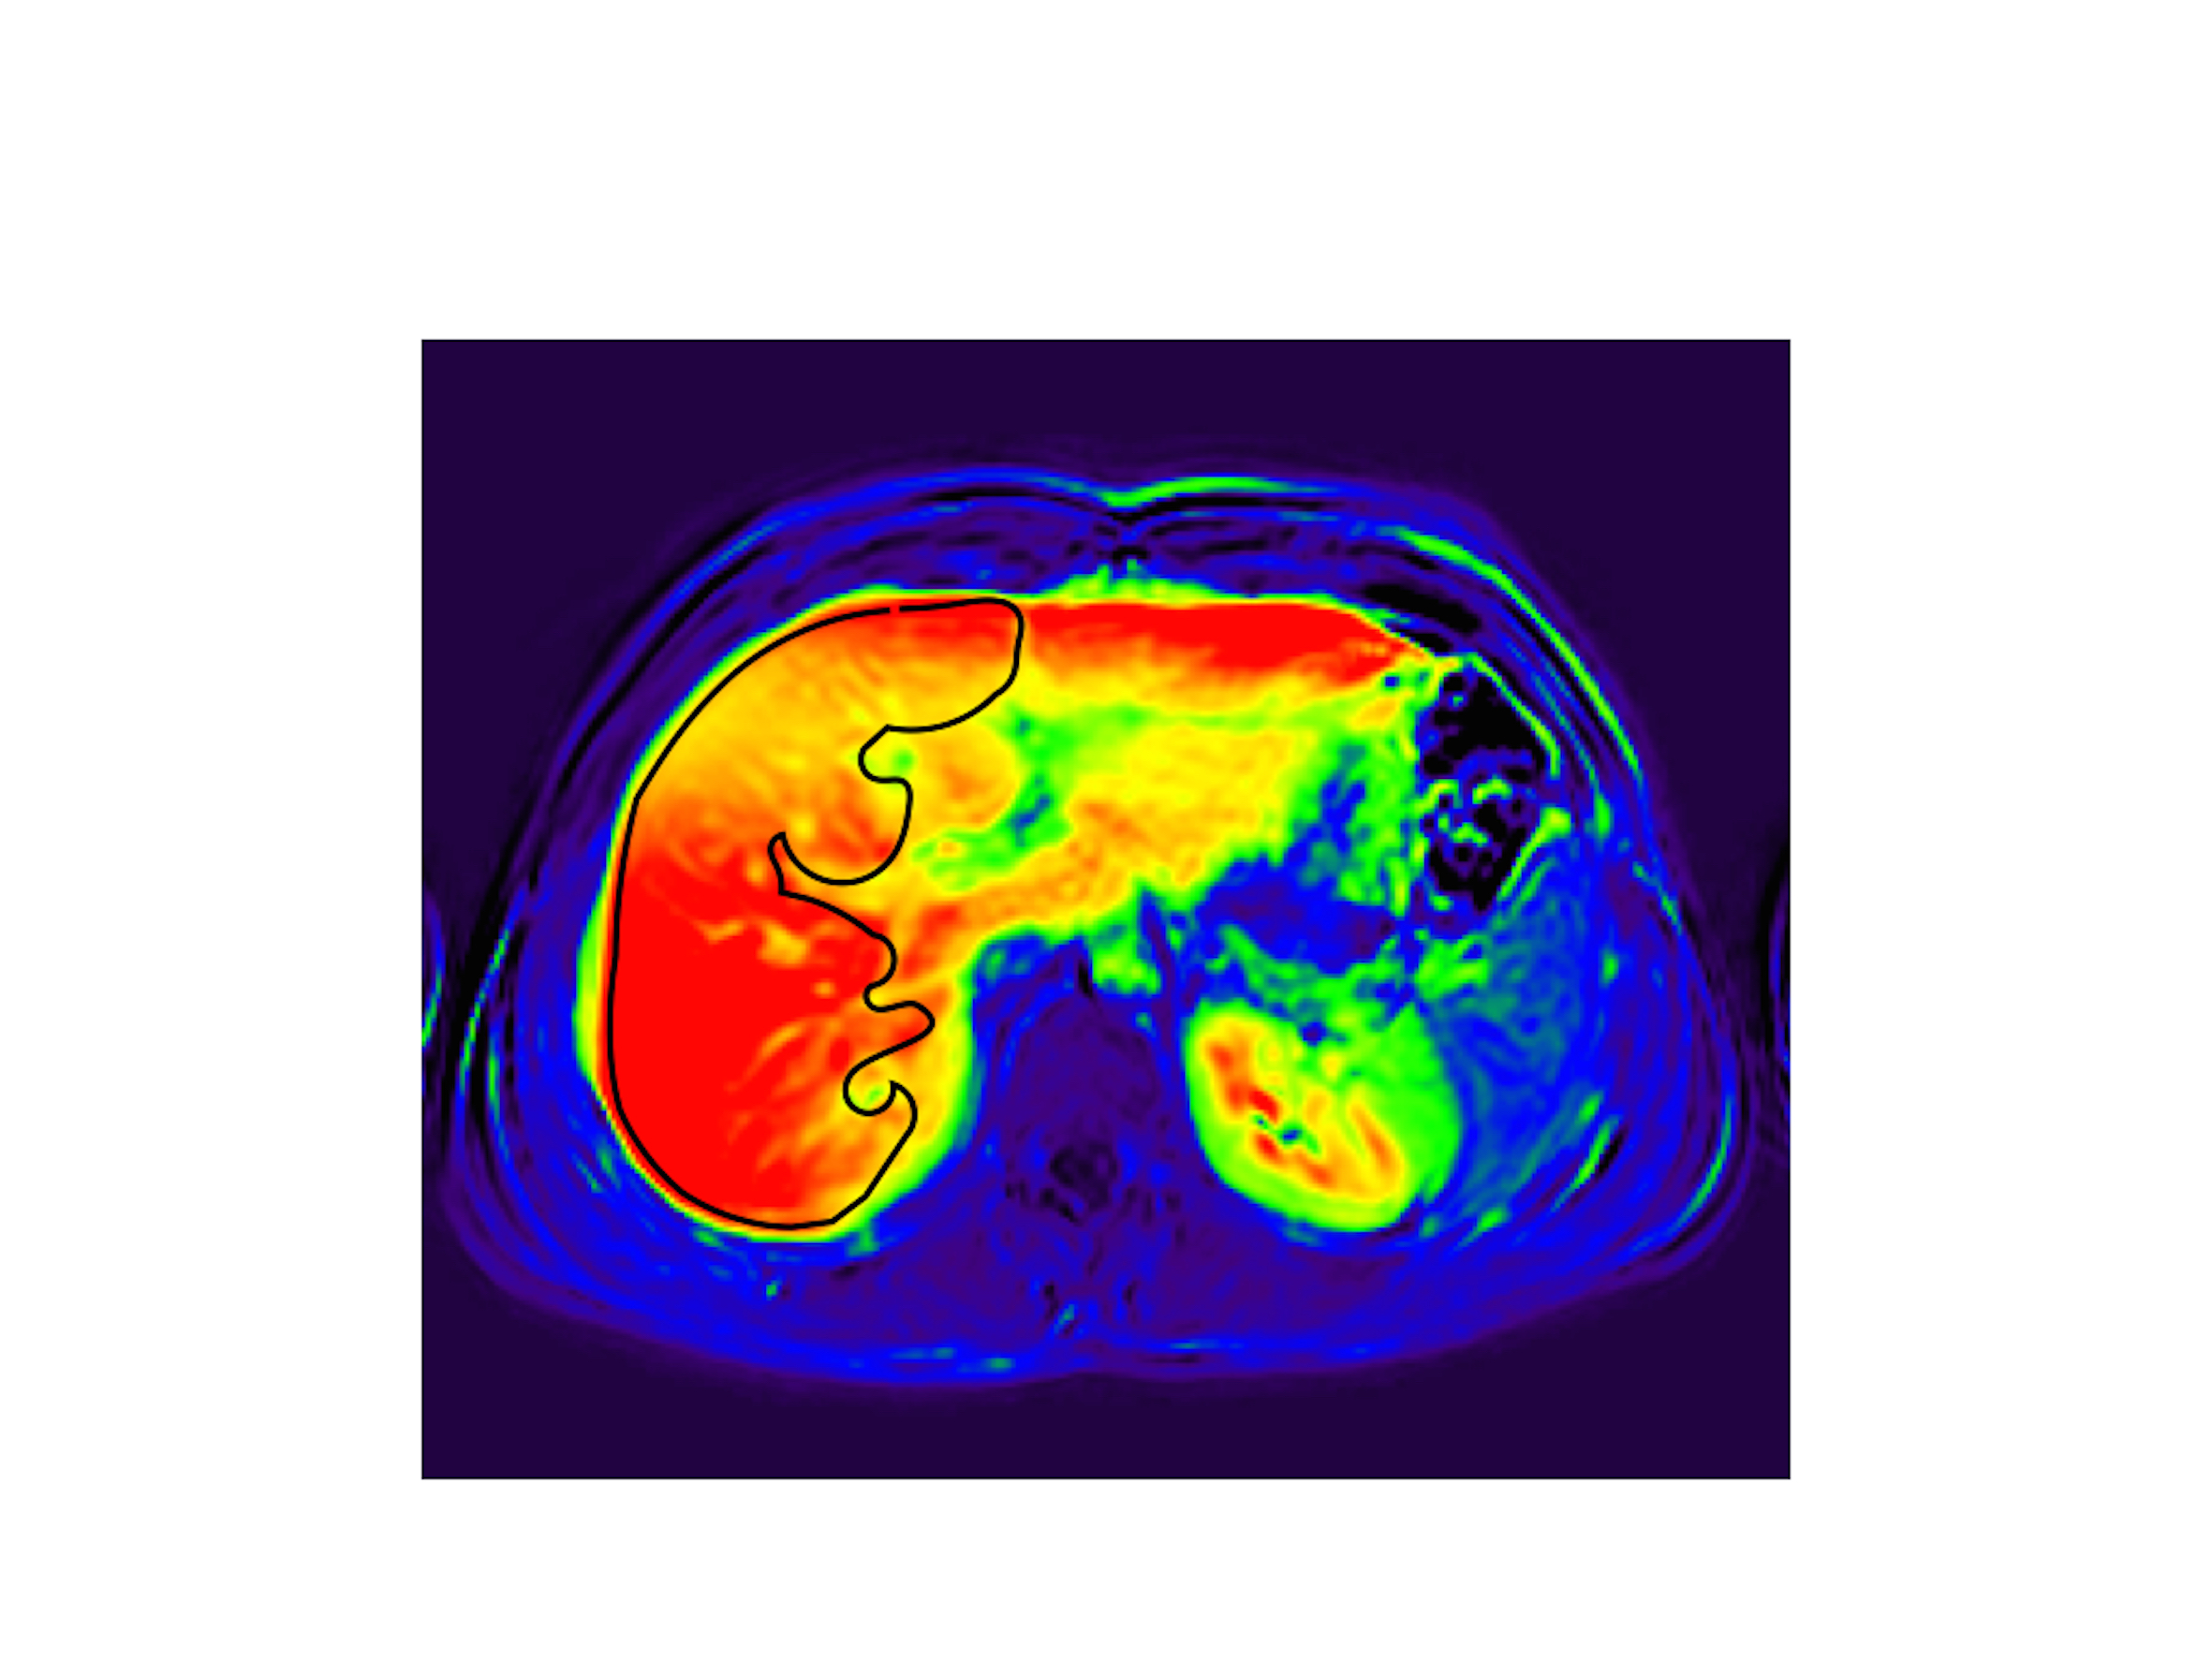
The following parameters were assessed by the DCE-MRI: hepatocellular uptake rate (Ki; 1/100/min), extracellular volume (Ve; ml/100ml), venous plasma flow (Va; ml/min/100ml), and arterial plama flow (Fa; ml/min/100ml). These parameters were analyzed using a dual-inlet two compartment uptake model 2 and an in-house software written in MATLAB (Mathworks, MI, USA). Region of interest (ROI) covering areas of T2 hyperintense and T2 isointense appearing signals were drawn onto the RL by two radiologists in consensus, using plasma flow maps and AUC maps (90 seconds after contrast agent infusion) in axial orientation (Fig. 1). In addition, three ROIs covering the whole hepatic parenchyma were placed in the RL avoiding greater vessels.
Statistical analysis
Parametric statistics (mean, standard deviation, Pearson correlation) were used to compare the MRI data with the USE results. The diagnostic performance of discriminating F0/1 to F4 was analyzed using receiver operating characteristics (ROC) curves.
Results
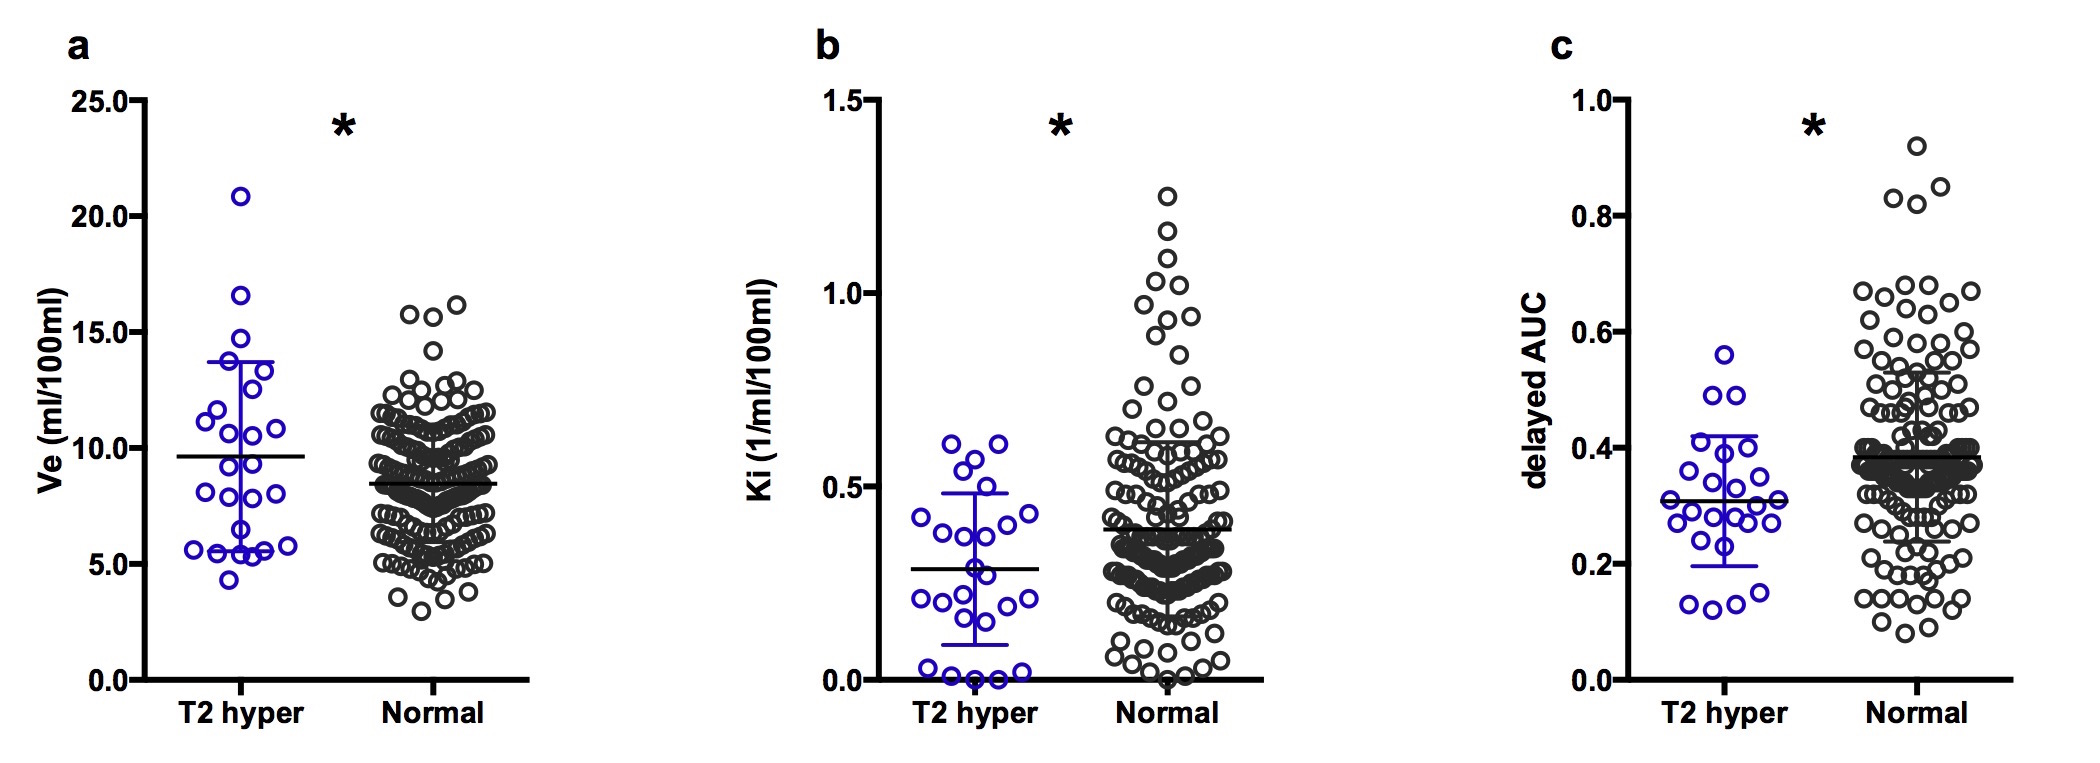
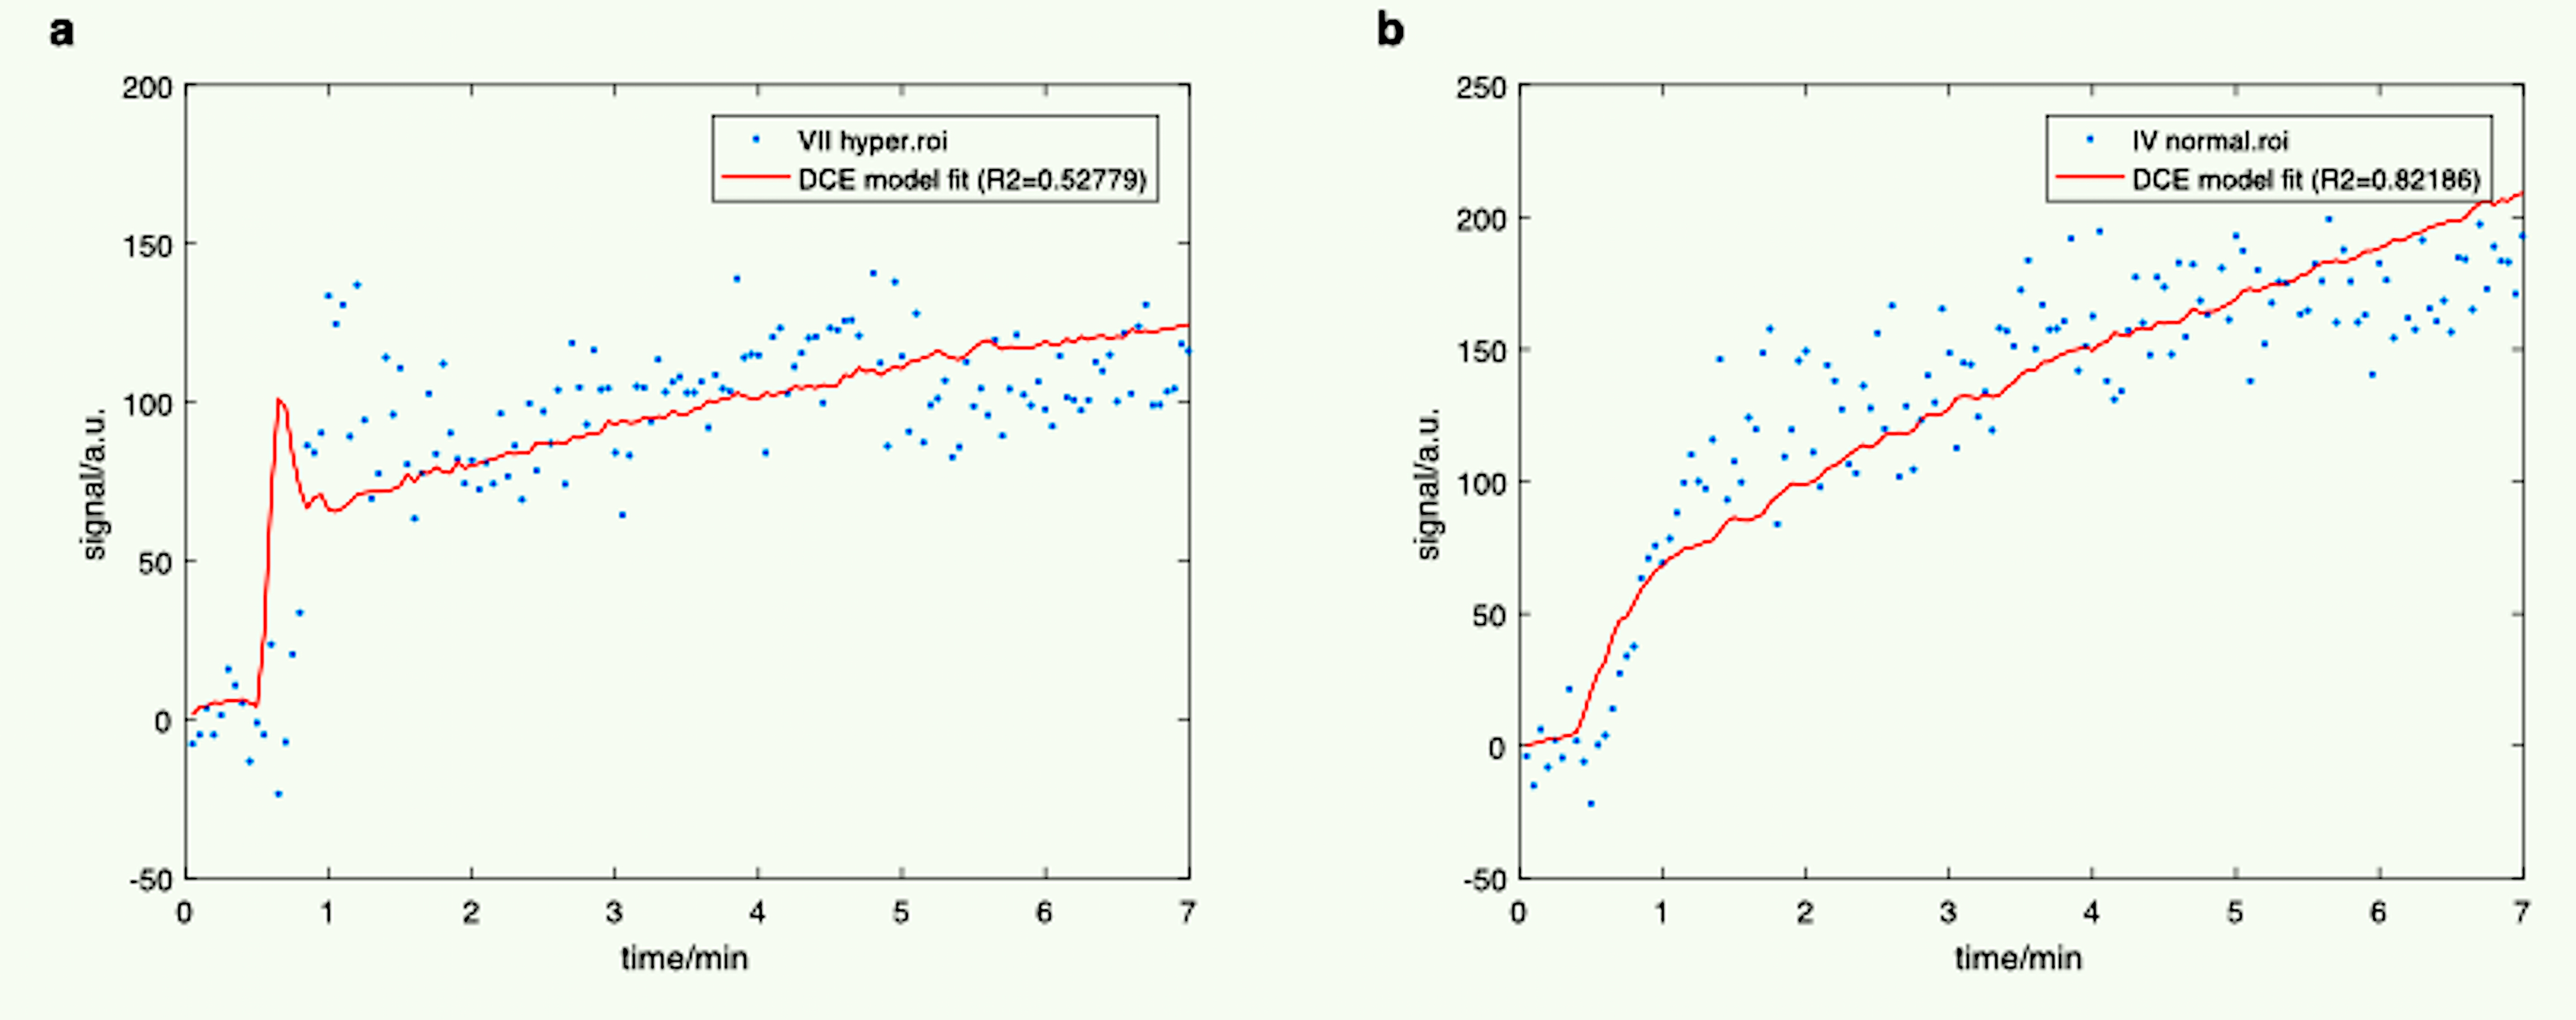
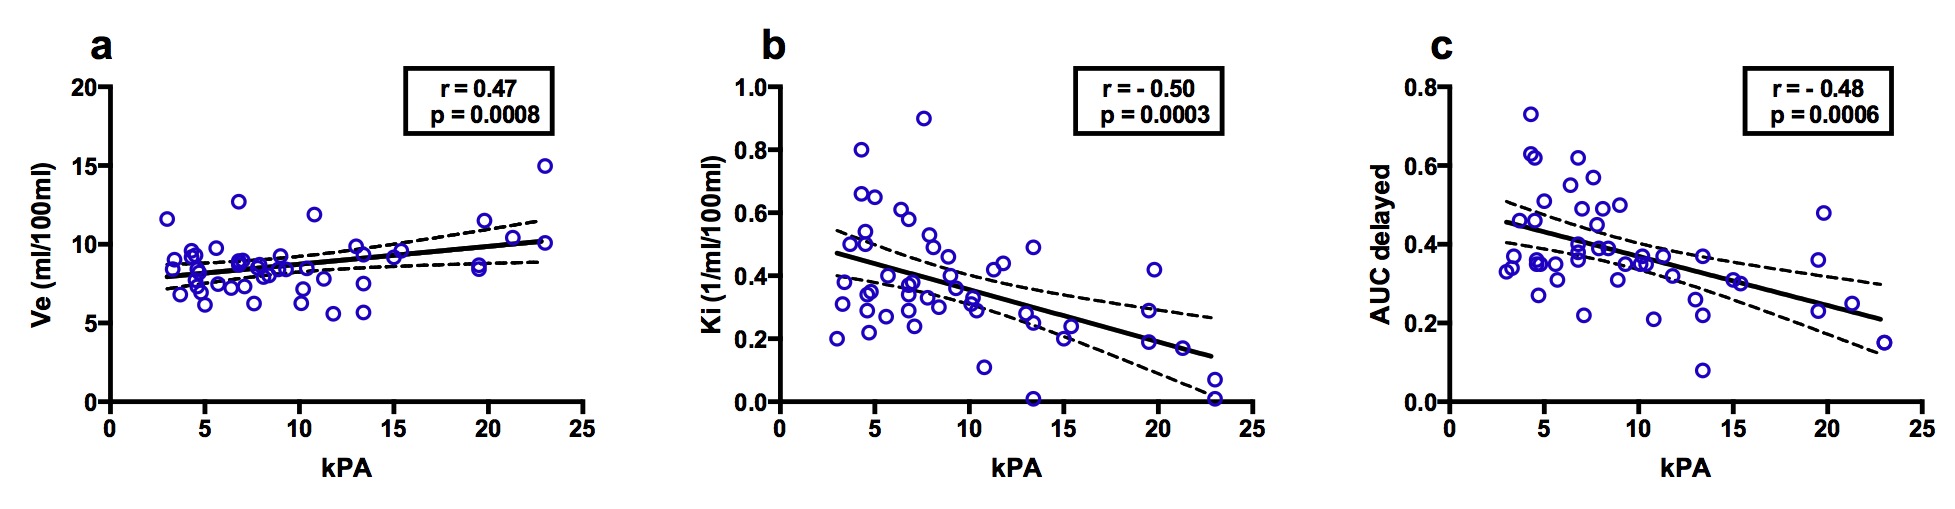
Typical T2 hyperintense wedge shaped areas of the right liver lobe were detected in 9/48 patients. Ki and delayed AUC were significantly diminished in T2 hyperintense areas (p<0.03). Ve was increased in T2 hyperintense areas (p>0.05) (Fig. 2). Time intensity curves showed a distinct pattern in T2 hyperintense areas with an early peak enhancement (< 90 sek,) followed by a quick decay and then a slowly increasing plateau (>90 to 210 sek) (Fig. 3a). Normal areas were characterized by a rapid steady enhancement followed by an increasing plateau (90 to 210 sek.) (Fig. 3b). In comparison to METAVIR score adapted from USE, the graduation of fibrosis was: F0/1 in 21/48 patients; F2 in 9/48; F3 in 7/48; F4 in 11/49 (Table 1). A significant correlation was found between DCE-parameters Ve, Ki and AUC delayed and fibrosis stage (Fig. 4). The area under the receiver operating characteristic (ROC) curve of DCE parameters for discrimination of F0/1 to F4, was 0.85 and 0.71 for Ki and Ve, respectively.
Conclusion
Hepatocellular uptake rate Ki and extracellular volume Ve significantly correlate with stage of fibrosis in PSC patients. Typical wedge-shaped hyperintense T2 areas are characterized by a significant reduction in hepatocellular uptake rate and increased extracellular volume, likely caused by segmental fibrosis.Acknowledgements
No acknowledgement found.References
1. Castera L, Vergniol J, Foucher J, et al. Prospective comparison of transient elastography, Fibrotest, APRI, and liver biopsy for the assessment of fibrosis in chronic hepatitis C. Gastroenterology 2005;128(2):343-350.
2. Sourbron S, Sommer WH, Reiser MF, Zech CJ. Combined quantification of liver perfusion and function with dynamic gadoxetic acid-enhanced MR imaging. Radiology 2012;263(3):874-883.
Figures